Dynamic Grid EA
- エキスパート
- バージョン: 1.0
- アクティベーション: 5

PS DynamicGrid is a MetaTrader 5 Expert Advisor designed to trade a dynamic grid strategy with trend filtering and equity-based risk management.
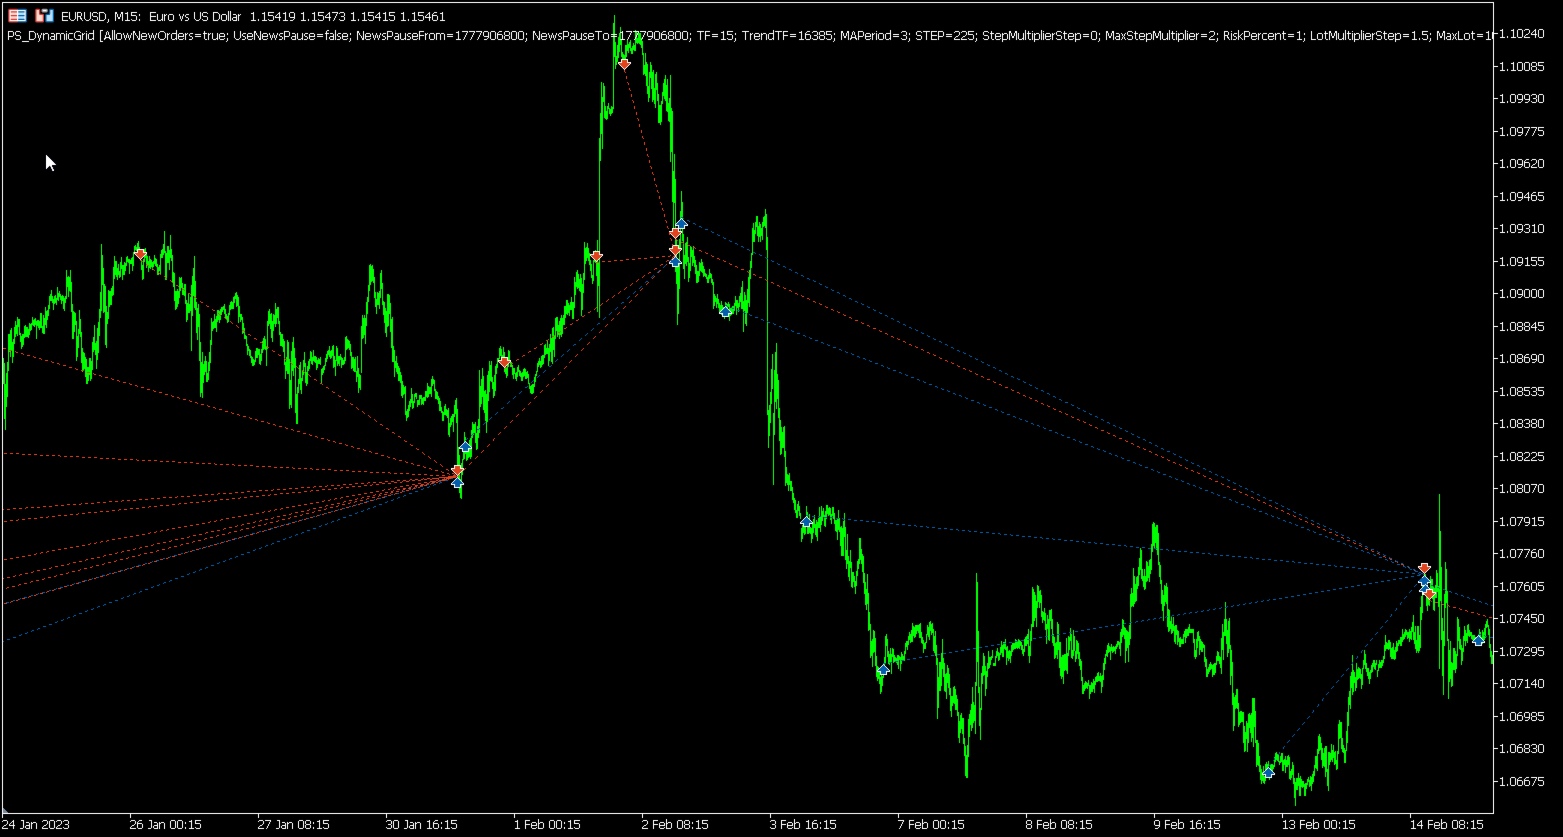
The EA analyzes market direction using moving averages on two separate timeframes: the main signal timeframe and a higher trend timeframe. Buy trades are allowed only when the current price is above both moving averages, while sell trades are allowed only when the current price is below both moving averages.
The first trade in a new grid cycle is opened only on a new candle of the selected signal timeframe. After the first position is opened, additional grid orders may be added when price moves against the current basket by a required distance.
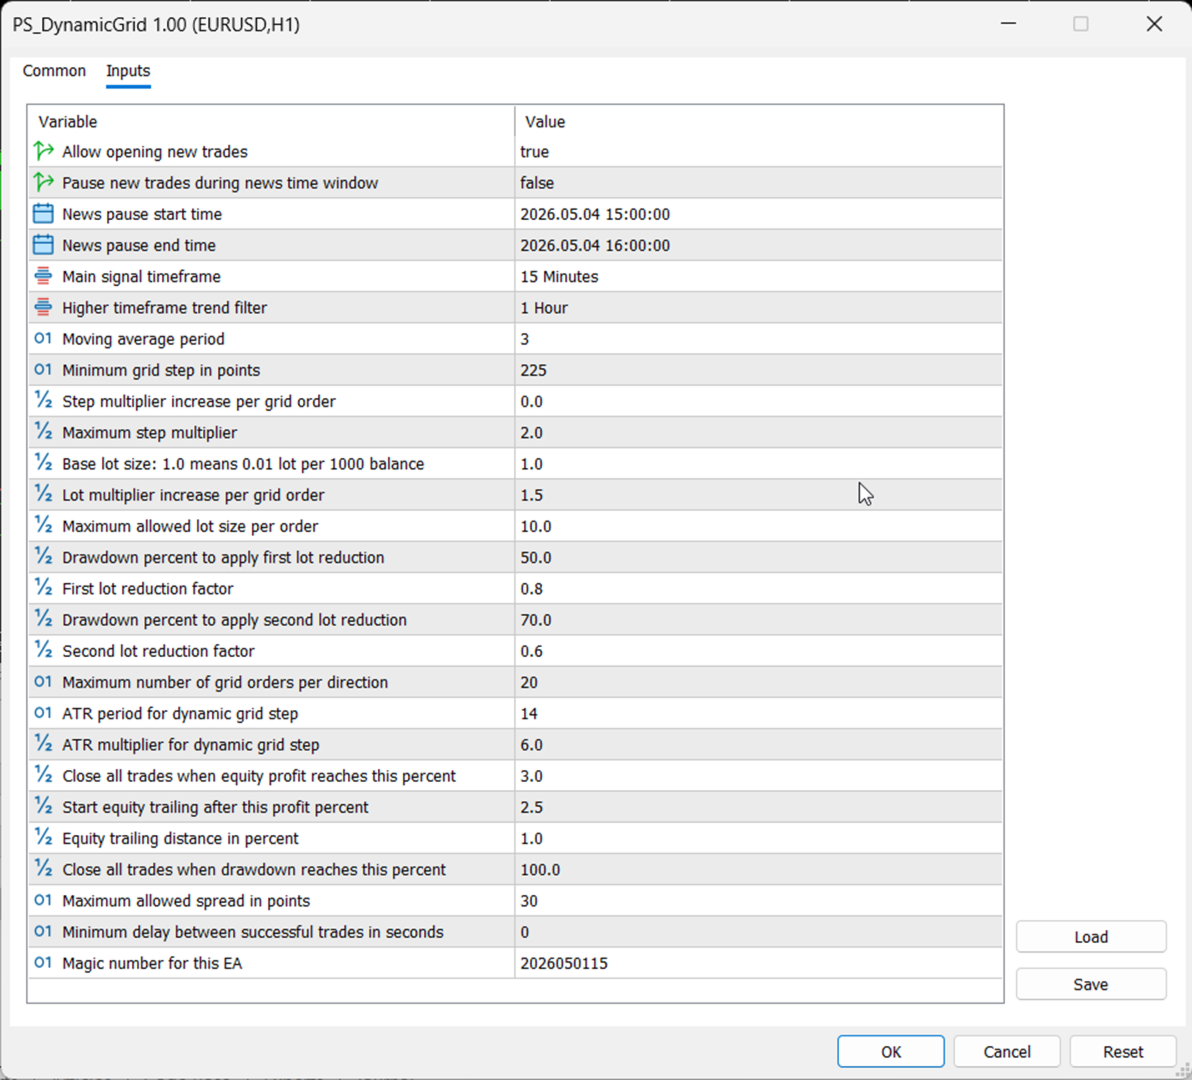
Grid spacing is dynamic. The minimum grid step is defined in points, but the EA can also use ATR-based volatility spacing. The final grid distance is selected from the larger value between the adjusted minimum step and the ATR-based step. The minimum step can increase progressively as more grid orders are opened, helping to reduce order clustering during strong adverse price movement.
Lot size is calculated dynamically based on account balance and the selected risk setting. Each additional grid order can increase the lot size using a configurable lot multiplier step. The EA also supports drawdown-based lot reduction, allowing the lot multiplier to be reduced when account drawdown reaches predefined levels.
The EA manages risk using equity-based protection. It can close all EA positions when a target equity profit percentage is reached. It can also activate an equity trailing mechanism after a specified profit level, closing positions if equity falls back by the configured trailing distance. A maximum drawdown limit is also included to close all positions when drawdown reaches the defined threshold.
The EA includes several trade safety filters. It checks spread before trading, enforces a delay between successful trades, validates available margin before sending orders, and can check whether trading is allowed for the current symbol. It also supports pausing new order entries manually or during a configured news time window.
The strategy is designed to manage only positions opened by its own magic number and symbol.
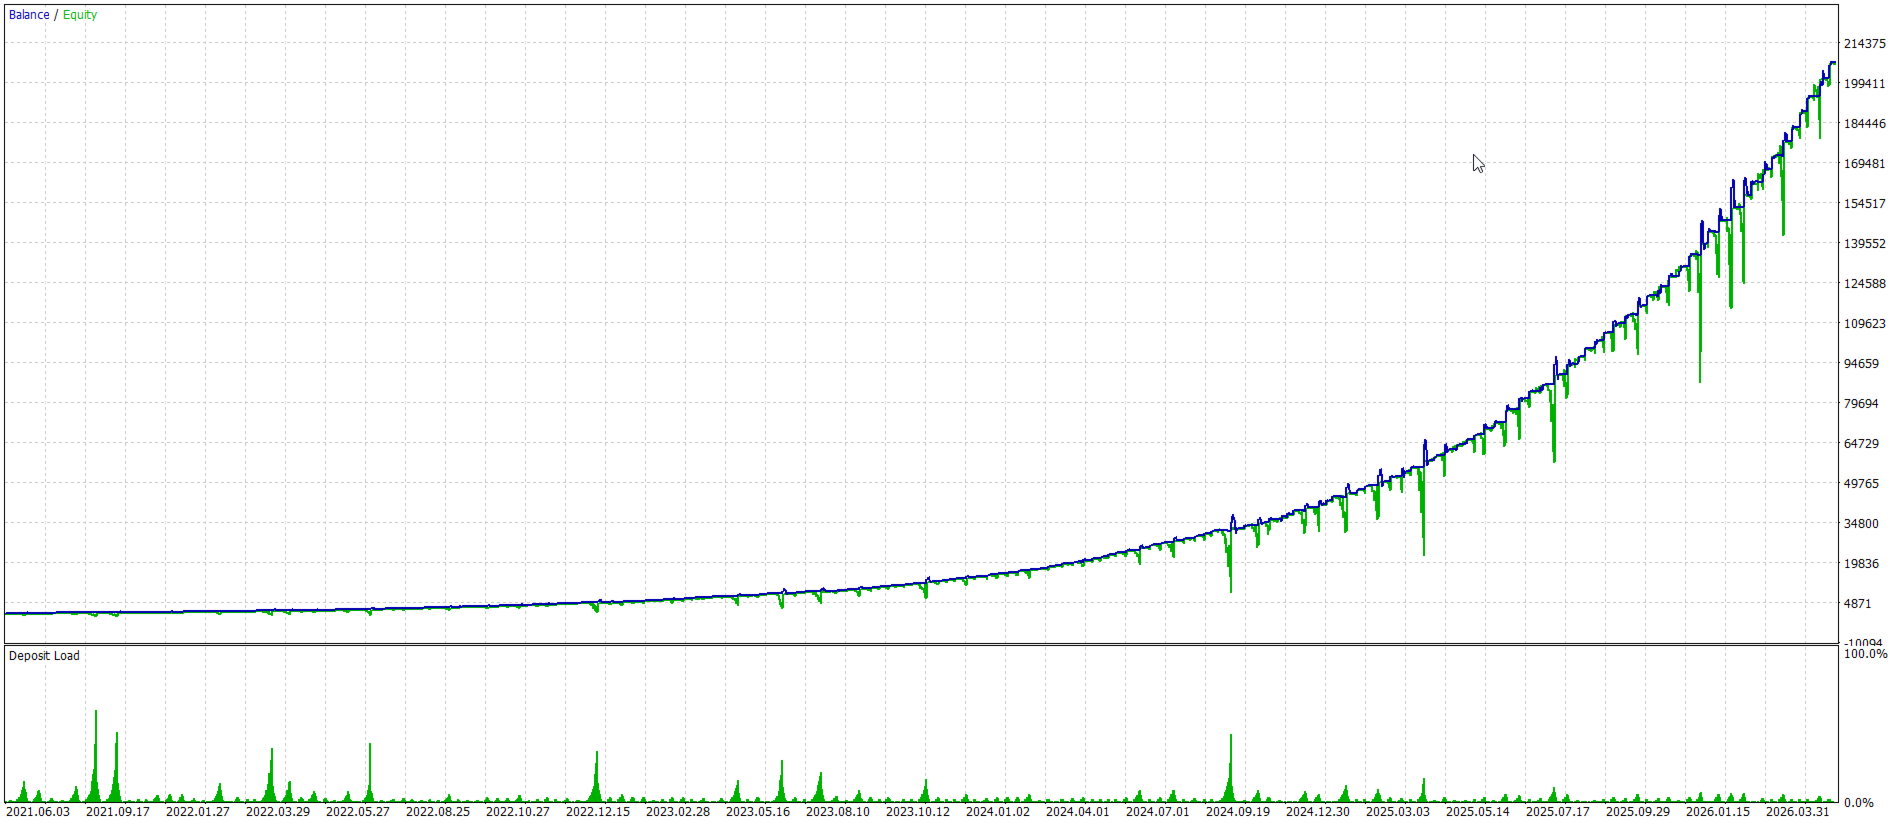
Overall, PS DynamicGrid combines trend filtering, adaptive grid spacing, progressive lot sizing, and equity protection to create a controlled dynamic grid trading system.
The EA analyzes market direction using moving averages on two separate timeframes: the main signal timeframe and a higher trend timeframe. Buy trades are allowed only when the current price is above both moving averages, while sell trades are allowed only when the current price is below both moving averages.
The first trade in a new grid cycle is opened only on a new candle of the selected signal timeframe. After the first position is opened, additional grid orders may be added when price moves against the current basket by a required distance.
Grid spacing is dynamic. The minimum grid step is defined in points, but the EA can also use ATR-based volatility spacing. The final grid distance is selected from the larger value between the adjusted minimum step and the ATR-based step. The minimum step can increase progressively as more grid orders are opened, helping to reduce order clustering during strong adverse price movement.
Lot size is calculated dynamically based on account balance and the selected risk setting. Each additional grid order can increase the lot size using a configurable lot multiplier step. The EA also supports drawdown-based lot reduction, allowing the lot multiplier to be reduced when account drawdown reaches predefined levels.
The EA manages risk using equity-based protection. It can close all EA positions when a target equity profit percentage is reached. It can also activate an equity trailing mechanism after a specified profit level, closing positions if equity falls back by the configured trailing distance. A maximum drawdown limit is also included to close all positions when drawdown reaches the defined threshold.
The EA includes several trade safety filters. It checks spread before trading, enforces a delay between successful trades, validates available margin before sending orders, and can check whether trading is allowed for the current symbol. It also supports pausing new order entries manually or during a configured news time window.
The strategy is designed to manage only positions opened by its own magic number and symbol.
Overall, PS DynamicGrid combines trend filtering, adaptive grid spacing, progressive lot sizing, and equity protection to create a controlled dynamic grid trading system.