KT Currency Strength and Correlation MT5
- インディケータ
- バージョン: 1.2
- アップデート済み: 19 2月 2020
- アクティベーション: 10

もしあなたがFX取引をしているなら、通貨の強さと通貨ペアの相関関係に関する詳細な情報を持つことは、取引パフォーマンスを飛躍的に向上させることができます。相関関係を活用すればリスクを半減でき、強さの分析を活用すれば利益を最大化することが可能です。
このインジケーターは、通貨の強さ分析と通貨ペアの相関関係を組み合わせたハイブリッドなアプローチにより、最適な通貨ペアを選択するサポートをします。
通貨の強さ分析の使い方
例えば、あなたの取引戦略でAUD/JPYの買いシグナルが出たとします。しかしKTの通貨強さ分析を使うと、JPYがAUDよりも強くなっていることがわかりました。この場合、その取引は損失に終わる可能性が高いです。このインジケーターがあれば、そのような損失を未然に防ぐことができます。
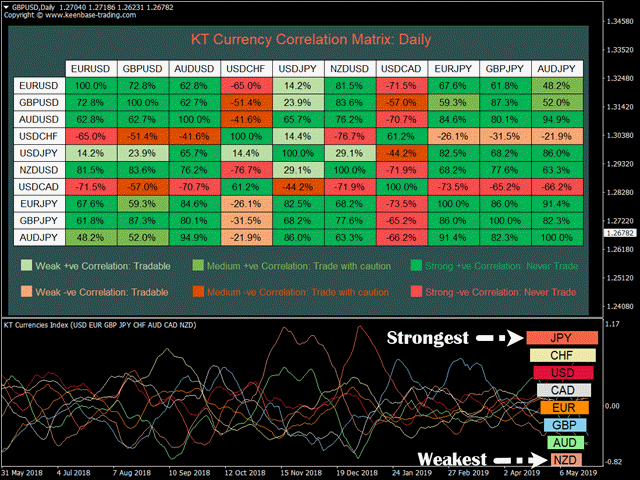
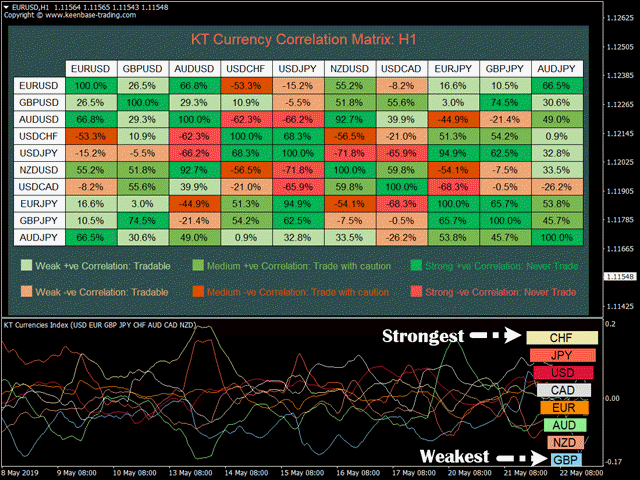
通貨ペア相関関係の使い方
これらのペアは強く相関しているため、同時に取引するとリスクが二重になります。もしNZD/USDで損失が出れば、GBP/JPYでも同様に損失が発生する可能性が高いです。
特徴
- 取引戦略によるシグナルを確認するために、最も強い通貨と最も弱い通貨をすばやく特定します。
- 強く相関している通貨ペアの取引を避けることで、リスクを半分または3分の1に減らせます。
- 通貨が最強または最弱になったときにアラートを受け取ります。
- 通貨ピラミッドを使って、強い通貨から弱い通貨まで順に並べたレポートを分析できます。
通貨強さ分析の詳細
- ベストな通貨ペアの選び方
例えば、GBP/JPYとEUR/JPYの両方で買いシグナルが出た場合、これらのペアは強い正の相関があるため、両方を取引するとリスクが2倍になります。
通貨ピラミッドを使うことで、GBPとEURのどちらが強いかを判断できます。もしGBPが強ければGBP/JPYを選び、EURが強ければEUR/JPYを選びます。
- 横ばい相場を避ける方法
例えば、AUD/JPYで買いシグナルが出たとします。しかし通貨ピラミッドでAUDとJPYが隣り合って配置されていることを確認します。
これは、両通貨が同時に強いまたは弱いことを示しており、結果として横ばい相場になりやすい状況を反映しています。
通貨ペア相関関係の詳細
一般的に、相関関係とは二つの取引資産間の関係を測定する統計的手法です。通貨相関は、特定の期間内に二つの通貨ペアがどの程度同じ方向、反対方向、またはランダムに動くかを示します。
- 相関+1は完全な正の相関を意味し、EUR/USDとGBP/USDのように常に同じ方向に動きます。
- 相関-1は完全な負の相関を意味し、EUR/USDとUSD/CHFのように常に逆方向に動きます。
- 相関0は、二つの通貨ペア間に関係性がないことを意味します。
- 正の相関の強さ
- 弱い正の相関(10%〜40%) = 取引可能
- 中程度の正の相関(40%〜60%) = 注意して取引
- 強い正の相関(60%〜100%) = 取引禁止
- 負の相関の強さ
- 弱い負の相関(-10%〜-40%) = 取引可能
- 中程度の負の相関(-40%〜-60%) = 注意して取引
- 強い負の相関(-60%〜-100%) = 取引禁止


This is a great tool. Welldone