KT Currency Strength and Correlation MT5

5

Eğer Forex piyasasında işlem yapıyorsanız, döviz gücü ve döviz çiftleri arasındaki korelasyon hakkında ayrıntılı bilgi sahibi olmak, işlem performansınızı yeni bir seviyeye taşıyabilir. Korelasyon, riskinizi yarıya indirmenize yardımcı olurken, güç analizi kârınızı maksimize etmenizi sağlar.

Bu gösterge, döviz gücü analizi ile döviz çiftleri korelasyonunu birleştirerek en uygun döviz çiftlerini seçmek için hibrit bir yaklaşım sunar.


Döviz Gücü Analizi Nasıl Kullanılır

Örneğin, işlem stratejiniz AUD/JPY üzerinde bir alım fırsatı sunduğunu gösteriyor. Ancak KT Döviz Gücü Analizini kullanarak JPY'nin AUD'den daha güçlü olduğunu fark ediyorsunuz. Bu durumda, işlemin zarar ile sonuçlanması muhtemeldir. Bu gösterge sayesinde böyle kayıpları kolayca önleyebilirsiniz.


Döviz Çiftleri Korelasyonu Nasıl Kullanılır

Örneğin, aynı anda NZD/USD ve GBP/JPY üzerinde satış fırsatı oluşuyor. KT Döviz Çiftleri Korelasyonu ile bu iki çift arasındaki korelasyon oranının %77 olduğunu keşfediyorsunuz. 

Bu çiftler yüksek korelasyona sahip olduğundan, aynı anda işlem yapmak riskinizi ikiye katlar. NZD/USD işleminde zarar ederseniz, GBP/JPY işleminizin de zarar etmesi yüksek ihtimaldir.


Özellikler

  • Stratejinizin ürettiği işlem fırsatlarını doğrulamak için en güçlü ve en zayıf dövizi hızlıca bulun.
  • Güçlü korelasyona sahip döviz çiftlerinde işlem yapmaktan kaçınarak riskinizi yarıya veya üçte bire kadar azaltın.
  • Bir döviz, sepet içerisindeki en güçlü veya en zayıf para haline geldiğinde bildirim alın.
  • Güçten zayıfa doğru sıralanmış dövizleri gösteren bir döviz piramidi kullanarak güç raporunu analiz edin.


Döviz Gücü Analizi Detayları

Döviz gücü analizi, matematiksel hesaplamalar kullanarak dövizlerin güçlü veya zayıf olduğunu belirlemeye yardımcı olur. Bu analiz, diğer döviz endekslerinin referansı olarak ABD Dolar Endeksi'ni kullanır.

Yöntemin temeli, Forex piyasasında başarılı işlem yapmak için en güçlü dövizi satın alıp en zayıf dövizi satmak gerektiği fikrine dayanır.

Bu araç sayesinde tüm Forex piyasasındaki döviz akışını tek bir grafikte izleyebilirsiniz.


- En İyi Döviz Çiftini Seçmek

Örneğin, GBP/JPY ve EUR/JPY üzerinde alım fırsatları oluştuğunu düşünelim. Bu iki çiftin güçlü bir pozitif korelasyona sahip olması nedeniyle, ikisini aynı anda işlem yapmak riskinizi ikiye katlayacaktır.

Döviz piramidini kullanarak GBP ve EUR'dan hangisinin daha güçlü olduğunu belirleyebilirsiniz. GBP daha güçlüyse GBP/JPY'yi, EUR daha güçlüyse EUR/JPY'yi seçmelisiniz.


- Yatay Piyasadan Kaçınmak

Örneğin, AUD/JPY üzerinde alım fırsatı doğdu. Ancak döviz piramidinde AUD ve JPY'nin yan yana yer aldığını fark ediyorsunuz.

Bu durum, her iki dövizin de aynı anda güçlü veya zayıf olduğu anlamına gelir ve genellikle yatay piyasa hareketine işaret eder.


Döviz Çiftleri Korelasyonu Detayları

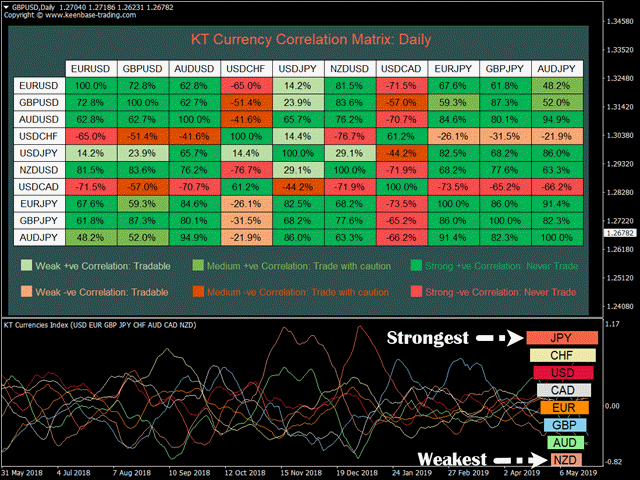
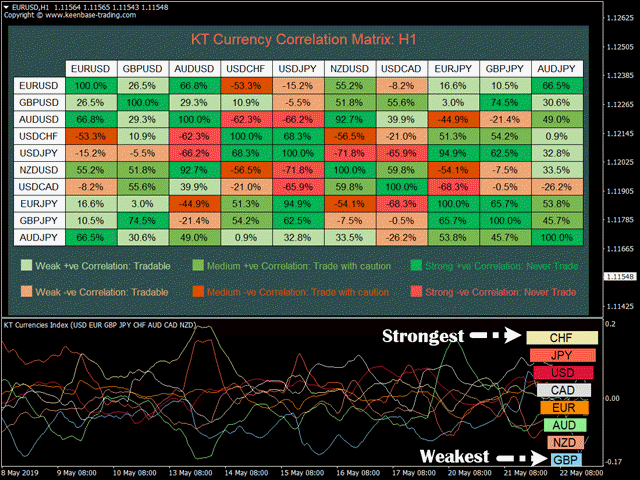
Genel olarak, korelasyon iki işlem varlığı arasındaki ilişkiyi ölçen istatistiksel bir yöntemdir. Döviz çiftleri korelasyonu, belirli bir dönemde iki döviz çiftinin aynı yönde, zıt yönde veya rastgele hareket etme derecesini gösterir.

  • +1 korelasyonu, mükemmel pozitif korelasyonu ifade eder: EUR/USD ve GBP/USD gibi çiftler her zaman aynı yönde hareket eder.
  • -1 korelasyonu, mükemmel negatif korelasyonu ifade eder: EUR/USD ve USD/CHF gibi çiftler her zaman zıt yönde hareket eder.
  • 0 korelasyonu, çiftler arasında rastgele bir ilişki olduğunu gösterir.

- Pozitif Korelasyon Gücü

  • Zayıf Pozitif Korelasyon (%10 - %40) = İşlem yapılabilir
  • Orta Pozitif Korelasyon (%40 - %60) = Dikkatli işlem
  • Güçlü Pozitif Korelasyon (%60 - %100) = İşlem yapılmamalı

- Negatif Korelasyon Gücü

  • Zayıf Negatif Korelasyon (-%10 - -%40) = İşlem yapılabilir
  • Orta Negatif Korelasyon (-%40 - -%60) = Dikkatli işlem
  • Güçlü Negatif Korelasyon (-%60 - -%100) = İşlem yapılmamalı

"Not: Bu araç, kendi başına bir ticaret stratejisi sunmaz. İşlemleri doğrulamak için yardımcı bir araç olarak çalışır."
Değerlendirmeler 1
Tshepang Makakeng
147
Tshepang Makakeng 2023.10.07 10:36 
 

This is a great tool. Welldone

Önerilen ürünler
Ignition
Dansie Software Limited
Strategy Overview The Ignition EA tries to take advantage of sudden momentum when the Ignition pattern is detected. The final bar in the ignition pattern has a small opening wick, a very little or no closing wick, is large in comparison to recent bars and must start from the lower end of the current range (for a bullish ignition) Quick Testing Use Symbol EURUSD, Timeframe M2, and remove the GBPUSD symbol from the "Symbols" input (stratergy 1 and stratergy 2) Settings The below settings appe
Volume Profile V6
Andrey Kolesnik
4.67 (3)
Piyasa Hacim Profili Göstergesi + Akıllı Osilatör. Döviz çiftleri, hisse senetleri, vadeli işlemler, kripto paralar gibi hemen hemen tüm enstrümanlarda hem gerçek hacimler hem de tick hacimleri üzerinde çalışır. Profil oluşturma aralığını otomatik olarak (örneğin bir haftalık veya bir aylık vb.) belirleyebileceğiniz gibi, sınırları (kırmızı ve mavi iki dikey çizgi) hareket ettirerek aralığı manuel olarak da ayarlayabilirsiniz. Histogram şeklinde görüntülenir. Belirli bir seviyedeki histogram gen
Was: $249  Now: $99   Market Profile defines a number of day types that can help the trader to determine market behaviour. A key feature is the Value Area, representing the range of price action where 70% of trading took place. Understanding the Value Area can give traders valuable insight into market direction and establish the higher odds trade. It is an excellent addition to any system you may be using. Inspired by Jim Dalton’s book “Mind Over Markets”, this indicator is designed to suit the
L'indicatore SMC Venom Model BPR è uno strumento professionale per i trader che operano nell'ambito del concetto di Smart Money (SMC). Identifica automaticamente due modelli chiave sul grafico dei prezzi: FVG   (Fair Value Gap) è una combinazione di tre candele, in cui c'è un gap tra la prima e la terza candela. Forma una zona tra livelli in cui non c'è supporto di volume, il che spesso porta a una correzione dei prezzi. BPR   (Balanced Price Range) è una combinazione di due modelli FVG che for
Before installing the HeatMap indicator make sure you are using a broker that gives you access to the Depth of market (DOM) !! This indicator creates a heatmap on your chart allowing you to see the buy or sell limit orders easily and in real time. You have the possibility to change the setting and the colors of the HeatMap in order to adapt to all markets and all charts. Here is an example of a setting you can use with the NASDAQ100 on the AMPGlobal broker :  https://www.youtube.com/watch?v=x0Y
The "MR Volume Profile 5" indicator is a charting tool that displays trading volume at different price levels rather than time intervals. A key concept in volume profile is the point of control (POC)—the price level with the highest volume traded during the session or time range. While tools like VWAP or OBV provide volume trends, the "MR Volume Profile 5" indicator offers granular detail about where the most market activity occurs at specific price levels. This makes it a more precise tool for
Delta Profile Volume
Teresinha Moraes Correia
Technical Description of the Indicator – Delta Profile for MetaTrader 5 The Delta Profile is an indicator developed for MetaTrader 5 focused on detailed analysis of volume flow within a defined range of candles. It organizes and displays information about the imbalance of positive volumes (associated with upward movements) and negative volumes (associated with downward movements) at different price levels. The result is a clear view of the chart points where the highest concentration of trades o
VWAP Daily
Anton Polkovnikov
Weighted average price indicator or VWAP. The well-known standard VWAP with the beginning of the day is added with the function of selecting the periodization. It can be calculated both every day and on other periods. Also the indicator allows to exclude the volume from the calculation, which will allow using it on the cryptocurrencies and forex. There is an alert for a VWAP price crossing. There are 1 and 2 standard deviation. Settings: Volume: turning volume on and off in the calculation mecha
MT4 Sürümü: https://www.mql5.com/en/market/product/157433 MT5 Sürümü: https://www.mql5.com/en/market/product/167286 Hacim Dengesizliği, yapılandırılabilir bir geri bakış aralığı içinde yüksek aktiviteli fiyat bölgelerini, yönsel baskıyı ve "boş" fiyat alanlarını belirlemenize yardımcı olmak için tasarlanmış hafif bir Hacim Profili + Delta Dengesizliği görselleştirme aracıdır. Sadece toplam hacmi gösteren klasik hacim profilinin aksine, bu gösterge her fiyat seviyesini şu şekilde ayırır: Boğa
This indicator allows you to enjoy the two most popular products for analyzing request volumes and market deals at a favorable price: Actual Depth of Market Chart Actual Tick Footprint Volume Chart This product combines the power of both indicators and is provided as a single file. The functionality of Actual COMBO Depth of Market AND Tick Volume Chart is fully identical to the original indicators. You will enjoy the power of these two products combined into the single super-indicator! Below is
Intraday Session TPO: Precision Volume Profiling for Day Traders Stop trading blind during the most volatile hours of the day. Standard daily volume profiles blend everything together, masking the true areas of liquidity and institutional interest. The Intraday Session TPO is engineered specifically for session-to-session traders. It empowers you to isolate and profile specific time windows—like the London Open, the New York Killzone, or the Asian range—so you can see exactly where the volume is
Basic Support and Resistance   Göstergimiz, teknik analizinizi artırmak için ihtiyacınız olan çözümdür.Bu gösterge, destek ve direnç seviyelerini grafikte yansıtmanıza olanak tanır/ MT4 sürümü Özellikler Fibonacci seviyelerinin entegrasyonu: Fibonacci seviyelerini destek ve direnç seviyelerinin yanı sıra görüntüleme seçeneğiyle, göstergemiz size piyasa davranışı ve olası tersine dönme alanları hakkında daha derin bir fikir verir. Performans Optimizasyonu: Genişletilmiş satırları yalnızca her ç
Overview Heiken Ashi CE Filtered MT5 is a technical indicator for the MetaTrader 5 platform. It integrates smoothed candlestick charting with a dynamic exit strategy and a customizable trend filter to deliver clear buy and sell signals. The indicator is designed to improve trend detection and signal reliability by reducing market noise. If you want to see more high-quality products or order the development/conversion of your own products, visit my partners' website: 4xDev Get 10% OFF on manual
"Blow It Up!" – The Trading Indicator That Questions Your Life Choices Tired of boring indicators? Meet your new market companion that delivers:   "YOLO BUY!" arrows   when you should probably panic   Explosive rectangle confetti   (because why not?)   200+ soul-crushing quotes   like   "Your stop loss is imaginary"   and   "This isn’t trading, it’s donating to whales"   Random alerts that roast your strategy This Indicator is like Therapy   – Because daytrading shouldn’t feel
Scalper Pivot
Yosi Malatta Madsu
Scalper Pivot detects respectable small reversal areas that can be used to mark repeatable opportunity windows. For M1 timeframe. Setup/inputs: First, set one pip on price, e.g. EURUSD to 0.0001, USDJPY to 0.01, or XAUUSD to 0.1. Or select AUTO for autodetect common symbols. Set minimum and maximum range on pips, if you want scalp between 10 to 20 pips then set it to 10 and 20 respectively. Set detection window to any candle count you want. Set it too low or too high would be less accurate.
*LIMITED FREE! DOWNLOAD NOW* CDS Fractal Divergence Oscillator (AIO): The Ultimate Multi-Oscillator Divergence Tool with 15 Oscillator Options The CDS Fractal Divergence Oscillator (AIO) is a robust and highly versatile indicator engineered to empower traders in identifying crucial trend reversals and momentum shifts through advanced divergence detection.  Its unparalleled strength lies in its unique ability to analyze divergence across 15 distinct built-in oscillator types and its groundbreak
TPO Profile MT5
Kyra Nickaline Watson-gordon
Definition : TPO is a Time Price Opportunity. Instead of using bars or candles with an Open, High, Low, and Close price, each "bar" in a Market Profile is represented by horizontal bars against the price It is called Market Profile terminology. In other words time-price-opportunity (TPO) profiles are histograms of how much time was spent at each price within the span of the profile. By using a TPO chart, you are able to analyze the amount of trading activity, based on time, for each price level
The indicator highlights the points that a professional trader sees in ordinary indicators. VisualVol visually displays different volatility indicators on a single scale and a common align. Highlights the excess of volume indicators in color. At the same time, Tick and Real Volume, Actual range, ATR, candle size and return (open-close difference) can be displayed. Thanks to VisualVol, you will see the market periods and the right time for different trading operations. This version is intended f
FREE
Key level wedge MT5
Presley Annais Tatenda Meck
The   Key level wedge MT5   indicator automatically draws rising wedge pattern and falling wedge pattern for you on the chart. This pattern is really good when used as a confirmation entry at key support & resistance, supply & demand and reversal zones. Advantages  The   Key level wedge MT5   block DOES NOT RE-PAINT, giving you confidence when a signal appears and also helps when looking back.  The   Key level wedge MT5   includes an on/off button on the chart to easily keep the charts clean
NeuroExt
Dmytryi Voitukhov
4 (11)
https://t.me/mql5_neuroExt   actual version Signal https://www.mql5.com/ru/signals/1511461 You can use any tool. The bases will be automatically created at the start of the Learn. If you need to start learning from 0 - just delete the base files. Initial deposit - from 200 ye. Options: DO NOT ATTEMPT TO TEST WITHOUT NEURAL NETWORK TRAINING! it is enough for the balance graph after training to be horizontal. generating a training base is extremely simple.  there is a ready-made training for U
FREE
WAPV Weis Wave Chart Forex
Eduardo Da Costa Custodio Santos
MT5 için Weis Wave Chart Forex bir Fiyat ve Hacim göstergesidir. Fiyat ve Hacim okuması, Richard Demille Wyckoff tarafından oluşturulan üç yasaya dayalı olarak geniş çapta dağıtıldı: Arz ve Talep, Neden ve Etki ve Çabaya Karşı Sonuç. 1900'de R.Wyckoff, analizlerinde dalga grafiğini zaten kullanmıştı. Yıllar sonra, 1990 civarında, David Weis Otomatikleştirilmiş R. Wyckoff'un dalga grafiği ve bugün size David Weis'in dalga grafiğinin evrimini sunuyoruz. Varlıkta üretilen dalga ile ilgili Hacim mik
Harmonic Pattern Structure Harmonic Pattern Structure is a professional MetaTrader 5 indicator that automatically detects classic harmonic patterns using strict Fibonacci ratio validation and XABCD price structure. Designed for traders who value precision, clean visuals, and structured analysis, the indicator highlights potential reversal zones based on price geometry, supporting consistent and objective decision-making. SUPPORTED HARMONIC PATTERNS Gartley (222) Butterfly Bat Crab Shark Cy
CVD SmoothFlow Pro
Thalles Nascimento De Carvalho
CVD SmoothFlow Pro - Her Varlık İçin Sınırsız Hacim Analizi! CVD SmoothFlow Pro , hassas ve sınırsız bir hacim analizi arayan trader'lar için nihai çözümüdür. Cumulative Volume Delta (CVD) hesaplamasını ve gelişmiş gürültü filtrelemesini kullanarak, Pro sürümü herhangi bir finansal varlık için gereken esneklik ve doğruluğu sağlar. CVD SmoothFlow Pro Neler Sunar? Açık Analiz : Pazar gürültüsünü filtreler ve her finansal varlıkta önemli hacim hareketlerini vurgular. ️ Kesin Hesaplama : Alım
Features 3 types of waves: bullish, bearish and unknown. The unknown tower comes when prices move in opposite the direction of the current tower. Label that shows the percentage remaining for the next tower. Allows you set the type of volume that will be accumulated in the towers, either real or tick volumes. Thus, the indicator works in any market, for example: stocks, futures, forex, commodities, etc. Allows you to set the required score for the tower exchange. Allows you to set the font size
Grafikteki işlem seanslarını vurgular Trading_Sessions_Indicator_Free ürününün ücretli bir sürümü, oturumların başlangıcını /sonunu özel olarak özelleştirebilme özelliğine sahiptir. İşlem Seansları Göstergesi, her işlem seansının başlangıç ve bitişlerini vurgular. [SEÇENEK:] Asian session Open Asian session Close Asian session OpenSummertime Asian session CloseSummertime European session Open European session Close European session Open European session Close Timeshift En iyi sonuçlar için
Gösterge, tarihsel olanlarla karşılaştırılabilecek güncel teklifler oluşturur ve bu temelde bir fiyat hareketi tahmini yapar. Gösterge, istenen tarihe hızlı navigasyon için bir metin alanına sahiptir. Seçenekler: Sembol - göstergenin göstereceği sembolün seçimi; SymbolPeriod - göstergenin veri alacağı dönemin seçimi; GöstergeRenk - gösterge rengi; Ters - doğru tırnakları tersine çevirir, yanlış - orijinal görünüm; Sonraki, tarihi girebileceğiniz ve 'enter' tuşuna basarak hemen atlayab
SPECIAL LAUNCH OFFER: $30 (1-Month Rent) Limited time offer to build our community and gather feedback! AmbM GOLD Institutional Scalper A high-precision M5 algorithm for XAUUSD (Gold) , engineered to trade exclusively at Institutional Liquidity Levels ($5/$10 psychological marks). PERFORMANCE DATA (BUY ONLY) • Win Rate: 87.09%. • Safe Growth: +$4,113 profit on $10k (13.75% Max Drawdown). • Extreme Stress Test: Successfully generated +$22,997 in a 5-year stress test (2020-2026), proving
GorMaster Pro
Manuel Damian Ortiz Fernandez
GorMaster_Pro — Sesgo confiable, noticias y técnica en una sola pantalla Visión GorMaster_Pro es una herramienta indispensable para cualquier tipo de trader (scalper, intradía o swing) porque combina información fundamental y técnica para darte una lectura fiel y accionable del mercado. En una sola vista verás: sesgo direccional BUY/SELL/RANGO , ventanas de noticias en tiempo real que congelan la operativa, métricas técnicas clave (ATR_Z, RangeRatio, ADX, SpreadZ), sesiones y alertas . Todo org
Mine Farm
Maryna Kauzova
Mine Farm is one of the most classic and time-tested scalping strategies based on the breakdown of strong price levels. Mine Farm is the author's modification of the system for determining entry and exit points into the market... Mine Farm - is the combination of great potential with reliability and safety. Why Mine Farm?! - each order has a short dynamic Stop Loss - the advisor does not use any risky methods (averaging, martingale, grid, locking, etc.) - the advisor tries to get the most
Your Trend Friend
Luigi Nunes Labigalini
5 (1)
The trend is your friend! Look at the color of the indicator and trade on that direction. It does not  repaint. After each candle is closed, that's the color of the trend. You can focus on shorter faster trends or major trends, just test what's most suitable for the symbol and timeframe you trade. Simply change the "Length" parameter and the indicator will automatically adapt. You can also change the color, thickness and style of the lines. Download and give it a try! There are big movements w
Bu ürünün alıcıları ayrıca şunları da satın alıyor
Azimuth Pro
Ottaviano De Cicco
5 (6)
Azimuth Pro V2: Synthetic Fractal Structure and Confirmed Entries for MT5 Overview Azimuth Pro is a multi-level swing structure indicator by Merkava Labs . Four nested swing layers, swing-anchored VWAP, ABC pattern detection, three-timeframe structural filtering, and closed-bar confirmed entries — one chart, one workflow from micro-swings to macro-cycles. This is not a blind signal product. It is a structure-first workflow for traders who care about location, context, and timing. V2 Launch Offe
Divergence Bomber
Ihor Otkydach
4.9 (86)
Bu göstergeyi satın alan herkese aşağıdaki ekstra içerikler ücretsiz olarak sunulmaktadır: Her işlemi otomatik olarak yöneten, Stop Loss ve Take Profit seviyelerini ayarlayan ve işlemleri strateji kurallarına göre kapatan özel yardımcı araç: "Bomber Utility" Göstergenin farklı varlıklar üzerinde kullanılmasına yönelik ayar dosyaları (set dosyaları) Bomber Utility için 3 farklı modda kullanım sunan ayar dosyaları: "Minimum Risk", "Dengeli Risk" ve "Bekle-Gör Stratejisi" Bu ticaret stratejisini hı
OmniSync Projection
Antonio-alin Teculescu
5 (1)
Chronos Fractal Engine is an innovative price projection indicator for MetaTrader 5, designed to transform your technical analysis by intelligently identifying and projecting historical price patterns. Built upon an advanced correlation algorithm and the fractal principles of the market, this powerful tool visualizes potential future price movements, giving you a unique edge in your trading decisions. What is Chronos Fractal Engine? At its core, the Chronos Fractal Engine employs a sophisticat
Bu indikatörü satın alırsanız, Profesyonel Trade Manager’ımı  + EA ÜCRETSİZ olarak alacaksınız. Öncelikle, bu Ticaret Sistemi'nin Non-Repainting, Non-Redrawing ve Non-Lagging Göstergesi olduğunu vurgulamak önemlidir, bu da hem manuel hem de robot ticareti için ideal hale getirir. Online kurs, kılavuz ve ön ayarları indir. "Smart Trend Trading System MT5", yeni ve deneyimli tüccarlar için özelleştirilmiş kapsamlı bir ticaret çözümüdür. 10'dan fazla premium göstergeyi birleştiriyor ve 7'den fazla
Quantum TrendPulse
Bogdan Ion Puscasu
5 (23)
SuperTrend   ,   RSI   ve   Stochastic'in   gücünü tek bir kapsamlı göstergede birleştirerek işlem potansiyelinizi en üst düzeye çıkaran nihai işlem aracı olan   Quantum TrendPulse'u   tanıtıyoruz. Hassasiyet ve verimlilik arayan yatırımcılar için tasarlanan bu gösterge, piyasa trendlerini, momentum değişimlerini ve en uygun giriş ve çıkış noktalarını güvenle belirlemenize yardımcı olur. Temel Özellikler: SuperTrend Entegrasyonu:   Güncel piyasa trendlerini kolayca takip edin ve karlılık dalgası
CGE Trading Suite
Carl Gustav Johan Ekstrom
5 (1)
Institutional-Grade Analytics for MT5 CGE Trading Suite delivers the analytical edge typically reserved for professional trading desks. The platform integrates a full suite of analytical tools into one seamless workflow: dynamic grid mapping, liquidity behavior analysis, ECM, trend lines, MIDAS, trade cycles, and directional channel projections. Together, these provide a unified view of market structure and momentum. Directional clarity is further enhanced by the capital flow index, which measu
Tanıtım       Quantum Breakout PRO   , Breakout Bölgeleri ile ticaret yapma şeklinizi değiştiren çığır açan MQL5 Göstergesi! 13 yılı aşkın ticaret tecrübesine sahip deneyimli tüccarlardan oluşan bir ekip tarafından geliştirilmiştir.       Kuantum Breakout PRO       yenilikçi ve dinamik koparma bölgesi stratejisiyle ticaret yolculuğunuzu yeni zirvelere taşımak için tasarlanmıştır. Kuantum Breakout Göstergesi, size 5 kar hedefi bölgesi ile kırılma bölgelerinde sinyal okları ve kırılma kutusuna da
Meridian Pro
Ottaviano De Cicco
5 (1)
Meridian Pro: Professional Multi-Timeframe Trend Matrix for MT5 Overview Meridian Pro is a multi-timeframe trend matrix by Merkava Labs that compresses directional state, strength, momentum condition and matrix agreement into one compact panel. One adaptive engine, applied consistently from M1 to W1. No per-symbol tuning. No indicator stacking. One structured readout across every asset and every timeframe. Launch Offer — Get Meridian Pro for USD 99 (introductory). Regular price: USD 149. 1. Why
Grabber System MT5
Ihor Otkydach
4.83 (23)
Size mükemmel bir teknik gösterge olan Grabber’ı tanıtıyorum. Bu araç, kullanıma hazır bir “her şey dahil” işlem stratejisi olarak çalışır. Tek bir yazılım kodu içinde güçlü piyasa teknik analiz araçları, işlem sinyalleri (oklar), uyarı işlevleri ve push bildirimleri entegre edilmiştir. Bu göstergeyi satın alan herkes aşağıdaki hediyeleri ücretsiz olarak alır: Açık emirleri otomatik yönetmek için Grabber Yardımcı Aracı Kurulum, yapılandırma ve nasıl işlem yapılacağını adım adım anlatan video kıl
Btmm state engine pro
Garry James Goodchild
5 (4)
BTMM State Engine Pro is a MetaTrader 5 indicator for traders who use the Beat The Market Maker approach: Asian session context, kill zone timing, level progression, peak formation detection, and a multi-pair scanner from a single chart. It combines cycle state logic with a built-in scanner dashboard so you do not need the same tool on many charts at once. What it does Draws the Asian session range; session times can follow broker server offset or be set in inputs. Tracks level progression (L
Atomic Analyst MT5
Issam Kassas
3.94 (31)
Öncelikle belirtmek gerekir ki bu Ticaret Göstergesi Yeniden Çizim Yapmaz, Gecikmez ve Gecikme Göstermez, bu da hem manuel hem de robot ticareti için ideal hale getirir. Kullanıcı kılavuzu: ayarlar, girişler ve strateji. Atom Analisti, Piyasada Daha İyi Bir Avantaj Bulmak İçin Fiyatın Gücünü ve Momentumunu Kullanan PA Fiyat Hareketi Göstergesidir. Gürültüleri ve Yanlış Sinyalleri Kaldırmaya ve Ticaret Potansiyelini Artırmaya Yardımcı Olan Gelişmiş Filtrelerle Donatılmıştır. Birden fazla katmanl
RelicusRoad Pro: Kantitatif Piyasa İşletim Sistemi ÖMÜR BOYU ERİŞİMDE %70 İNDİRİM (SINIRLI SÜRE) - 2.000+ TRADER'A KATILIN Neden çoğu trader "mükemmel" indikatörlere rağmen başarısız olur? Çünkü tekil kavramları boşlukta trade ederler. Bağlamı olmayan bir sinyal kumardır. Sürekli kazanmak için KONFLÜANS (UYUM) gerekir. RelicusRoad Pro basit bir ok indikatörü değildir. Tam bir Kantitatif Piyasa Ekosistemi dir. Tescilli volatilite modellemesini kullanarak fiyatın ilerlediği "Adil Değer Yolu"nu har
ARICoins
Temirlan Kdyrkhan
ARICoin is a powerful trading companion designed to generate high-probability entry signals with dynamic TP/SL/DP levels based on volatility. Built-in performance tracking shows win/loss stats, PP1/PP2 hits, and success rates all updated live. Key Features: Buy/Sell signals with adaptive volatility bands Real-time TP/SL/DP levels based on ATR Built-in MA Filter with optional ATR/StdDev volatility Performance stats panel (Success, Profit/Loss, PP1/PP2) Alerts via popup, sound, push, or email Cust
ARIPoint
Temirlan Kdyrkhan
ARIPoint is a powerful trading companion designed to generate high-probability entry signals with dynamic TP/SL/DP levels based on volatility. Built-in performance tracking shows win/loss stats, PP1/PP2 hits, and success rates all updated live. Key Features: Buy/Sell signals with adaptive volatility bands Real-time TP/SL/DP levels based on ATR Built-in MA Filter with optional ATR/StdDev volatility Performance stats panel (Success, Profit/Loss, PP1/PP2) Alerts via popup, sound, push, or email Cu
ICT PO3 (Power of 3) AMD Protocol Framework Indicator True Time & Structure Integration   |  Non-Repainting | Real-Time  | Multi-Asset  | MT4 Version Available Full Setup Guide & Strategy Playbook: https://www.mql5.com/en/blogs/post/768683 MT4 Version: https://www.mql5.com/en/market/product/171742 Indicator Overview The ICT PO3 AMD Protocol Framework is a complete structural overlay for MetaTrader 5 that maps the True Daily Cycle directly onto your lower-timeframe execution chart. It projects
Gartley Hunter Multi
Siarhei Vashchylka
5 (11)
Gartley Hunter Multi - An indicator for searching for harmonic patterns simultaneously on dozens of trading instruments and on all possible timeframes. Manual (Be sure to read before purchasing) | Version for MT4 Advantages 1. Patterns: Gartley, Butterfly, Shark, Crab. Bat, Alternate Bat, Deep Crab, Cypher 2. Simultaneous search for patterns on dozens of trading instruments and on all possible timeframes 3. Search for patterns of all possible sizes. From the smallest to the largest 4. All fou
Bill Williams Advanced
Siarhei Vashchylka
5 (11)
Bill Williams Advanced is designed for automatic chart analysis using Bill Williams' "Profitunity" system. The indicator analyzes four timeframes at once. Manual (Be sure to read before purchasing) Advantages 1. Analyzes the chart using Bill Williams' "Profitunity" system. Signals are displayed in a table in the corner of the screen and on the price chart. 2. Finds all known AO and AC signals, as well as zone signals. Equipped with a trend filter based on the Alligator. 3. Finds "Divergence Bar
TPA True Price Action indicator reveals the true price action of the market makers through 100% non-repainting signals strictly at the close of a candle! TPA shows entries and re-entries, every time the bulls are definitely stronger than the bears and vice versa. Not to confuse with red/green candles. The shift of power gets confirmed at the earliest stage and is ONE exit strategy of several. There are available now two free parts of the TPA User Guide for our customers. The first "The Basics"
Unlock key market insights with automated support and resistance lines Tired of plotting support and resistance lines? This is a multi-timeframe indicator that detects and plots supports and resistance lines in the chart with the same precision as a human eye would. As price levels are tested over time and its importance increases, the lines become thicker and darker, making price leves easy to glance and evaluate. [ Installation Guide | Update Guide | Troubleshooting | FAQ | All Products  | 
Çoğu altın göstergesi size hareketin nerede olduğunu gösterir. Aurum Apex, çoğunluk girmeden önce nereye gittiğini gösterir. Bu bir iddia değil. Bu, mimarinin kendisi. Aurum Apex Nedir? Aurum Apex, yalnızca tek bir enstrüman - Altın - etrafında inşa edilmiş, MetaTrader 5 için yeniden çizim yapmayan bir XAUUSD scalping göstergesidir . Fiyat genişlemesi tam hızına ulaşmadan önce, kırılım momentumunu başlangıç noktasında tespit etmek üzere tasarlanmıştır. Yeniden çizim yapmaz. Gecikme olmaz. Tahmin
Weltrade Spike Sentinel
Batsirayi L Marango
5 (1)
Introducing Indicator for PainX and GainX Indices Traders on Weltrade Get ready to experience the power of trading with our indicator, specifically designed for Weltrade   broker's PainX and GainX Indices.  Advanced Strategies for Unbeatable Insights Our indicator employs sophisticated strategies to analyze market trends, pinpointing optimal entry and exit points.  Optimized for Maximum Performance To ensure optimal results, our indicator is carefully calibrated for 5-minute timeframe charts on
Easy SMC Trading
Israr Hussain Shah
3 (2)
Otomatik Risk/Ödül ve Yapı Kırılması (BOS) Tarayıcılı Yapı Trendi Sürüm: 1.0 Genel Bakış Otomatik Risk/Ödül ile Yapı Trendi, Fiyat Hareketine ve Piyasa Yapısına dayanan yatırımcılar için tasarlanmış kapsamlı bir işlem sistemidir. Yüksek olasılıklı işlem kurulumları oluşturmak için düzeltilmiş bir trend filtresini, Swing Noktası tespiti ve Yapı Kırılması (BOS) sinyalleriyle birleştirir. Bu aracın öne çıkan özelliği Otomatik Risk Yönetimidir. Geçerli bir Yapı Kırılması tespit edildiğinde, göste
Automated Trendlines MT5
Georgios Kalomoiropoulos
Trend çizgileri, forex ticaretinde en önemli teknik analiz aracıdır. Ne yazık ki, çoğu tüccar onları doğru şekilde çizmez. Otomatik Trend Çizgileri göstergesi, piyasaların trend hareketini görselleştirmenize yardımcı olan ciddi tüccarlar için profesyonel bir araçtır. İki tür Trend Çizgisi, Boğa Trend Çizgisi ve Ayı Trend Çizgisi vardır. Yükseliş trendinde, Forex trend çizgisi, fiyat hareketinin en düşük salınım noktalarından geçer. En az iki "en düşük düşük"ü birleştirmek, bir trend çizgisi o
Smart Structure Concepts MT5
Cristhian Alexander Gaibor Cuasquer
Smart Structure Concepts MT5 is not just another SMC indicator. It is the most complete institutional trading system ever built for MetaTrader 5 — combining real-time structure detection, smart zone mapping, educational tooltips, and live push alerts into a single, battle-tested tool. Most SMC indicators on the Market draw lines and boxes and leave you guessing. This one explains every single signal directly on the chart. Hover over any object — a BOS, a CHoCH, an Order Block, a Fair Value Gap —
RFI levels PRO MT5
Roman Podpora
3.67 (3)
Bu gösterge, fiyat dönüş noktalarını ve fiyat geri dönüş bölgelerini doğru bir şekilde gösterir.       Başlıca oyuncular   . Yeni trendlerin nerede oluştuğunu görüyorsunuz ve her işlem üzerinde kontrolü elinizde tutarak, azami hassasiyetle kararlar alıyorsunuz. TREND LINES PRO   göstergesiyle birlikte kullanıldığında maksimum potansiyelini ortaya koyar.  VERSION MT4 Göstergenin gösterdiği şey: Yeni bir trendin başlangıcında aktivasyonla birlikte tersine dönüş yapıları ve tersine dönüş seviyeler
AriX
Temirlan Kdyrkhan
1 (4)
AriX Indicator for MT5 A powerful trend-following and signal-evaluation tool AriX is a custom MT5 indicator that combines Moving Averages and ATR-based risk/reward logic to generate clear buy/sell signals. It visualizes dynamic SL/TP levels, evaluates past trade outcomes, and displays win/loss statistics in a clean on-chart panel. Key features include: Buy/Sell signals based on MA crossovers ATR-based SL/TP1/TP2/TP3 levels with visual lines and labels Signal outcome tracking with real-time stat
Advanced Supply Demand MT5
Bernhard Schweigert
4.53 (15)
Herhangi bir Acemi veya Uzman Tüccar için En İyi Çözüm! Bu gösterge benzersiz, yüksek kaliteli ve uygun fiyatlı bir ticaret aracıdır çünkü bir dizi tescilli özelliği ve yeni bir formülü bir araya getirdik. Bu güncelleme ile çift zaman dilimi dilimlerini gösterebileceksiniz. Yalnızca daha yüksek bir TF gösteremeyeceksiniz, aynı zamanda TF grafiğini ve ARTIK daha yüksek TF'yi de gösterebileceksiniz: YUVARLAK BÖLGELERİ GÖSTERMEK. Tüm Arz Talebi tüccarları buna bayılacak. :) Önemli Bilgiler Açıkland
Meravith MT5
Ivan Stefanov
5 (1)
Göstergе, herhangi bir noktadan hacmi analiz eder ve bu hacim için piyasanın tükeniş seviyelerini hesaplar. Meravith’in ana çizgileri: Boğa hacim tükeniş çizgisi – hedef olarak kullanılır. Ayı hacim tükeniş çizgisi – hedef olarak kullanılır. Trend çizgisi – piyasa trendini gösterir. Piyasanın boğa mı ayı mı olduğuna bağlı olarak rengi değişir ve trend desteği görevi görür. Nasıl kullanılır: Mor dikey çizgiye çift tıklayın ve istediğiniz konuma taşıyın. Her şeyi analiz edebilirsiniz – trendleri v
Blahtech Supply Demand MT5
Blahtech Limited
4.54 (13)
Was: $299  Now: $99  Supply Demand uses previous price action to identify potential imbalances between buyers and sellers. The key is to identify the better odds zones, not just the untouched ones. Blahtech Supply Demand indicator delivers functionality previously unavailable on any trading platform. This 4-in-1 indicator not only highlights the higher probability zones using a multi-criteria strength engine, but also combines it with multi-timeframe trend analysis, previously confirmed swings a
Öncelikle, bu Ticaret Aracının Non-Repainting, Non-Redrawing ve Non-Lagging Gösterge olduğunu vurgulamakta fayda var, bu da onu profesyonel ticaret için ideal hale getiriyor. Çevrimiçi kurs, kullanıcı kılavuzu ve demo. Akıllı Fiyat Hareketi Kavramları Göstergesi, hem yeni hem de deneyimli tüccarlar için çok güçlü bir araçtır. İleri ticaret fikirlerini, Inner Circle Trader Analizi ve Smart Money Concepts Ticaret Stratejileri gibi 20'den fazla kullanışlı göstergeyi bir araya getirerek bir araya
Yazarın diğer ürünleri
ACB Breakout Arrows MT5
KEENBASE SOFTWARE SOLUTIONS
3.5 (2)
ACB Breakout Arrows göstergesi, özel bir kırılma modelini tespit ederek piyasada önemli bir giriş sinyali sağlar. Göstergenin algoritması, fiyatın belirli bir yönde ivme kazandığı anları sürekli olarak tarar ve ana hareketten hemen önce doğru giriş sinyali verir. Çok sembollü ve çok zaman dilimli tarayıcıyı buradan alın - ACB Breakout Arrows MT5 için Tarayıcı Temel Özellikler Gösterge, Stop Loss ve Take Profit seviyelerini otomatik olarak belirler. Tüm zaman dilimlerinde kırılma sinyallerini i
KT Heiken Ashi Smoothed MT5
KEENBASE SOFTWARE SOLUTIONS
KT Heiken Ashi Smoothed, standart Heiken Ashi’nin yumuşatılmış sürümüdür; ayrıca trend değişiminde al/sat okları çizer. Durum ayıdan boğaya döndüğünde alım oku çizilir. Durum boğadan ayıya döndüğünde satım oku çizilir. Mobil bildirim, e-posta, ses ve pop-up uyarıları dahildir. Heiken Ashi Smoothed tam olarak nedir? Standart Heiken Ashi’deki yalancı sinyalleri ve gürültüyü iki hareketli ortalama ile filtreleyerek fiyatı yumuşatır. Bir miktar gecikme olsa da, salınım noktalarını ve yeni oluşan t
Use of support and resistance in systematic trading is very subjective. Every trader has their own idea and way to plotting the support and resistance levels on the chart. KT Support and Resistance indicator take out this ambiguity out of the situation and automatically draws support and resistance levels following an algorithmic approach using a unique multi-timeframe analysis. When launched on the chart, It immediately scan the most significant extreme points across all the available timefra
ACB Trade Filter MT5
KEENBASE SOFTWARE SOLUTIONS
ACB Trade Filter indicator provides a way to filtering out the low probability trading entries in a trading strategy. The indicator uses a sophisticated filtration algorithm based on the market sentiment and trend. The MT4 version of the same indicator is available here ACB Trade Filter MT4 Applications Works great with our indicator ACB Breakout Arrows MT5 Filter out low probability signals from any indicator. Avoid over-trading and minimize the losses. Trade in the direction of market sentime
KT Heiken Ashi Smoothed MT4
KEENBASE SOFTWARE SOLUTIONS
KT Heiken Ashi Smoothed, standart Heiken Ashi’nin yumuşatılmış sürümüdür; ayrıca trend değişiminde al/sat okları çizer. Durum ayıdan boğaya döndüğünde alım oku çizilir. Durum boğadan ayıya döndüğünde satım oku çizilir. Mobil bildirim, e-posta, ses ve pop-up uyarıları dahildir. Heiken Ashi Smoothed tam olarak nedir? Standart Heiken Ashi’deki yalancı sinyalleri ve gürültüyü iki hareketli ortalama ile filtreleyerek fiyatı yumuşatır. Bir miktar gecikme olsa da, salınım noktalarını ve yeni oluşan t
KT Psar Arrows
KEENBASE SOFTWARE SOLUTIONS
KT Psar Arrows, standart Parabolic SAR göstergesini kullanarak grafikte oklar çizer. Mumun en yüksek noktası SAR'a temas ettiğinde yükseliş oku çizilir. Mumun en düşük noktası SAR'a temas ettiğinde düşüş oku çizilir. Sinyaller, mum kapanışını beklemeden gerçek zamanlı olarak üretilir.  Özellikler Parabolic SAR göstergesini kullanan ticaret stratejilerini denemek isteyen yatırımcılar için faydalı bir araçtır.  Piyasadaki dönüş noktalarını bulmak için kullanılabilir. Özel PSAR girişlerini destekl
KT Round Numbers MT5
KEENBASE SOFTWARE SOLUTIONS
KT Round Numbers plots the round number levels which are also commonly known as psychological levels in the Forex world. In the context of Forex trading, round number levels are those levels in which there are two or more zeroes at the end. They are named as 00 levels on the chart. Some traders also consider the halfway points as a valid round number level. They are named as 50 levels on the chart. Use of round number levels in trading Round number levels work as strong support and resistance
KT Momentum Arrows MT5
KEENBASE SOFTWARE SOLUTIONS
5 (2)
KT Momentum Arrows göstergesi, belirli bir yönde meydana gelen bant sapması ve ortaya çıkan volatiliteye dayalı olarak hesaplanan ani kırılmalara dayanır. Fiyat üst banda kapanış yaparsa alış sinyali, alt banda kapanış yaparsa satış sinyali üretilir. Tek bir katsayı (Magnitude Coefficient), bant sapması ve volatilite hesaplamasını aynı anda etkiler. Bu değer, kullanılan enstrümana ve zaman dilimine göre dikkatlice seçilmelidir. Temel Özellikler Repaint yok! Momentum odaklı işlem yapanlar için
KT Asian Breakout
KEENBASE SOFTWARE SOLUTIONS
4 (1)
KT Asian Breakout carefully analyzes the range-bound market during the Asian session and then fires a long or short trade after doing some preassessment based on its inbuilt technical analysis module. The executed orders are closed within a day before the completion of the next day session. The inbuilt technical analysis module checks for the session range and compares it with the last 20 days price movement. If it finds any erratic price movement within the session, the orders are not executed
KT RSI Divergence Robot MT4
KEENBASE SOFTWARE SOLUTIONS
KT RSI Divergence robot, fiyat ile Relative Strength Index (RSI) osilatörü arasında oluşan normal ve gizli uyumsuzlukları (divergence) alıp satan %100 otomatik bir uzman danışmandır. Uyumsuzluk sinyalleri, ücretsiz olarak sunduğumuz RSI Divergence göstergesinden alınır. Her uyumsuzluk başarılı bir fiyat dönüşüyle sonuçlanmaz; bu nedenle EA, ham uyumsuzluk sinyallerini yerleşik teknik analiz modülüyle birleştirerek seçilen bazı sinyallerden sonra ortaya çıkan fiyat verimsizliğinden yararlanır.
KT CCI Divergence MT5
KEENBASE SOFTWARE SOLUTIONS
KT CCI Divergence shows the regular and hidden divergence created between the price and CCI oscillator. Divergence is one of the vital signals that depicts the upcoming price reversal in the market. Manually spotting the divergence between price and CCI can be a hectic and ambiguous task. Limitations of KT CCI Divergence   Using the CCI divergence as a standalone entry signal can be risky. Every divergence can't be interpreted as a strong reversal signal. For better results, try to combine it w
ACB Breakout Arrows
KEENBASE SOFTWARE SOLUTIONS
4.15 (34)
ACB Breakout Arrows göstergesi, özel bir kırılma modelini tespit ederek piyasada kritik bir giriş sinyali sağlar. Gösterge, belirli bir yönde güçlenen momentumu sürekli tarar ve büyük bir hareket başlamadan hemen önce doğru giriş sinyalini verir.  Çoklu sembol ve çoklu zaman dilimi tarayıcıyı buradan edinin - ACB Breakout Arrows MT4 için Tarayıcı Temel Özellikler Gösterge, Stop Loss ve Take Profit seviyelerini otomatik olarak sağlar. Tüm zaman dilimlerinde kırılma sinyallerini takip eden MTF Ta
ACB Trade Filter MT4
KEENBASE SOFTWARE SOLUTIONS
5 (1)
The ACB Trade Filter indicator provides a solution for filtering out the low probability trading setups in a trading strategy. The indicator uses a sophisticated filtration algorithm based on the market sentiment and trend. Applications Works great with our indicator " ACB Breakout Arrows ". Filter out low probability signals from any indicator. Avoid overtrading and minimize the losses. Trade in the direction of market sentiment and trend. Avoid the choppiness in the market. How to use Only L
KT Momentum Arrows
KEENBASE SOFTWARE SOLUTIONS
KT Momentum Arrows göstergesi, belirli bir yönde meydana gelen bant sapması ve ortaya çıkan volatiliteye dayalı olarak hesaplanan ani kırılmalara dayanır. Fiyat üst banda kapanış yaparsa alış sinyali, alt banda kapanış yaparsa satış sinyali üretilir. Tek bir katsayı (Magnitude Coefficient), bant sapması ve volatilite hesaplamasını aynı anda etkiler. Bu değer, kullanılan enstrümana ve zaman dilimine göre dikkatlice seçilmelidir. Temel Özellikler Repaint yok! Momentum odaklı işlem yapanlar için
KT COG Advanced MT4
KEENBASE SOFTWARE SOLUTIONS
1 (1)
KT COG is an advanced implementation of the center of gravity indicator presented by John F. Ehlers in the May 2002 edition of Technical Analysis of Stocks & Commodities magazine. It's a leading indicator which can be used to identify the potential reversal points with the minimum lag. The COG oscillator catches the price swings quite effectively. MT5 version of the same indicator is available here KT COG Advanced MT5 Calculation of COG The COG indicator is consist of the two lines. The main l
KT Pin Bar
KEENBASE SOFTWARE SOLUTIONS
KT Pin Bar identifies the pin bar formation which is a type of price action pattern which depicts a sign of reversal or rejection of the trend. When combined with support and resistance, BRN and other significant levels, Pin Bar pattern proved to be a very strong sign of reversal. Basically, a pin bar is characterized by a small body relative to the bar length which is closed either in upper or lower 50% part of its length. They have very large wicks and small candle body. A pin bar candlestic
KT Trend Magic
KEENBASE SOFTWARE SOLUTIONS
KT Trend Magic shows the trend depiction on chart using the combination of market momentum and volatility. A smoothing coefficient is used to smooth out the noise from the signal.It can be used to find out the new entries or confirm the trades produced by other EA/Indicators. Usage Drag n drop MTF scanner which scans for the new signals across multiple time-frames. Find new entries in the trend direction. Improve the accuracy of other indicators when used in conjunction. Can be used as a dynami
KT Auto Fibo
KEENBASE SOFTWARE SOLUTIONS
KT Auto Fibo, mevcut trend yönüne göre Fibonacci düzeltme seviyelerini otomatik olarak çizer. En yüksek ve en düşük noktalar, grafikteki mevcut maksimum ve minimum değerler kullanılarak otomatik olarak seçilir. Fibonacci seviyelerini buna göre ayarlamak için grafiği yakınlaştırabilir, uzaklaştırabilir ve kaydırabilirsiniz. Modlar Otomatik:  Grafik alanına göre Fibonacci seviyelerini otomatik olarak çizer. Manuel: Fibonacci seviyelerini yalnızca bir kez çizer. Daha sonra, bağlantı noktalarını ma
KT Ichimoku Trader
KEENBASE SOFTWARE SOLUTIONS
1 (1)
KT Ichimoku Trader is a fully automated expert advisor that offers five popular trading strategies based on the Ichimoku indicator. Each strategy has it's own entry and exit method without any interference to other strategies. The Ichimoku system can be applied to all major currency pairs and metals. However, we found that it performs reasonably well mainly on two pairs.   MT5 Version is available here  https://www.mql5.com/en/market/product/35043 Features Trade up to 5 famous trading strategi
KT Volatility Oscillator
KEENBASE SOFTWARE SOLUTIONS
KT Volatilite Osilatörü, geçmiş ve mevcut piyasa verilerini matematiksel bir formül kullanarak analiz eder ve sonucu bir osilatör formunda gösterir. Yükselen ve azalan dalgalar, varlığın yüksek ve düşük volatilitesine karşılık gelir.  Kısaca, volatilite bir varlığın belirli bir zaman diliminde fiyat dalgalanmalarının ölçüsüdür. Volatilite olmasaydı, piyasada çok az hareket olurdu ve traderlar fiyat değişimlerinden kazanç sağlayamazdı. Forex Piyasasında Volatilite Kullanımı Forex piyasasında vol
KT COG Robot
KEENBASE SOFTWARE SOLUTIONS
KT COG Robot is a fully automated Expert Advisor based on the KT COG Indicator . The COG indicator was originally presented by John F. Ehlers in the May 2002 edition of Technical Analysis of Stocks & Commodities magazine. The EA fires a long trade when COG line cross above the signal line and a short trade is fired when the COG line cross below the signal line.  Adaptive Filtration Our adaptive filtration algorithm combines the original COG formula with the major trend direction and market acce
ACB Breakout Arrows EA
KEENBASE SOFTWARE SOLUTIONS
Bu, özel olarak geliştirdiğimiz "ACB Breakout Arrows" adlı göstergemize dayalı %100 otomatik bir uzman danışmandır. Girişler, iki yönlü olarak sık sık oluşan bir kırılma modeline dayanır. Giriş sinyallerinin şiddeti, "Signal Sensitivity" adlı harici girişle ayarlanabilir. İşlem Onayı ACB Breakout Arrows EA, başka bir özel göstergemiz olan ACB Trade Filter kullanılarak girişleri filtreleme yeteneği sunar. Güçlü Al: Yukarı ok + Yeşil histogram + Yükseliş trendi Güçlü Sat: Aşağı ok + Kırmızı hist
KT London Breakout
KEENBASE SOFTWARE SOLUTIONS
First thirty minutes are essential for a trading session. The early reaction of traders and market players sets a path for the rest of the day. KT London Breakout EA takes advantage of this phenomenon, and after analyzing the first thirty minutes of London session, it places two bidirectional pending orders. One of pending order is eventually canceled after realizing the market direction with certainty. It has been strictly tested and developed for EUR/JPY using 30-Min Time Frame. You can expe
Use of support and resistance in systematic trading is very subjective. Every trader has their own idea and way to plotting the support and resistance levels on the chart. KT Support and Resistance indicator take out this ambiguity out of the situation and automatically draws support and resistance levels following an algorithmic approach using a unique multi-timeframe analysis. When launched on the chart, It immediately scan the most significant extreme points across all the available timefra
Eğer Forex piyasasında işlem yapıyorsanız, döviz gücü ve döviz çiftleri arasındaki korelasyon hakkında ayrıntılı bilgi sahibi olmak, işlem performansınızı yeni bir seviyeye taşıyabilir. Korelasyon, riskinizi yarıya indirmenize yardımcı olurken, güç analizi kârınızı maksimize etmenizi sağlar. Bu gösterge, döviz gücü analizi ile döviz çiftleri korelasyonunu birleştirerek en uygun döviz çiftlerini seçmek için hibrit bir yaklaşım sunar. Döviz Gücü Analizi Nasıl Kullanılır Örneğin, işlem stratejiniz
MACD Divergence Seeker
KEENBASE SOFTWARE SOLUTIONS
KT MACD Divergence Seeker trades the regular and hidden divergence signals generated by our free indicator named KT MACD Divergence indicator. Trading the standalone divergences can be a risky affair that's why the KT MACD Divergence Seeker combines the standard divergence signals with an advanced analysis module to exploit the price inefficiencies on some FX pairs. What is the Divergence exactly? As a general conception if the price is making higher highs, then macd should also be making hig
KT Asian Breakout Indicator
KEENBASE SOFTWARE SOLUTIONS
KT Asian Breakout göstergesi, Asya seansının kritik bir bölümünü analiz ederek fiyatın kırılma yönüne göre çift yönlü alım ve satım sinyalleri üretir. Fiyat seansın en yüksek seviyesini kırarsa alım sinyali oluşur, en düşük seviyesini kırarsa satış sinyali oluşur. Dikkat Edilmesi Gerekenler Eğer seans kutusu dikey olarak çok genişse, yeni bir işlemden kaçınılmalıdır çünkü fiyat hareketlerinin büyük bir kısmı zaten bu kutu içinde gerçekleşmiştir. Eğer kırılma mumu çok büyükse, fiyat genellikle s
MACD Divergence MT4
KEENBASE SOFTWARE SOLUTIONS
KT MACD Divergence, fiyat ile osilatör arasında oluşan düzenli ve gizli uyumsuzlukları gösterir. Eğer ticaret stratejinizde trend dönüşü bekleniyorsa, potansiyel dönüş noktalarını belirlemek için MACD’nin düzenli uyumsuzluğunu kullanabilirsiniz. Trendin devamına dayalı stratejilerde ise MACD’nin gizli uyumsuzluğu daha uygun bir tercih olacaktır. KT MACD Divergence'nın Sınırlamaları MACD uyumsuzluğunu tek başına giriş sinyali olarak kullanmak riskli olabilir. Her uyumsuzluk mutlaka bir trend dö
KT Bollinger Bands Trader MT4
KEENBASE SOFTWARE SOLUTIONS
KT Bollinger Bands Trader, düşük volatilite dönemlerinde Bollinger Bantlarını kullanarak ortalamaya dönüş stratejisi uygulayan %100 otomatik bir uzman danışmandır (Expert Advisor). Fiyat genellikle Bollinger Bantlarının üst veya alt çizgisine tepki verir, ancak her zaman bir dönüş gerçekleşmez. Bununla birlikte, düşük volatilite dönemlerinde fiyat dönüşü olasılığı daha yüksektir. Girişler Fiyat Bollinger Bantlarının alt çizgisinin altına doğru şekilde hizalandığında alış işlemi başlatılır. Fiya
KT CCI Divergence MT4
KEENBASE SOFTWARE SOLUTIONS
KT CCI Divergence shows the regular and hidden divergence created between the price and CCI oscillator. Divergence is one of the vital signals that depicts the upcoming price reversal in the market. Manually spotting the divergence between price and CCI can be a hectic and ambiguous task. Limitations of KT CCI Divergence   Using the CCI divergence as a standalone entry signal can be risky. Every divergence can't be interpreted as a strong reversal signal. For better results, try to combine it w
Filtrele:
Tshepang Makakeng
147
Tshepang Makakeng 2023.10.07 10:36 
 

This is a great tool. Welldone

Değerlendirmeye yanıt