Advanced Trend Finder
- インディケータ
- バージョン: 1.2
- アップデート済み: 2 4月 2019
- アクティベーション: 10

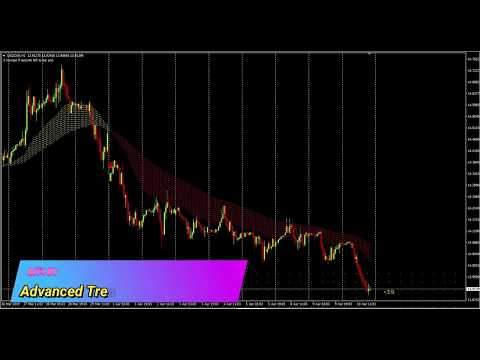
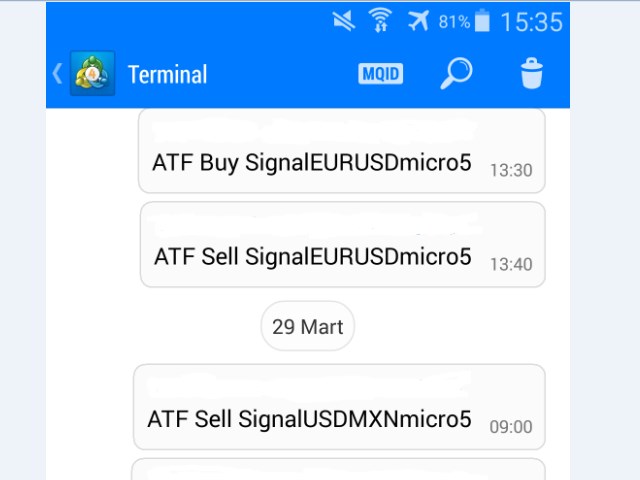
Advanced Trend Finder follow trend. Color change trend changed.
Works in EURUSD/GBPUSD/XAUUSD/USOIL/US500/USDJPY/USDCAD/JP225/USDTRY/USDMXN and all pairs
Best timeframes 5M/15M/1H/4H/DAILY
Signal on close of a bar.
DOES NOT repaint. DOES NOT repaint. DOES NOT repaint. DOES NOT repaint.
DOES NOT recalculate. DOES NOT recalculate. DOES NOT recalculate. DOES NOT recalculate
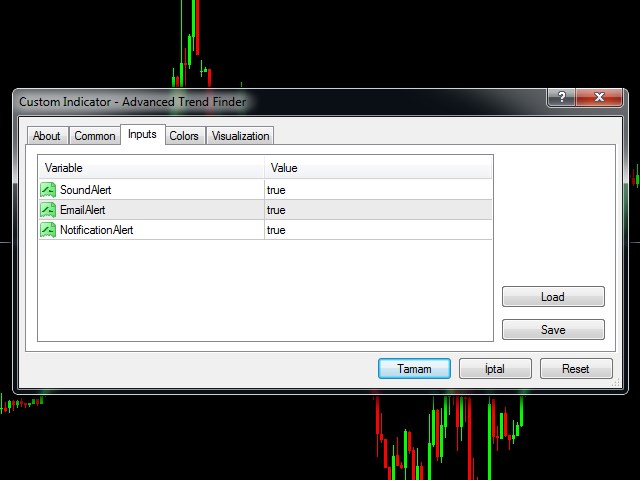
Settings
SoundOn : true/false
EmailOn : true/false
PushNotificationOn : true/false
ver 1.1 update notes:
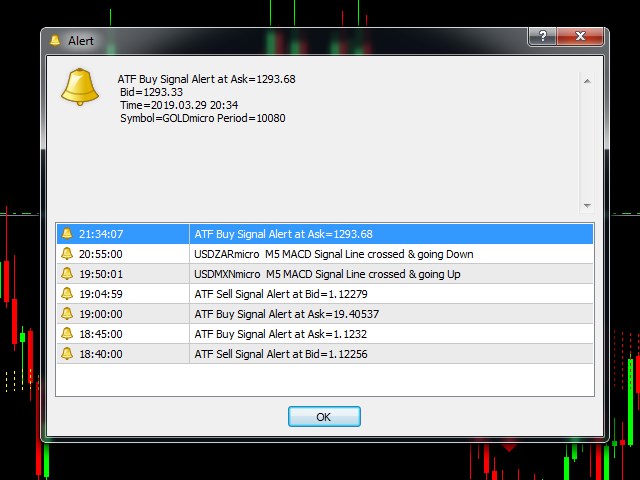
Added Alert Arrow
Added Alert Pop-up window
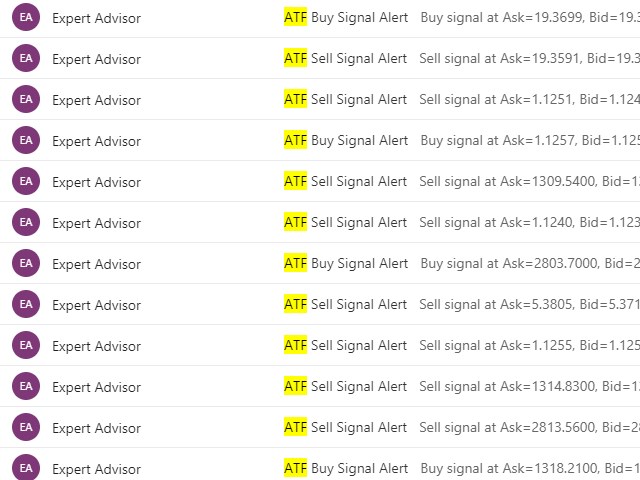
Added Alert Email
Added Alert Phone Push Notification
ver 1.1 update notes:
Alert fixed