Activity Meter

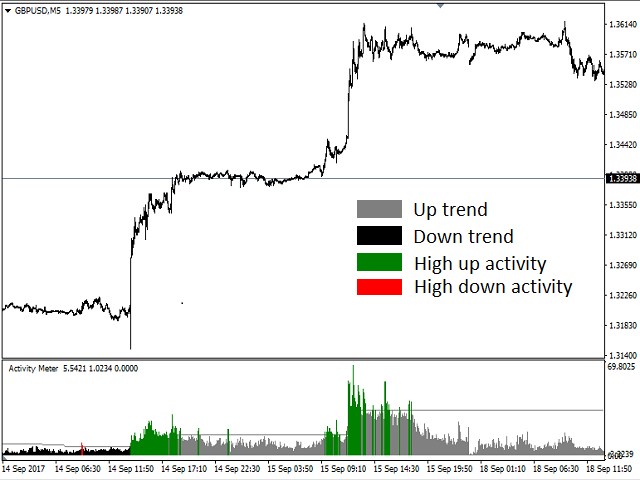
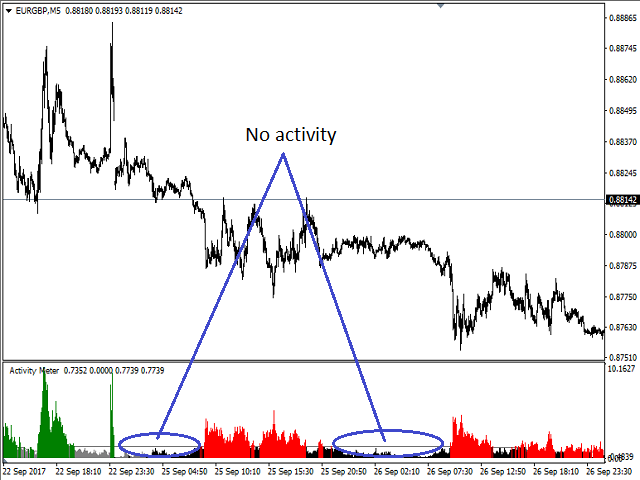
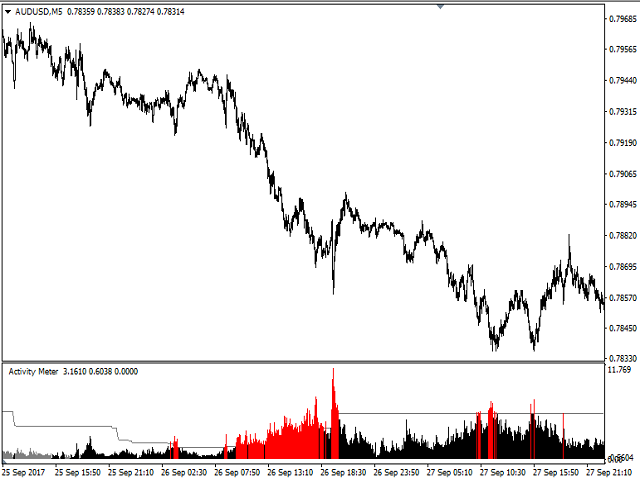
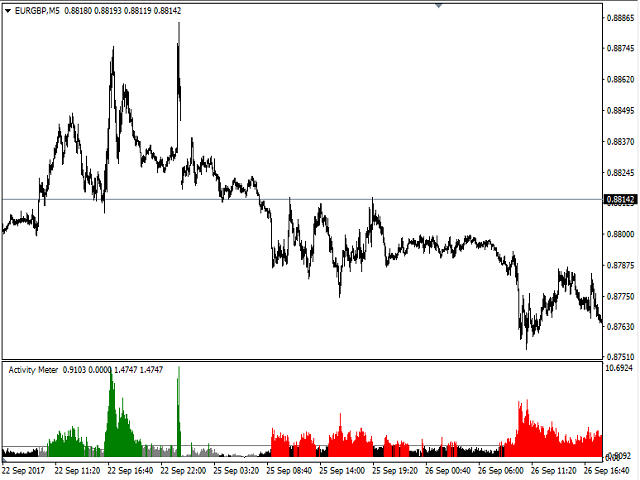
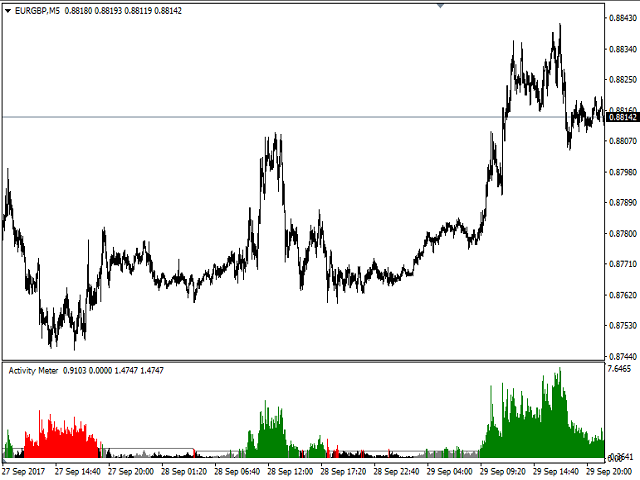
Activity Meter is designed to identify the activity of sellers or buyers, to detect the current trend, and to search for extrema, where the price may reverse and the current trend may be replaced by the opposite one.

The indicator works with any symbol provided that you have sufficient history data for a timeframe the indicator is launched at. It is recommended to launch Activity Meter on M1, М5, М15.


Alerts

Alerts are activated when the indicator histogram crosses the dynamic level upwards for the first time, on the current or first bar depending on the settings.


The indicator parameters

  • Main Settings:
    • AMPeriod - indicator calculation period.
    • CalcMode - calculation method 0 to 19.
    • DynamicLevelPeriod - dynamic level calculation period.
    • ShiftDynamicLevel - shift of the dynamic level, if 100 - no shift.
    • HistoryBars - number of bars for display.
  • Alert Settings:
    • Alerts - if true, alert is enabled.
    • AOnCurrent - if 'false', alert is activated at a new bar opening, if 'true', alert is activated on the current one.
    • AMessage - display a dialog window.
    • ASound - generate a sound alert.
    • AEmail - send an email at the address specified in the Email tab of the options window.
    • ANotificaton - send notification to mobile terminals.
    • soundfile - the name of the audio file.
おすすめのプロダクト
Implement
Vitalii Zakharuk
5 (1)
Implement analyzes market dynamics for pivot points. If you want to learn how to spot the correct reversals for consistently likely profitable trading, buy this indicator. Shows favorable moments of entering the market in stripes. Ready-made trading system. The principle of operation of the indicator is to automatically determine the current state of the market when placed on a chart, analyze historical data based on historical data and display instructions for further actions on the trader's
VWAP Indicator MT4
Kyra Nickaline Watson-gordon
5 (2)
Description : VWAP (Volume-Weighted Average Price) is the ratio of the value traded to total volume traded over a particular time horizon. It is a measure of the average price at which pair is traded over the trading horizon. Read More. All Symbols and All Timeframes are supported. Indicator Inputs :     VWAP Mode : Mode of VWAP Calculation. Options can be selected : Single,Session,Daily,Weekly,Monthly     Volumes : Real Volumes,Tick Volumes     Price Type : Used price for calculating.
RSI with Bands
Amirhossein Ghasemi Moroodi
7年の歳月を経て、私のインジケーターとエキスパートアドバイザー(EA)を無料で公開することにしました。 役立つと感じたら、 5つ星の評価でサポートしてください!あなたのフィードバックが私を動かし、無料ツールの提供を続けさせます。 私の他の無料ツールも こちら からご覧ください。 _________________________________ 「RSI with Bands」インジケーター - より良い取引判断 「RSI with Bands」インジケーターは、クラシックなRSIにシンプルなバンドを組み合わせ、売買のタイミングをより明確に示します。市場でのエントリーとエグジットの最適なタイミングを見極めるように設計されています。 主な利点: 精密な過買い・過売り分析 : バンドを加えることでRSIを強化し、市場の極端な状態を明確にし、誤ったシグナルの一般的な落とし穴を避けます。 明確なシグナル : 価格が高すぎるか低すぎるかを簡単に見極め、取引の判断ができます。 タイミングの改善 : 通常のRSIに追加情報を加えるバンドによって、取引の適切な瞬間
FREE
This is a volume profile where you can customize the time period you want. You can do this with a line or choose automatic functions such as showing the volume from the last time period. The indicator also shows the maximum volume value (VPOC - VOLUME POINT OF CONTROL) and the average value, colors and settings you can adjust as you like, there are many possibilities. If you need an indicator that shows the constant volume time frames there is  ...HERE... Volume Profile  is an advanced charting
Do you want to beat the market? This indicator uses advanced mathematical formulae That include regression analysis to predict market trends. So what happens is  That when the price is above the indicator line as depicted in the screenshot The trend is rising and when the price is below the indicator line the Trend is falling. This opportunities appear multiple times each day enabling You to profit. This indicator makes the trend your friend.
ComplexPulse - pulse indicator or signal. Sensitive and responsive to price movements. The indicator shows the interdependence of various currency pairs, namely: USD, EUR, GBP, CHF, JPY. Currencies are measured in relative units, so in each unit of time the sum of all currencies will be equal to zero. Hence, one of the main elements of cluster indicators is the zero line, or the balance line (zero line). If a currency is below the balance line, then it is said that the currency is oversold rela
Volume-weighted average price In finance, volume-weighted average price (VWAP) is the ratio of the value traded to total volume traded over a particular time horizon (usually one day). It is a measure of the average price at which a stock is traded over the trading horizon. VWAP is calculated using the following formula: *It is shown second screenshot in the screenshots. trade that takes place over the defined period of time, excluding cross trades and basket cross trades. for more information
Waddah Attar Statistical Predictor This indicator show you the Statistical Forecast for any symbol. it depends on a history data . the result show on a new day and still with no change until end of the day . with this indicator you can : know the main direction . know the range of the movement . know high and low in the current day . use indicator levels in any expert you made to auto trade . Preferably used with main symbols like EURUSD, GBPUSD, AUDUSD, NZDUSD, USDJPY, USDCHF, USDCAD, Gold, S
Trend New Trend Indicator, shows the signals for entry. Displays both entry points and the trend itself. Shows statistically calculated moments for entering the market with arrows. When using the indicator, it is possible to optimally distribute the risk factor. Settings: Uses all one parameter for settings. Selecting a parameter, it is necessary to visually resemble it so that the appropriate graph has a projection of extremes. Options: Length - the number of bars for calculating the indica
Market Profile with Dashboard Indicator - Complete User Guide indicator Overview The Market Profile with Dashboard is a comprehensive trading analysis tool for MetaTrader 4 that displays market profile data, volume analysis, and key market structure information directly on your chart. This indicator helps traders identify significant price levels, market balance areas, and potential trading opportunities based on market profile theory. Core Components and Features Market Profile Display - Sh
Klinger Volume Oscillator  Short Description A volume-based flow analysis tool designed to visualize buying and selling pressure through a dual-colored histogram. Detailed Description The Klinger Volume Oscillator Histo is a technical analysis indicator that explores the relationship between price movement and transactional volume. By converting the traditional Klinger Oscillator into a dynamic histogram, this tool allows traders to observe the internal strength of market movements. The indicato
Определения текущей тенденции одна из самых важных задач трейдера не зависимо от стиля торговли. Индикатор  Price Detect   Volume поможет с достаточно высокой вероятностью это сделать. Price Detect Volume  - индикатор распознавания тенденции, использующий авторский алгоритм расчета, использующий объемы. Показания индикатора не изменяются не при каких условиях. Также с помощью индикатора можно наблюдать за коррекцией цены в сторону глобального тренда, определять возможные границы окончания отката
Phantom Signal Pro – Professional Marketing Description Phantom Signal Pro   is an advanced trading indicator designed to generate high-precision entry signals directly on the chart by analyzing market momentum and trend strength to identify the best buy and sell opportunities in real time. The indicator is built to provide traders with a clearer view of price action by filtering out weak signals and focusing only on high-probability opportunities that occur within strong market movements, help
FREE
The difference between the arithmetic and geometric means at the specified range. Since the greater is the difference between the values, the greater the resulting figure is, actually the indicator shows volatility fluctuations. The arithmetic mean of a certain number of values ​​is the sum of the values ​​divided by their number. The geometric mean is the root of the power of the number of values ​​extracted from the product of these values. If all values ​​are equal, the arithmetic mean and th
This indicator is a high quality trading tool that tracks and displays the relative strengths of the 8 major currencies (EUR,GBP,USD,AUD,NZD,CHF,CAD,& JPY). The relative strength values are obtained using the slope of a moving average. All 28 major currency pairs are analyzed and the slopes of the moving averages are recorded. The base currency of each currency pair is credited with the slope of the MA, whether positive or negative, and the quoted currency is credited with the MA slope * -1. Thi
The "Market Profile" indicator displays the profiles and volumes of periods – weekly, daily, session (8-hour), 4-hour, hour, summary. The VAH/VAL price area is automatically highlighted by a dotted line for each profile (except for the summary). The indicator includes chroma Delta, which colors the profile areas. The areas of prevailing Buys is colored in green, that of Sells - in red. The intensity histogram features blue/red respectively. In the filter mode, the indicator displays the volume a
The Icarus Reversals(TM) Indicator is a powerful tool to identify high-probability reversal points, across all instruments.  The Reversals Indicator provides traders and investors with a simple-to-use and highly dynamic insight into points of likely price-action reversals.  Generated by a unique proprietary code-set, the Reversals Indicator generates long and short trade signals, which can be customised for all inputs, allowing for the complete optimisation fitted to any trader or investor style
A combination of trend, pullback, range breakouts and statistics in one indicator Mainly functions as an Entry indicator. Works in any pair and timeframe. Suggested Combination Cluster Helix with Strength Meter Strategy: Confirm signals with ideal strength levels Watch Video: (Click Here) Features Detects range breakouts on pullback zones in the direction of the trend Analyzes statistics of maximum profits and calculates possible targets for the next signal Flexible tool, can be used in many w
Track your daily profit and loss in real time. Displays current account performance, peak gain, and drawdown directly on the chart. Simple, lightweight, and compatible with all symbols. Daily Trade Monitor — Real-Time Daily P&L Tracker for MetaTrader 4 Monitor your trading performance with precision. Daily Trade Monitor is a lightweight, visual indicator that displays your current account profit or loss and captures the maximum profit and loss of the day, indicating the exact time and minute eac
Volume DeltaPanel is a very powerful indicator that read the supply on Market. It calculates the Delta from movement of the price and the difference of BUY volumes and SELL volumes. The Volumes are added to price and normalized to symbol points. Its special structure allows you to get all Time Frames values available on the platform MT4. Panel can show 28 instruments simultaneously all customizable according to the offer of the Broker. A good observation of this instrument can suggest great ent
Trend indicator with Multi-level Take Profit indication. Possibility to setting in normal or Aggressive mode. Fully customizable in color and alarm. Very useful to understand the trend and where price could go No need to explain, see the images. You'll se the trend, 3 possibly target and stop loss (or other take profit) when the trend change. You can adopt various strategy, for example. 1) Open trade and try to close it at target 1 2) Open 2 trade, close 1 at target 1, stop in profit for 2 and t
RFX Delta Volume
Rasoul Mojtahedzadeh
5 (1)
Note: This indicator cannot be tested in the strategy tester. Please download the free demo version from   https://www.mql5.com/en/market/product/48627 RFX Delta Volume is an indicator to show bullish and bearish volumes separately for each trading candle. The indicator uses history data of one minute (M1) to estimate the true bullish and bearish volumes in a sub-window. There are two modes of operations for this indicator. In mode "Delta Volume", the indicator shows the difference in bullish a
Trending or Ranging Dashboard See Every Timeframe's Market Condition at a Glance Stop guessing whether you should be trading breakouts or reversals. The Trending or Ranging Dashboard instantly shows you the market state across all major timeframes - from M1 to Monthly - in one compact, color-coded panel. What Makes This Different Most traders struggle because they use trending strategies in ranging markets, or range-bound strategies when the market is trending. This indicator solves that prob
Indicator is used for: defining price probability distributions. This allows for a detailed representation of the channel and its borders and forecast the probability of a price appearing at each segment of its fluctuations; defining the channel change moment.   Operation principles and features Indicator analyzes a quote history on lower timeframes and calculates a price probability distribution on higher ones. Forecast algorithms allow the indicator to calculate probability distributions and m
Версия на английском языке  https://www.mql5.com/ru/market/product/148576?source=Site +Profile+Seller Это руководство создано, чтобы помочь начинающим трейдерам понять, как работает и настраивается индикатор "Sunday Open", а также как правильно интерпретировать его сигналы для принятия взвешенных торговых решений. Часть 1: Что такое индикатор Sunday Open и как его использовать? Основная идея В основе индикатора лежит простая, но мощная концепция: цена открытия недели является ключевым уровнем по
This indicator incorporates built-in volume statistics, identifying true liquidity zones based on real-time trading volume and comparing it to the volume of the last 500 candlesticks. Based on the identified results, liquidity zones are plotted on the chart, indicating potential price swings. We typically identify key liquidity zones that have not yet been breached in larger timeframes, then look for suitable entry opportunities in smaller timeframes. When the price touches a key liquidity zone
This indicator shows the high volume zone. From the last minutes that you set yourself, the image of the volume zone is generated on an ongoing basis. The indicator also shows the V-Poc, Average Volumen and V-WAP lines. if you are using high intervals you must enter a large number of minutes. the zone builds itself up as the chart moves. if you want to build a zone from:  last day - 1440 minutes,    last week - 10080 minutes, ... etc. If you need an indicator that shows the constant volume zone
This indicator is designed for M1 time-frame and shows: Sum of ticks when the price goes up (color Green -The major component of a candlestick = the body). Sum of points when the price goes up (color Green -The extension lines at the top of the candle). Sum of points when the price goes down (color Red -The major component of a candlestick = the body). Sum of points when the price goes down (color Red -The extension lines at the lower end of the candle). Keep in mind that Sum of Points will be g
Wick & Liquidity Zones Tracker – Advanced Gold & Forex Cluster Indicator “See Where Big Players Move — Trade Gold & Forex Like an Insider!” Liquidity Zones instantly reveals hidden liquidity clusters, swing reversals, and breakout points, giving you the edge most traders only dream of. Key Features  Liquidity Zone Detection: Automatically identifies unbalanced bullish & bearish candles , marking zones where price is likely to reverse or accelerate. Cluster Analysis: Groups consecutive candles
Middle Volume
Stefan Stoyanov
3.5 (2)
The indicator measures volumes on different charts and instruments. Its main advantage is the ability to compare separate brokers. The less Middle Volume and Tick / Second , the more reliable is the broker. There is a comment in the upper left corner Comment data: Tick/Second — number of ticks per second for a selected instrument Middle Volume — average volumes in the penultimate bar This indicator allows tracking a relative market activity for different timeframes. If the volumes are lower than
FREE
このプロダクトを購入した人は以下も購入しています
Scalper Inside PRO – Since 2020. An exclusive indicator that utilizes an innovative algorithm to swiftly and accurately determine the market trend. The indicator automatically calculates opening, closing, and profit levels, providing detailed trading statistics. With these features, you can choose the most appropriate trading instrument for the current market conditions. Additionally, you can easily integrate your own arrow indicators into Scalper Inside Pro to quickly evaluate their statistics
Gann Made Easy は、ミスター・ギャンの理論を使用した取引の最良の原則に基づいた、プロフェッショナルで使いやすい外国為替取引システムです。 W・D・ガン。このインジケーターは、ストップロスとテイクプロフィットレベルを含む正確な買いと売りのシグナルを提供します。 PUSH通知を利用して外出先でも取引可能です。 ご購入後、取引方法の説明と優れた追加インジケーターを無料で入手するには、私にご連絡ください! おそらく、ギャンの取引手法についてはすでに何度も聞いたことがあるでしょう。通常、ギャンの理論は初心者のトレーダーだけでなく、すでにある程度の取引経験がある人にとっても非常に複雑なものです。なぜなら、ギャンの取引手法は理論的にはそれほど簡単に適用できるものではないからです。私はその知識を磨き、最良の原則を私の外国為替インジケーターに組み込むために数年を費やしました。 このインジケーターは非常に簡単に適用できます。必要なのは、それをチャートに添付し、簡単な取引推奨事項に従うだけです。このインジケーターは常に市場分析の仕事を行い、取引の機会を探します。適切なエントリーポイントを検出す
M1 SNIPER は使いやすいトレーディングインジケーターシステムです。M1時間足向けに設計された矢印インジケーターです。M1時間足でのスキャルピングのためのスタンドアロンシステムとして、また既存のトレーディングシステムの一部としても使用できます。このトレーディングシステムはM1時間足での取引に特化して設計されていますが、他の時間足でも使用できます。元々、この手法はXAUUSDとBTCUSDの取引用に設計しましたが、他の市場においても役立つと考えています。 インジケーターのシグナルは、トレンドの方向と逆方向に取引できます。インジケーターのシグナルを利用して両方向に取引するのに役立つ特別な取引テクニックをご紹介します。この手法は、特別な動的なサポートとレジスタンスの価格帯を利用することに基づいています。 ご購入後、M1 SNIPER矢印インジケーターをすぐにダウンロードできます。さらに、M1 SNIPERツールのすべてのユーザーに、以下のスクリーンショットに表示されているApollo Dynamic SRインジケーターを無料で提供しています。この2つのインジケーターを組み合わせることで
ゴールドラッシュ・トレンド・アロー・シグナル ゴールドラッシュ・トレンド・アロー・シグナル 指標は、XAU/USDにおける高速・短期スキャルパー向けに最適化された、正確でリアルタイムのトレンド分析を提供します。 1分足専用に設計されたこのツールは、明確なエントリーポイントを示す方向矢印を表示し、スキャルパーが変動の激しい市場状況でも自信を持って取引できるよう支援します。 この指標は、PRIMARY(主要)とSECONDARY(補助)のアラート矢印で構成されています。PRIMARYシグナルは、トレンドの方向転換を示す白と黒の方向矢印であり、SECONDARYシグナルは、PRIMARY矢印が示す方向を確認し、潜在的なエントリーポイントを示す青と赤の矢印です。 注意:トレンド方向の変化後にPRIMARYアラート矢印が1つだけ表示される場合、複数のSECONDARY青/赤矢印が表示される点に注意が必要です。SECONDARYシグナルは、シグナル基準を満たす任意のローソク足後に表示されます。したがって、長期的なトレンド移動の場合、画面に多くのSECONDARY矢印が表示されます(添付の
PRO Renko Systemは、特別にRENKOチャートを取引するために設計された高精度の取引システムです。 これは、様々な取引商品に適用することができる普遍的なシステムです。 システムは効果的に正確な逆転信号へのアクセスを与えるいわゆる市場の騒音を中和する。 表示器は非常に使いやすく、信号の生成に責任がある1つの変数だけがあります。 あなたは簡単にお好みの任意の取引ツールとレンコバーのサイズにツールを適応させることができます。 私はいつもあなたが私のソフトウェアで収益性の高い取引を支援するために余分なサポートを提供する準備ができています! 私はあなたに幸せで収益性の高い取引をしたいです! ご購入後にご連絡ください! 私はあなたに私のレンコチャートジェネレータを送信します。 私はまた、私の個人的な推奨事項やシステムの他のモジュールを無料で共有します!
After purchase, contact me privately to receive 1 month of free testing with EA Forex Proton! This advanced MT4 trading robot automatically executes signals from any MT4 indicator, including Market Makers. The latest version also includes AI integration, allowing each trade signal to be analyzed using Artificial Intelligence. Live Signal with EA Forex Proton: Click here Market Makers is a powerful price action trading system designed to identify high-probability Buy and Sell opportunities based
The indicator is built on a non-standard Zig Zag, it draws accumulations after which if the price leaves this zone and a test of this zone occurs, then a sound signal is given and an arrow appears - after the test candle closes.The indicator does not redraw its signals, it is very easy to use, there are only three settings 1- this is the zig zag parameter 2- this is the minimum price exit from the zone 3- this is the maximum price exit from the zone. The lower the parameter for Zig Zag, the more
Advanced Supply Demand
Bernhard Schweigert
4.91 (300)
現在40%オフ 初心者にもエキスパートトレーダーにも最適なソリューション このインジケーターは独自の機能と新しい公式を多数内蔵しており、ユニークで高品質かつ手頃な取引ツールです。このアップデートでは、2つの時間枠ゾーンを表示できるようになります。より長いTFだけでなく、チャートTFとより長いTF(ネストゾーンを表示)の両方を表示できます。すべてのSupply Demandトレーダーの皆さんのお気に召すはずです。:) 重要情報の公開 Advanced Supply Demandの可能性を最大化するには、 https://www.mql5.com/ja/blogs/post/720245 にアクセスしてください。   エントリーまたはターゲットの正確なトリガーポイントを正確に特定できれば取引がどのように改善されるか想像してみてください。新しい基盤となるアルゴリズムに基づいて構築されているため、買い手と売り手の間の潜在的な不均衡をさらに簡単に特定できます。これは、最も強い需要と供給のゾーンと、過去のパフォーマンス(古いゾーンを表示)がグラフィカルに表現されるためです。これらの機能は、最適な
チャートを構成し、周期的な価格変動を識別するテクニカル指標。 どのチャートでも動作します。 いくつかの種類の通知。 グラフ自体に追加の矢印があります。 履歴を再描画せずに、キャンドルのクローズに取り組みます。 M5以上のTFを推奨します。 パラメータの使用と設定が簡単です。 異なるパラメータを持つ 2 つのインジケーターを使用する場合、他のインジケーターなしで使用できます。 入力パラメータは2つあります 周期性と信号持続時間 これら 2 つのパラメータは、チャート構造の処理を扱います。 Cyclicity - 反転サイクルが変化する頻度を調整し、サイクルを滑らかにします。 Signal duration - 最小数では価格変動の衝動を検出し、最大数では長期的なトレンドの動きを検出します。
NAM Divergences
NAM TECH GROUP, CORP.
5 (1)
MT4マルチタイムフレームの発散と売られ過ぎ/売られ過ぎの検出インジケーター。 特徴 -チャートコントロールパネルで完全にカスタマイズ可能で、完全な相互作用を提供します。 -必要な場所でコントロールパネルを表示および非表示にします。 -資本化されていない発散に関するリアルタイムの情報。 -売られ過ぎ/売られ過ぎの状況に関するリアルタイム情報。 -定期的な発散に関するリアルタイムの情報。 -隠れた発散に関するリアルタイム情報。 -発散検出に使用できる発振器:AO、RSI、CCI、MACD、STOCH、RMI、TDI、RSIOMA。 -通知サービス(画面アラート|プッシュ通知)。 概要 発散取引を使用すると、弱体化傾向や勢いの逆転を見つけるのに役立ちます。トレンドが続くためのシグナルとして使用できる場合もあります。私たちのツールは、チャートを可能な限りクリーンに保つために、表示と非表示の可能性を備えた驚くほど快適で直感的なコントロールパネルで、すべての時間枠で同時に発散検出を提供します。 選択した履歴期間に、買われ過ぎと売られ過ぎの状況、通常の相違、隠れた相違
現在40%オフ! 初心者やエキスパートトレーダーに最適なソリューション! このインジケータは、独自の機能と秘密の数式を組み込んだ、ユニークで高品質かつ手頃な価格のトレーディングツールです。たった1枚のチャートで28の通貨ペアのアラートを表示します。新しいトレンドやスキャルピングチャンスの引き金となるポイントを正確に把握することができるので、あなたのトレードがどのように改善されるか想像してみてください! 新しい基本的なアルゴリズムに基づいて構築されているため、潜在的な取引の特定と確認がより簡単になります。これは、通貨の強さや弱さが加速しているかどうかをグラフィカルに表示し、その加速のスピードを測定するためです。加速すると物事は明らかに速く進みますが、これはFX市場でも同じです。つまり、反対方向に加速している通貨をペアにすれば、利益を生む可能性のある取引を特定することができるのです。 通貨の勢いを示す縦の線と矢印は、あなたの取引の指針となるでしょう。 ダイナミックマーケットフィボナッチ23レベルはアラートトリガーとして使用され、市場の動きに適応します。もしインパルスが黄色のトリガ
Auto Optimized Parabolic RSI: 高度な3Dモメンタムエンジン ほとんどのリテール向けインジケーターは、市場のボラティリティが変化した瞬間に破綻する静的な入力値に依存しているため、失敗に終わります。Auto Optimized Parabolic RSIは、自らの数学的優位性を継続的に再計算することで「インジケーターの陳腐化」問題を解決し、機関投資家レベルの定量的適応力をMT5ターミナルに直接もたらします。 最大の強み: カスタムインメモリ3D最適化   標準的な自動最適化ツールは、インジケーターの呼び出しで端末に過負荷をかけるため、頻繁にMT5プラットフォームをフリーズさせます。本ツールは、このボトルネックを完全に回避しています。RAMベースのカスタムネイティブ計算機を内蔵した内部エンジンは、チャートを読み込んだりタイムフレームを変更したりするたびに、超高速の3Dグリッド探索を実行します。RSI期間(頻度)、SARステップ(加速度)、SAR最大値(制限速度)を同時にスイープし、プラットフォームを遅延させることなく、数万通りものパラメーターの組み合わせを絶対的
現在40%オフ 初心者やエキスパートトレーダーに最適なソリューション! このインジケーターは、独自の機能と新しい計算式を取り入れた、ユニークで高品質、かつ手頃な価格のトレーディングツールです。たった1枚のチャートで28の為替ペアの通貨強度を読み取ることができます。新しいトレンドやスキャルピングチャンスの引き金となるポイントを正確に特定することができるので、あなたのトレードがどのように改善されるか想像してみてください。 ユーザーマニュアルはこちら  https://www.mql5.com/en/blogs/post/697384 これが最初の1本、オリジナルだ! 価値のないクローンを買わないでください。 特別な サブウィンドウの矢印で強い通貨の勢いを表示 GAPがあなたのトレードを導く! 基準通貨や気配値が売られすぎ・買われすぎのゾーン(外相フィボナッチレベル)にあるとき、個別チャートのメインウィンドウに警告表示。 通貨がレンジの外側から反落した場合、プルバック/リバーサルのアラート。 クロスパターンの特別なアラート 複数の時間枠を選択可能で、トレンドを素早く確認できます
このインジケーターは、反転ポイントと価格戻りゾーンを正確に表示します。     主要プレーヤー 。新たなトレンドが形成される場所を把握し、最大限の精度で意思決定を行い、すべての取引をコントロールします。 TREND LINES PRO インジケーターと組み合わせることで、その潜在能力を最大限に発揮します。 VERSION MT5 インジケーターが示す内容: 新しいトレンドの始まりに活性化する反転構造と反転レベル。 リスクと報酬の比率を最小限に抑えた利益 確定 と 損失停止の レベルの表示     RR 1:2   。 インテリジェントな削減ロジックによるストップロス。 指定されたインジケーターから 2 つのトレンド タイプの反転パターンを表示します。 指標: トレンドを追う   TREND LINES PRO   (世界的なトレンドの変化) TREND PRO   (クイックトレンド変更) シンプルで効果的   スキャナー   リアルタイムトレンド(新機能)。 マルチタイムフレームのインストゥルメント フィルタリング。 画面   利益     LOGIC AI信号の後。 当日プラス方
「 Dynamic Scalper System 」インジケーターは、トレンド波の中でスキャルピング取引を行う手法のために設計されています。 主要通貨ペアと金でテスト済みで、他の取引商品との互換性があります。 トレンドに沿った短期的なポジションオープンのシグナルを提供し、追加の価格変動サポートも提供します。 インジケーターの原理 大きな矢印はトレンドの方向を決定します。 トレンド波の中では、小さな矢印の形でスキャルピングシグナルを生成するアルゴリズムが機能します。 赤い矢印は強気方向、青い矢印は弱気方向です。 トレンドの方向には敏感な価格変動ラインが描かれ、小さな矢印のシグナルと連動します。 シグナルは次のように機能します。適切なタイミングでラインが現れるとエントリーシグナルが形成され、ラインが開いている間はポジションが保持され、完了すると取引が終了します。 推奨される動作時間枠はM1~H4です。 矢印は現在のローソク足に形成され、次のローソク足が開いている場合は、前のローソク足の矢印は再描画されません。 入力パラメータ Trend Wave Period - トレンド方向
Apollo SR Master は、サポート/レジスタンスゾーンを利用した取引をより容易かつ確実にする特別な機能を備えたサポート/レジスタンスインジケーターです。このインジケーターは、ローカル価格の高値と安値を検出することで、タイムラグなしでリアルタイムにサポート/レジスタンスゾーンを計算します。そして、新たに形成されたSRゾーンを確認するために、インジケーターは特別なシグナルを表示します。このシグナルは、SRゾーンを実際の売りまたは買いシグナルとして考慮して使用できることを示します。この場合、SRゾーンの強度が高まり、SRエリアからの取引が成功する確率も高まります。これがこのインジケーターの基本的な考え方です。 SRゾーンは、ストップロスとテイクプロフィットの設定を容易にします。シグナルの方向に応じて、SRゾーンの上または下のスペースをストップロスとして設定できます。さらに、反対側のSRゾーンは、潜在的なテイクプロフィットエリアとして設定できます。 また、Apollo SRマスターインジケーターをご利用のすべてのユーザーには、「Apollo Price Action System」
Scalping Lines System - は、M1-H1の時間枠で金(XAUUSD)を取引するために特別に設計されたスキャルピング取引システムです。 トレンド、ボラティリティ、買われ過ぎ/売られ過ぎの市場分析のための指標を1つのオシレーターに統合し、短期的なシグナルを識別します。 シグナルラインの主要な内部パラメータは事前​​に設定されています。 一部のパラメータは手動で調整可能です。「トレンド波の持続時間」(MAトレンドを使用してトレンド方向の一連のシグナルの持続時間を調整)と「シグナルラインにスムージングを適用」(シグナルラインの生成を調整)です。 始値でシグナルラインを計算する際、インジケーターは再描画されません。他の価格では、シグナル矢印がちらつく場合があります。 シグナルはローソク足が閉じた後に表示され、複数のアラートタイプが用意されています。 推奨される時間枠:M1-M5-M15-M30-H1。 このインジケーターは元々金の取引用に設計されましたが、スプレッドの低いボラティリティの高い資産(BTCや暗号通貨、銀、株価指数CFD(ナスダック100など))の取引にも適
地震計マーケット クエイク検出器。 Description in English : https://www.mql5.com/en/market/product/113869?source=Site+Market+Product+Page#description How to use the Seismograph : https://www.mql5.com/en/market/product/113869#!tab=comments&page=2&comment=52806941 Create an EA : https://www.mql5.com/en/market/product/113869#!tab=comments&page=3&comment=52816509 どのような取引方法であれ、流動性の低い市場への参入は避けたいものです。 地震計は、市場が上昇する前に市場に参入する適切なタイミングに役立ちます。 しかし、忙しいはずの市場時間帯にエントリーするようにしたにもかかわらず、流動性の低い市場に閉じ込められてしまう人が多いのが実情です。 数時間待った後、
Trend Screener
STE S.S.COMPANY
4.79 (95)
トレンドインジケーター、1つのツールに組み込まれたすべての重要なトレンド機能を備えたトレンドトレーディングとフィルタリングのための画期的なユニークなソリューション! これは、すべてのシンボル/商品(外国為替、商品、暗号通貨、インデックス、株式)で使用できる100%再描画されていないマルチタイムフレームおよびマルチ通貨インジケーターです。 期間限定オファー: サポートおよびレジスタンス スクリーナー インジケーターは、たった 65 ドルで永久的にご利用いただけます。(元の価格 250 ドル) (オファー延長) トレンドスクリーナーは、チャート内のドットで矢印トレンドシグナルを提供するインジケーターに続く効率的なインジケーターです。 トレンド分析インジケーターで使用できる機能: 1.トレンドスキャナー。 2.最大利益分析を備えたトレンドライン。 3.トレンド通貨強度メーター。 4.アラート付きのトレンド反転ドット。 5.アラート付きの強いトレンドドット。 6.トレンド矢印 毎日の分析例、毎日のシグナルパフォーマンス...など、トレンドスクリーナーインジケーターを使用して、ここで見つけること
まず第一に、この取引インジケーターは再描画されず、再描画されず、遅延しないことを強調する価値があります。これにより、手動取引とロボット取引の両方に理想的なものになります。 ユーザーマニュアル:設定、入力、戦略。 アトミックアナリストは、価格の強さとモメンタムを利用して市場でより良いエッジを見つけるためのPA価格アクションインジケーターです。ノイズや誤ったシグナルを除去し、取引ポテンシャルを高めるための高度なフィルターを備えています。複雑なインジケーターの複数のレイヤーを使用して、アトミックアナリストはチャートをスキャンし、複雑な数学的計算をシンプルなシグナルと色に変換します。これにより、どのような初心者トレーダーでも理解して使用し、一貫した取引の決定を行うことができます。 「アトミックアナリスト」は、新規および経験豊富なトレーダー向けにカスタマイズされた包括的な取引ソリューションです。プレミアムインジケーターとトップノッチの機能を1つの取引戦略に組み合わせ、すべてのタイプのトレーダーにとって汎用性のある選択肢にします。 デイリートレーディングとスキャルピング戦略:高速で正確な
現在40%OFF! このダッシュボードは、複数のシンボルと最大9つのタイムフレームで動作するソフトウェアの非常に強力な部分です。 このソフトは、弊社のメインインジケーター(ベストレビュー:Advanced Supply Demand)をベースにしています。    Advanced Supply Demand ダッシュボードは、素晴らしい概要を提供します。それは示しています。  ゾーン強度評価を含むフィルタリングされた需給値。 ゾーン内/ゾーンへのPips距離。 ネストされたゾーンがハイライトされます。 選択されたシンボルの4種類のアラートを全ての(9)時間枠で提供します。 それはあなたの個人的なニーズに合わせて高度に設定可能です。 あなたの利益! すべてのトレーダーにとって最も重要な質問です。 市場に参入するのに最適なレベルはどこか? 成功のチャンスとリスク/リターンを得るために、強力な供給/需要ゾーン内またはその近くで取引を開始します。 損切りの最適な位置はどこですか? 最も安全なのは、強力な供給/需要ゾーンの下/上にストップを置くことです。 最適な利益
Super Signal – Skyblade Edition プロ仕様のノンリペイント / ノーラグ・トレンドシグナルシステム。卓越した勝率を実現 | MT4 / MT5 対応 1分足、5分足、15分足などの低い時間足で最も効果を発揮します。 主な特徴: Super Signal – Skyblade Edition は、トレンド取引に特化したスマートなシグナルシステムです。マルチレイヤーのフィルターロジックを用いて、明確な方向性と実際のモメンタムに支えられた強力なトレンドのみを検出します。 このシステムは 天井や底を予測するものではありません 。次の3つの条件がすべて満たされた場合にのみシグナルを発生させます: 明確なトレンド方向 モメンタムの増加 健全なボラティリティ構造 市場セッションに基づく流動性分析と組み合わせることで、シグナルの精度とタイミングがさらに向上します。 シグナルの特性: すべての矢印シグナルは 100% 非リペイント / 遅延なし 一度出現したシグナルは固定され、点滅・消失しません チャート上の矢印、情報パネル、ポップアップ通知、音声アラート、プッシュ通知
Legacy of Gann
Pavel Zamoshnikov
4.83 (12)
The indicator very accurately determines the levels of the possible end of the trend and profit fixing. The method of determining levels is based on the ideas of W.D.Gann, using an algorithm developed by his follower Kirill Borovsky. Extremely high reliability of reaching levels (according to K. Borovsky  - 80-90%) Indispensable for any trading strategy – every trader needs to determine the exit point from the market! Precisely determines targets on any timeframes and any instruments (forex, met
CRYSTAL HEIKIN ASHI SIGNALS MT4 Professional Trend Detection Indicator with Smart Entry Signals See the Trend. Catch the Move. Trade with Confidence. The professional Heikin Ashi indicator built for traders who want clarity, precision, and EA-ready signal automation. WHAT IS CRYSTAL HEIKIN ASHI SIGNALS? Crystal Heikin Ashi Signals is a professional-grade MetaTrader 4 indicator that combines pure Heikin Ashi candle visualization with an advanced momentum-shift detection system. Designed for both
単純なドラッグアンドドロップEAでMetatrader4をPythonに接続するためのドキュメント。 完全にテストされた、高速で効率的な完全なエンドツーエンドソリューション! Pytraderエコシステムは、PythonスクリプトとMT4またはMT4EAで構成されています。 さらに、ライセンス供与にはインジケーターが使用されます。 PythonスクリプトとEAの間の通信は、ソケットに基づいています。 EAはサーバーであり、Pythonスクリプトはクライアントです。 それは常にquery(関数/ pythonスクリプト)とoutput(データ/サーバー)です。 EAは、Pythonスクリプトが実行されているのと同じコンピューターで実行する必要はありません。 Githubリンクには、Pythonスクリプト、EA、完全なドキュメント、および関数の呼び出し方法を示すPytraderサンプルスクリプトがあります。 質問については、不和チャンネルもあります。 デモ(ライセンスインジケーターなし)でも全機能がありますが、機器の数は限られています (EURUSD、AUDCHF、NZDCHF、GBP
NextCandlePredictor インジケーター NextCandlePredictorは、再描画しない、色が変わらない、動かない、消えない、遅延がないアラート付きのシグナルインジケーターです。あらゆるタイムフレームで次のキャンドルまたはその次のキャンドルの方向を識別するのに役立ちます。ニューヨーク、ロンドン、またはその両方の重なり合う高ボラティリティ市場に特にお勧めです。 主な特徴: タイムフレームの汎用性: M1からH1以上のあらゆるタイムフレームで迅速かつ正確なシグナルを提供します。 明確な買い/売りシグナル: ADXのDI+とDI-ラインを使用して明確な買いと売りのシグナルを生成し、最良のトレード判断を下せるようにします。 直感的な視覚化: シグナルはチャート上に緑色(買い)と赤色(売り)の矢印で直接表示され、迅速かつ簡単に読み取れます。 カスタマイズ可能な設定: 分析するバーの数とアラートオプションを好みとトレード戦略に応じて調整できます。使用するTFに応じた提案表を以下で確認してください。 即時およびオプションのキャンドル終了時アラート: デフォルトでは、ADX条件が
KURAMA GOLD SIGNAL PRO(MT4版)— 7層フィルター搭載 XAUUSD完全トレードシステム リペイントなし リドローなし ラグなし すべてのサインは確定後に変わりません。 購入者限定特典:買い切りライセンスをご購入いただいた方に、AI Zone Radar($59相当)を無料プレゼント+PDFマニュアルをお渡しします。購入後にMQL5でメッセージをお送りください。 AI Zone Radar: https://www.mql5.com/en/market/product/175834 あなたの問題 — そしてその解決策 ゴールドは1日$30〜$50動く。チャンスがあるのは分かっている。でもこういう経験はないか: — エントリーが早すぎて、$10逆行してから思った方向に動く — MAタッチのたびに入って、半分は負ける — TP/SLの基準がないから、持ちすぎるか早すぎる決済をする — 動かない時間帯にトレードして消耗する KURAMA GOLD SIGNAL PROは、これらすべてを解決するために作られた。1つのフィルターで
FullScalping は、あらゆる市場で 継続的なスキャルピングエントリー を生成するように特別に設計された 再描画なし、後方描画なし のインジケーターです。絶え間ないアクションを求める積極的なトレーダーに最適です! 独占情報とアップデートを入手するには、チャンネルに参加してください: https://www.mql5.com/en/channels/forexnewadvisor ほぼすべてのローソク足 でシグナルを出し、トレンドを確認するか、重要なリトレースメントをシグナルします。常にあなたを導くレーダーのようなものです。 どのように機能しますか?非常にシンプルです: 赤い矢印 売り 取引に入る。 青い矢印 買い 取引に入る。 常に一般的なトレンドの方向に取引し、 取引ごとに15〜20ピップ を積極的にターゲットにし、急激な市場の反転の前に素早く退出します。 シグナルは 継続的 なので、取引機会が尽きることはありません。目標は以下を使用して 集中的なスキャルピング を実行することです: 高ロット 低スプレッド(左下隅に表示) 最後のトレンド変化の近くに配置された
推測をやめて、統計的優位性を持って取引を始めましょう 株価指数はFXとは異なる動きをします。決まったセッションがあり、オーバーナイトでギャップが発生し、予測可能な統計パターンに従います。このインジケーターは、DAX、S&P 500、ダウ・ジョーンズなどの指数を自信を持って取引するために必要な確率データを提供します。 何が違うのか ほとんどのインジケーターは何が起こったかを示します。このインジケーターは次に何が起こる可能性が高いかを示します。毎取引日、インジケーターは100日間のヒストリカルデータに対して現在のセットアップを分析します。類似のギャップ、類似のオープニングポジションを持つ日を見つけ、価格が主要なレベルに到達した頻度を正確に計算します。ギャップが埋まるか、昨日の高値がテストされるかの推測はもう必要ありません。実際のデータに基づいた正確なパーセンテージが得られます。 すべての入力パラメータを説明した完全なマニュアルはこちら: https://www.mql5.com/en/blogs/post/766370 優れたセットアップを見つけるための戦略ガイドはこちら: https:/
Volatility Trend System - a trading system that gives signals for entries. The volatility system gives linear and point signals in the direction of the trend, as well as signals to exit it, without redrawing and delays. The trend indicator monitors the direction of the medium-term trend, shows the direction and its change. The signal indicator is based on changes in volatility and shows market entries. The indicator is equipped with several types of alerts. Can be applied to various trading ins
作者のその他のプロダクト
Zip Arrow is an original indicator with flexible customization capabilities. Every user will be able to customize it according to trading style and currency pair. The indicator does not change its values, it has a filter which allows showing the signal only in the direction of the main trend. Indicator Parameters TPeriod - trend filter setting. When the value increases, the signals will be displayed only in the direction of the main trend. It is recommended to set value above 100 for explicit f
Determining the current trend is one of the most important tasks of a trading regardless of the trading style. The Atom Trend indicator can help in doing that with a fairly high probability. Atom Trend is a trend recognition indicator, which uses an original calculation algorithm. You can use it on any currency pair and every time frame. It does not change its values. The tick volume can also be used in the calculations as an additional filter. Indicator Parameters Main Settings : VolMode - if
Determining the current trend is one of the most important tasks of a trading regardless of the trading style. The Quantum Trend Volume indicator can help in doing that with a fairly high probability. Quantum Trend Volume is a trend recognition indicator, which uses an original calculation algorithm. It does not change its readings under any circumstances. The tick volumes are used as an additional filter. You can use it on any currency pair and every time frame. It can also be used as an activi
Break Moment
Svyatoslav Kucher
5 (2)
Break Moment is a unique proprietary indicator with extensive capabilities and a variety of settings. It can be used as a signal generator or as an auxiliary tool. For the calculations, the price channel is determined. When it is broken, if all conditions of the additional filter are met, it displays a signal in the form of a histogram. Break Moment can be used to determine the main trend, as it has 2 filters for determining it in addition to everything else. If these filters are activated, the
Dynamic Levels is a channel indicator of dynamic levels, designed for identification of the price extremums. It allows increasing the efficiency of any strategy due to advanced parameters, which in turn allow customizing it for personal trading style. Dynamic Levels does not change its values, it is suitable for any timeframe and currency pair. Indicator Parameters ChannelPeriod - period for the indicator calculation. ChannelSmoot - smoothing of values. ATRPeriod - volatility calculation period
Determining the current trend is one of the most important tasks for a trader regardless of their trading style. Trend Scan is able to define a trend with a fairly high accuracy. The indicator applies the proprietary method in its calculations. Trend Scan is suitable for any currency pair and timeframe. It does not change its readings. The indicator takes into account the volume and volatility readings, combines them and displays the result as a histogram. The color of the histogram can be confi
Determining the current trend is one of the most important tasks for a trader regardless of their trading style. Price Direction is able to define a trend with a fairly high accuracy. The indicator applies the proprietary method in its calculations. Price Direction is suitable for any currency pair and timeframe. It does not change its readings. The indicator is based on volatility and the unique method. The histogram color depends on the current trend strength - the darker the histogram, the st
Price Peak is designed to search for extremes, places where the price is likely to reverse and the current trend is likely to change to the opposite. The indicator is suitable for any currency pairs. However, for the indicator values to be displayed adequately, it is necessary to have sufficient history data for the timeframe the indicator is attached to. It is recommended to attach Price Peak on the timeframes from M1 to D1. Its calculations use 7 methods, which are selected by a certain parame
Ozi Arrow is a unique indicator that can display signals in the direction of the main trend and counter trend signals. For calculations, the indicator determines a price channel. If recently the price was at its borders, and all conditions of additional filters are observed, a signal is displayed in the form of arrows. Ozi Arrow is suitable for any timeframe and any pair. The indicator signals do not disappear under any conditions. A distinctive feature is the presence of a trend filter. If the
Triton Arrow - уникальный авторский индикатор, имеющий возможность отображать 3 типа сигналов. Которые появляются в направлении текущей тенденции, и против нее, а также при определенном превышении волатильности. Triton Arrow  подходит для любого таймфрейма, валютной пары. Сигналы индикатора не пропадают ни при каких условиях. Рекомендуются таймфреймы  M5, М15. Параметры индикатора Основные настройки ( Main Settings ): CounterTrendPeriod  - период для расчета сигналов против тенденции, и расчета
Roll
Svyatoslav Kucher
The Roll indicator is designed for finding local extremes and determining the current trend. The indicator is based on the volume and volatility values. Indicator calculation can be modified by activating the Modification parameter and choosing one of the available calculation options from CalcMode . To be able to determine current trend using this indicator, you should increase the value of the OsPeriod parameter and decrease the values of DynamicLevelPeriod and ShiftDynamicLevel . The indicato
Double Wave applies standard indicators, volatility, volume and a number of custom approaches allowing for efficient combination of all mentioned tools. The indicator allows you to define possible price reversal points both in the direction of a trend (preferable) and against it. Also the indicator assists in determining the trend and visualizes it by displaying a histogram. The indicator works with any symbol provided that you have sufficient history data for a timeframe the indicator is launch
Extremum Search is designed to search for extremes, places where the price is likely to reverse and the current trend is likely to change to the opposite. With certain settings, the indicator can be used to define the current trend. The indicator works with any symbol provided that you have sufficient history data for a timeframe the indicator is launched at. It is recommended to attach Extremum Search on the timeframes from M1 to D1. Its calculations use 19 methods, which are selected by a cert
Determining the current trend is one of the most important tasks for a trader regardless of their trading style. Linear Trend can help you with this task. Linear Trend is a trend determining indicator, which uses an original calculation algorithm. The indicator is suitable for any currency pair and timeframe. It does not change its readings. The product applies three methods selected by a certain parameter and an additional modification of results. Due to the variety of settings and filters, the
Over Arrow  - уникальный авторский индикатор, имеющий возможность отображения сигналов в направлении основной тенденции, или против нее. Over Arrow  подходит для любого таймфрейма, валютной пары, но лучше всего использовать его на средних временных периодах, таких как М30, Н1, Н4. Сигналы индикатора не пропадают ни при каких условиях. Отличительной особенностью является наличие фильтра тенденции, при активации которого, сигналы будут появляться только в направлении основного движения. Параметры
Mystic Arrow
Svyatoslav Kucher
5 (4)
Mystic Arrow - уникальный авторский индикатор, отображающий сигналы в направлении основной тенденции, и против нее. Благодаря разнообразию настроек и фильтров индикатор можно настроить под свой стиль торговли. Mystic Arrow  подходит для любого таймфрейма, валютной пары. Сигналы индикатора не пропадают ни при каких условиях. Отличительной особенностью является возможность настроить сигналы индикатора отдельно для тенденции и против нее. Имеет в качестве отключаемого фильтра показания ценового кан
Speed Trend
Svyatoslav Kucher
3.67 (3)
Определение текущей тенденции - одна из самых важных задач трейдера независимо от стиля торговли. Индикатор  Speed Trend  поможет с достаточно высокой вероятностью это сделать. В расчетах индикатора используется авторская методика.  Speed Trend  подходит для любой валютной пары, любого таймфрейма, и не меняет свои показания. Индикатор очень просто в настройке, что является хорошим преимуществом для исследований. Параметры Основные настройки ( Main Settings ): IndicatorPeriod  - период для рас
Speed Master
Svyatoslav Kucher
2 (1)
Speed Master  - трендовый индикатор, сигналы которого отображаются в виде гистограммы, и нескольких видов стрелок на ценовом графике. Показания индикатора основаны на идентичных расчетах индикатора  Speed Trend -  https://www.mql5.com/ru/market/product/36524#!tab=tab_p_overview ,  за исключением того, что данный индикатор рассчитывает вместо одного, три указанных периода на текущем таймфрейме, и на их основе отображает сигналы в направлении от старшего периода к меньшему. Speed Master  - подходи
EA Turbine - автоматический советника, использующий в качестве сигнала для входа резкие ценовые колебание. Для получения сигнала цене нужно пройти определенное расстояние за некоторое время, также используются тиковые данные, для определения средних значений, и определенного их превышении на данный момент. Trend Strategy - при получении сигнала открывается ордер в направлении импульсного движения.  Back Strategy - при получении сигнала, на определенной дистанции от текущей цены выставляется отло
Stick
Svyatoslav Kucher
Stick  - уникальный авторский индикатор, отображающий сигналы в направлении основной тенденции, и против нее. Благодаря разнообразию настроек и фильтров индикатор можно настроить под свой стиль торговли. Stick  подходит для любого таймфрейма, валютной пары. Сигналы индикатора не пропадают ни при каких условиях. Отличительной особенностью является возможность настроить сигналы индикатора отдельно для тенденции и против нее. С помощью  Stick  можно открывать сделку только в направлении основного д
Определения текущей тенденции одна из самых важных задач трейдера не зависимо от стиля торговли. Индикатор Division  поможет с достаточно высокой вероятностью это сделать. Division  - индикатор распознавания тенденции, использующий в качестве источника данных подобие скользящих средних, в расчете которых используются объемы. От этих средних строятся границы, которые служат сигнализатором для смены текущей тенденции. Показания индикатора не изменяются не при каких условиях.  При желании можно вкл
Price Detect
Svyatoslav Kucher
5 (1)
Определения текущей тенденции одна из самых важных задач трейдера не зависимо от стиля торговли. Индикатор Price Detect  поможет с достаточно высокой вероятностью это сделать. Price Detect  - индикатор распознавания тенденции, использующий авторский алгоритм расчета. Показания индикатора не изменяются не при каких условиях. Также с помощью индикатора можно наблюдать за коррекцией цены в сторону глобального тренда, определять возможные границы окончания отката. Индикатор подходит для любой валютн
Moment  - авторский индикатор, имеющий простые настройки, и несколько типов сигналов. Каждый пользователь сможет настроить его показания под свой стиль торговли, и валютную пару. Индикатор не меняет свои показания. Со всеми моими продуктами можно ознакомиться по ссылке  https://www.mql5.com/ru/users/slavakucher/seller Параметры индикатора Основные настройки ( Main Settings ): HistoryBars  - количество баров для отображения. CalculationPeriod - период для расчетов. IndicatorDelta - дельта. Indi
Определения текущей тенденции одна из самых важных задач трейдера не зависимо от стиля торговли. Индикатор  Price Detect   Volume поможет с достаточно высокой вероятностью это сделать. Price Detect Volume  - индикатор распознавания тенденции, использующий авторский алгоритм расчета, использующий объемы. Показания индикатора не изменяются не при каких условиях. Также с помощью индикатора можно наблюдать за коррекцией цены в сторону глобального тренда, определять возможные границы окончания отката
Определение текущей тенденции - одна из самых важных задач трейдера независимо от стиля торговли. Индикатор  Trend Selection  поможет с достаточно высокой вероятностью это сделать. В расчетах индикатора используется авторская методика.  Trend Selection  подходит для любой валютной пары, любого таймфрейма, и не меняет свои показания. Цвет гистограммы зависит от силы текущей тенденции: чем темнее гистограмма, тем сильнее текущая тенденция. На текущий момент индикатор имеет два метода расчета сигн
EA Compass  - автоматический советник, работающий на пробой определенных ценовых уровней.   По умолчанию советник настроен для EURUSD, таймфрейм Н1. Set файлы  вы можете скачать с диска -  https://drive.google.com/drive/folders/1Rxiesljy_3515WsikRMExzxJjcZKMnMH?usp=sharing , или смотрите в обсуждении советника. ВАЖНО: обратите внимание на параметры GMT! Для того, чтобы получить корректные результаты, вы должны установить их правильно в соответствии с GMT вашего брокера. Для каждой установленной
EA Coyote
Svyatoslav Kucher
5 (1)
EA Coyote  - an automatic advisor that starts trading at the end of the New York session and in the first hours after its close. Signals for opening deals are determined by the author's and standard methods. For a complete list of parameters and set files, see the blog -  https://www.mql5.com/en/blogs/post/740145 . Or download from disk  https://drive.google.com/drive/folders/1XpgtTNSZ31_ad7ecYmUREC5v_LprVAJF?usp=sharing . Default settings for EURUSD, M5 timeframe. For testing, must download the
EA Excess  - автоматический советник использующий в качестве сигнала для входа сравнение волатильности нескольких периодов, и при определенном превышении ее значения открывает сделки, если дополнительные фильтры активированы и также находятся на нужных значениях. Советник имеет возможность настройки торговли в определенное время, и дополнительную возможность увеличения лотности ордера, или серии ордеров после убытков. ВАЖНО:  обратите внимание на параметры GMT! Для того, чтобы получить корректны
EA Trend Paradox  - автоматический советник, использующий в качестве сигнала показание некоторых стандартных, и авторских индикаторов, при удовлетворительных значений которых, ордера открываются в направлении тенденции. Для определения тенденции используются некоторые стандартные и авторские подходы, что позволяют достаточно точно определить направление торгов.  По умолчанию советник настроен для EURUSD, таймфрейм M5. Полный список параметров и   set файлы   смотрите в блоге -  https://www.mql5.
Trade Zone SupDem - индикатор служит для определения зон спроса/предложения. В возможности входят такие функции, как отображение зон уже пробитых, зон к которым цена еще не доходила с момента определения, и подтвержденным, к которым цена уже доходила, но не пересекала полностью. Сами зоны можно определять, как с текущего таймфрейма, так и со старшего. Важно помнить, что если необходимо отображения зон с нескольких таймфреймов, то придется прикреплять к графику несколько копий индикатора, и при э
フィルタ:
レビューなし
レビューに返信