Waddah Attar Statistical Predictor
- インディケータ
-
Ahmad Waddah Attar
 My Golden Advise :
IF YOU CAN NOT DEFEAT FOREX ... DO NOT TRADE . - バージョン: 1.0
- アクティベーション: 5
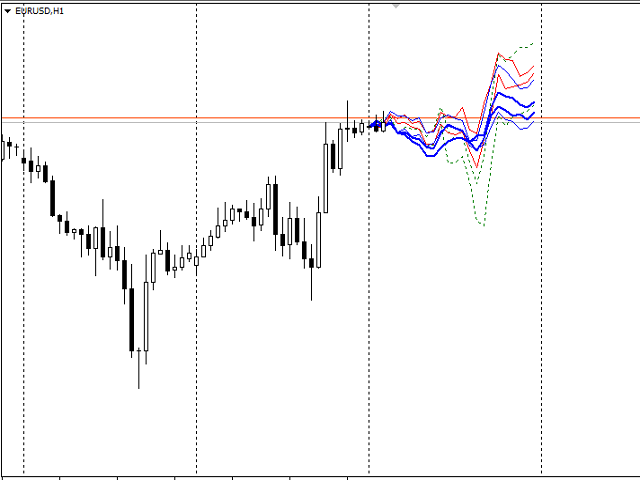
Waddah Attar Statistical Predictor
This indicator show you the Statistical Forecast for any symbol.
it depends on a history data .
the result show on a new day and still with no change until end of the day .
with this indicator you can :
- know the main direction .
- know the range of the movement .
- know high and low in the current day .
- use indicator levels in any expert you made to auto trade .
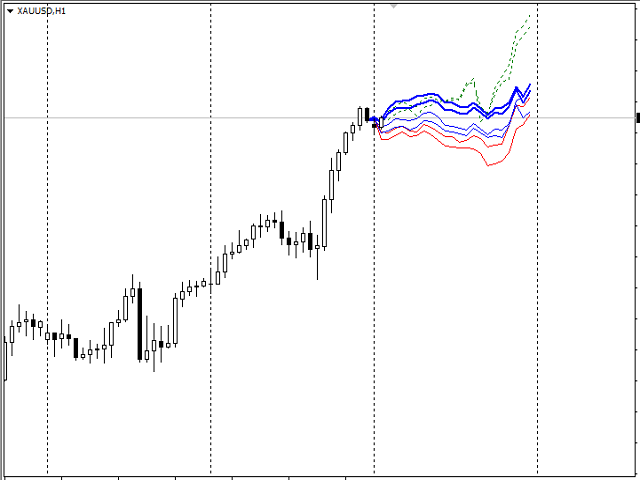
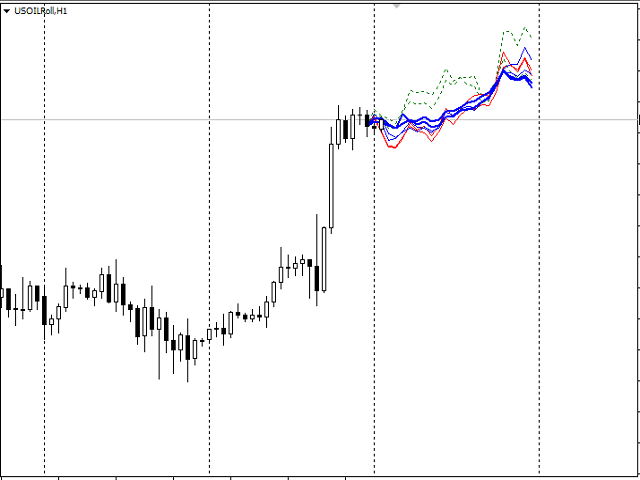
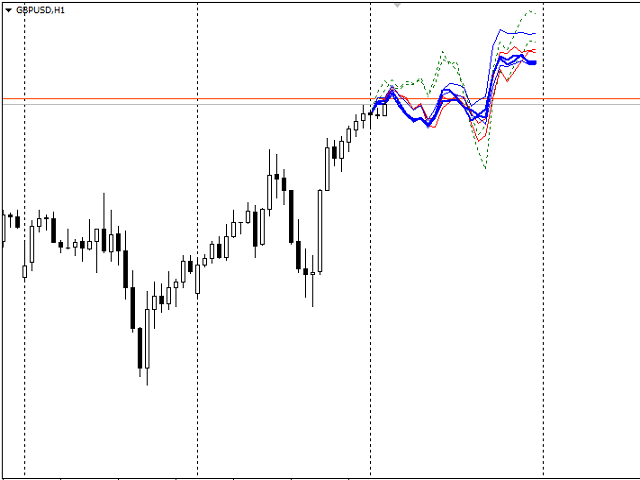
Preferably used with main symbols like EURUSD, GBPUSD, AUDUSD, NZDUSD, USDJPY, USDCHF, USDCAD, Gold, Silver and Oil.
Also use H1 Frame for best result .
The Best Result When Lines make Harmony .
The success rate of expectations is very high .
try it on demo account first .
absolutely useless....
if you was buy this indicator .. you can make buy cancel .. I will Agree .