Speed Trend
- インディケータ
- バージョン: 1.0
- アクティベーション: 5

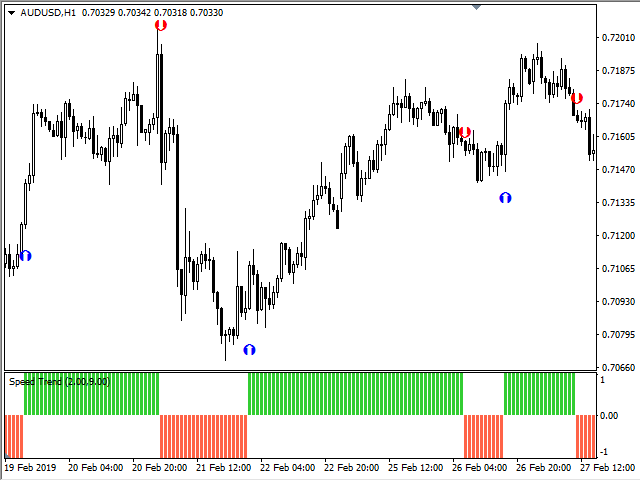
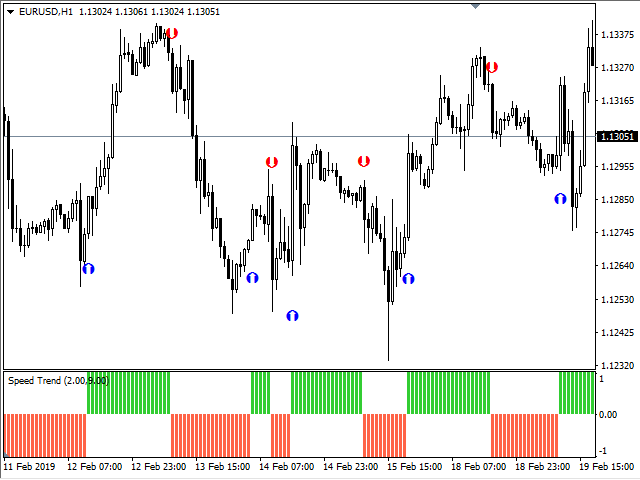
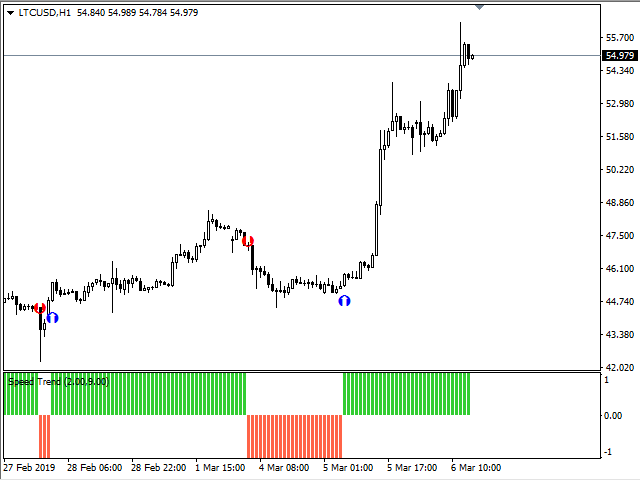
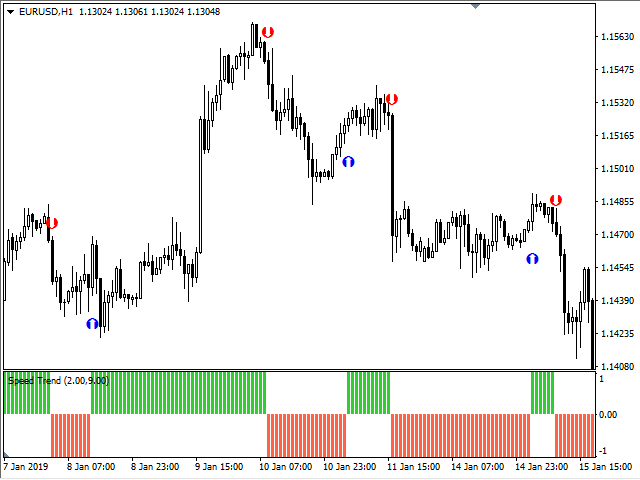
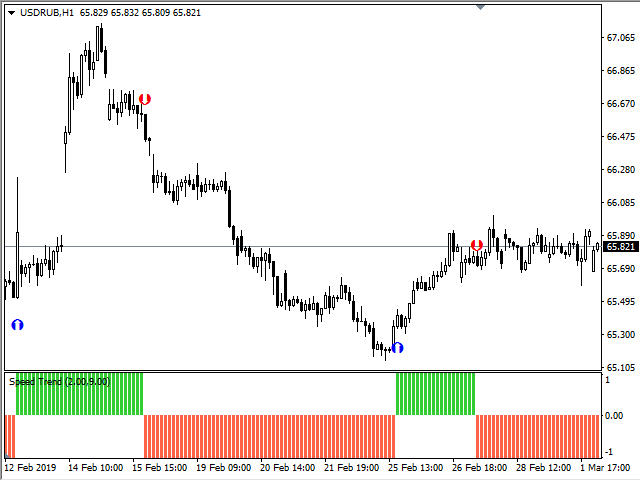
Определение текущей тенденции - одна из самых важных задач трейдера независимо от стиля торговли. Индикатор Speed Trend поможет с достаточно высокой вероятностью это сделать.
В расчетах индикатора используется авторская методика. Speed Trend подходит для любой валютной пары, любого таймфрейма, и не меняет свои показания. Индикатор очень просто в настройке, что является хорошим преимуществом для исследований.
Параметры
- Основные настройки (Main Settings):
- IndicatorPeriod - период для расчета.
- IndicatorDelta - дельта значений.
- HistoryBars - количество баров для отображения.
- Настройки отображения стрелок (Arrow Settings):
- ShowArrows - разрешение на отображение стрелок.
- ArrowsUpColor - цвет BUY стрелок.
- ArrowsDnColor - цвет SELL стрелок.
- ArrowUpStyle - стиль BUY стрелок.
- ArrowDnStyle - стиль SELL стрелок.
- ArrowWidth - размер стрелок.
- ArrowsID - идентификация стрелок, для каждой копии индикатора нужен разный.
- Настройки оповещения (Alert Settings):
- Alerts - включить оповещение.
- AMessage - показать диалоговое окно.
- ASound - проиграть звуковой файл.
- AEmail - отправить электронное письмо по адресу, указанному в окне настроек на закладке "Почта".
- ANotificaton - отправить уведомление на мобильные терминалы.
- soundfile - название звукового файла.


Always be on the right side