Division
- インディケータ
- バージョン: 1.0
- アクティベーション: 5

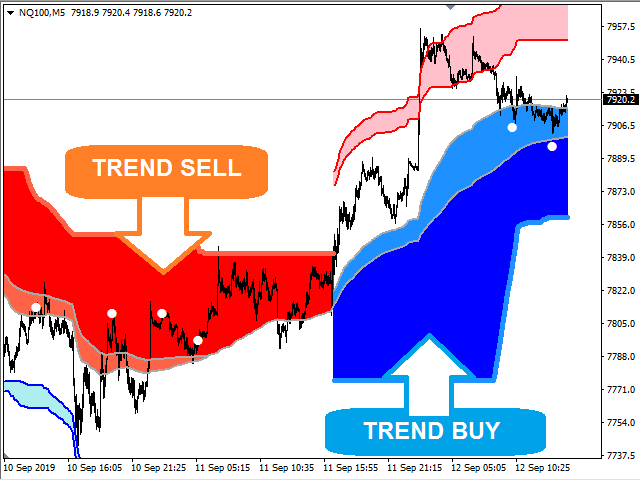
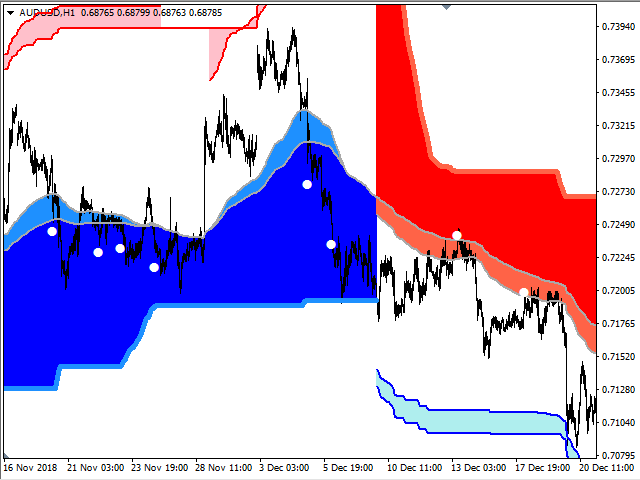
Определения текущей тенденции одна из самых важных задач трейдера не зависимо от стиля торговли. Индикатор Division поможет с достаточно высокой вероятностью это сделать.
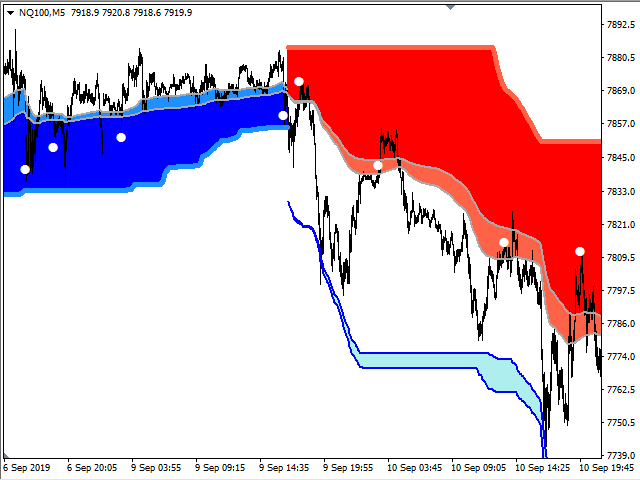
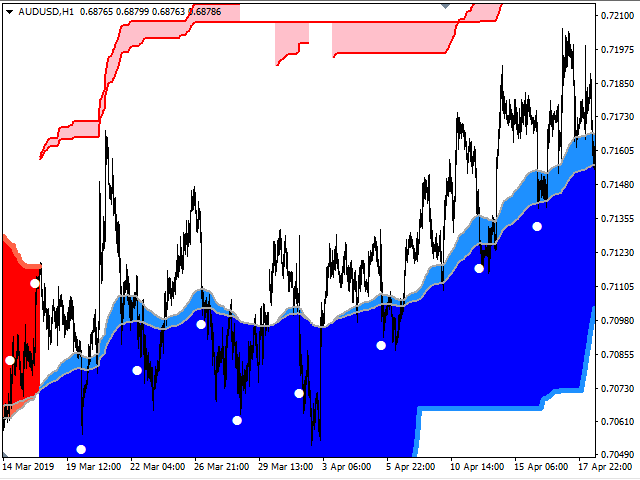
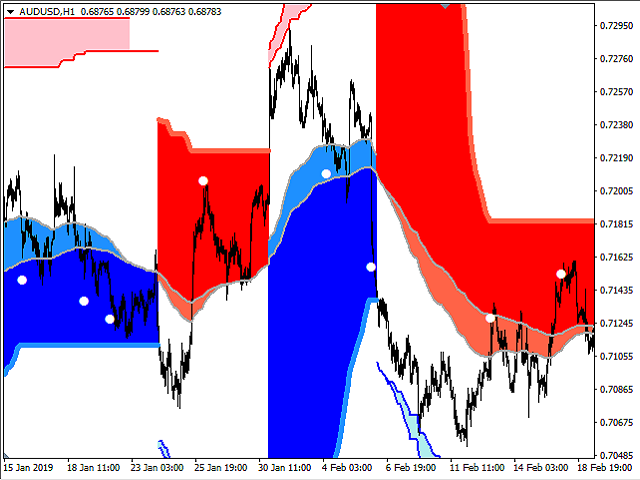
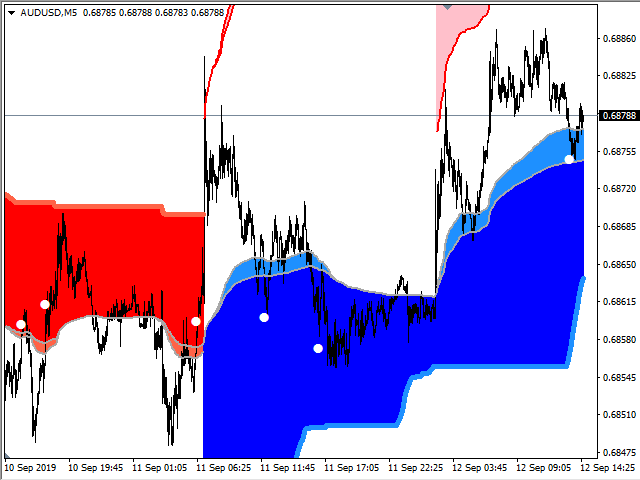
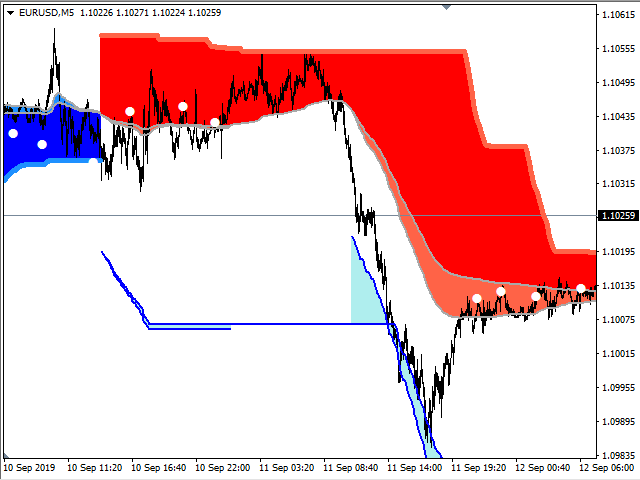
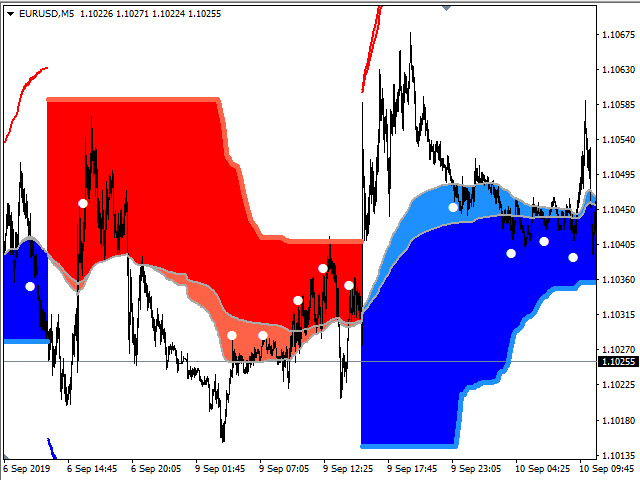
Division - индикатор распознавания тенденции, использующий в качестве источника данных подобие скользящих средних, в расчете которых используются объемы. От этих средних строятся границы, которые служат сигнализатором для смены текущей тенденции. Показания индикатора не изменяются не при каких условиях.
При желании можно включить сигналы, которые будут появляться на коррекционных движениях цены, в направлении текущей тенденции.
Так как для построения индикаторных значений используются графические объекты, работа в тестере существенно замедляется, поэтому
тестирование можно проводить по ценам открытия, для более быстрого понимания работы индикатора.
Параметры индикатора
- Основные настройки (Main Settings):
- HistoryBars - количество баров для отображения.
- IndicatorPeriodSlow - период для расчета средних значений для медленной линии.
- IndicatorPeriodFast - период для расчета средних значений для быстрой линии.
- TrendDeviation - отступ от медленной линии, для определения границ смены тенденции.
- CounterDeviation - отступ от границ линий, для определения возможного окончания тенденции.
- IndicatorID - идентификатор для отображения имени индикатора в окне, и создания объектов. При использовании двух версий индикатора для одного ценового графика, идентификаторы должны различаться. Можно прибавлять к имени индикатора, как вариант 1, 2, 3....
Здравствуйте, ваш продукт очень красивый! У меня есть заметки о предупреждениях и уведомлениях, которые мы хотим добавить в следующих версиях, и спасибо