Delta Volume Indicator

Introducing the Delta Volume Profile Indicator - Unleash the Power of Institutional Precision! 

Technical Indicator: Are you ready to trade like the pros? The Delta Volume Profile Indicator is no ordinary tool. It’s a high-precision, cutting-edge indicator that puts the power of institutional-grade trading in your hands. This unique indicator analyses delta volume distribution in real-time, revealing the market's hidden buy/sell imbalances that the biggest financial institutions rely on to anticipate price direction. With unparalleled accuracy, it goes beyond the basic volume analysis, providing you with deep insight into where "big money" is positioning.

This is not just any indicator; it’s a game-changer! Developed to cater to traders who demand high reliability and consistency, the Delta Volume Profile Indicator uses advanced volume profile techniques that allow you to view the market through the lens of top-tier market participants. Get ready to spot the levels where smart money is actively trading and join their ranks by capitalizing on hidden imbalances and crucial price levels that drive significant market moves.

Features:

  • Real-Time Delta Volume Analysis: Tracks buy and sell imbalances as they happen, giving you a true real-time advantage.
  • Aggressive Buyers and Sellers : It identify when aggressive buyers or sellers are dominating the market. Passive buyers and sellers are not keen in market participation.
  • Institutional-Grade Reliability: Provides you with the confidence that professionals and institutions have, ensuring you trade with conviction.
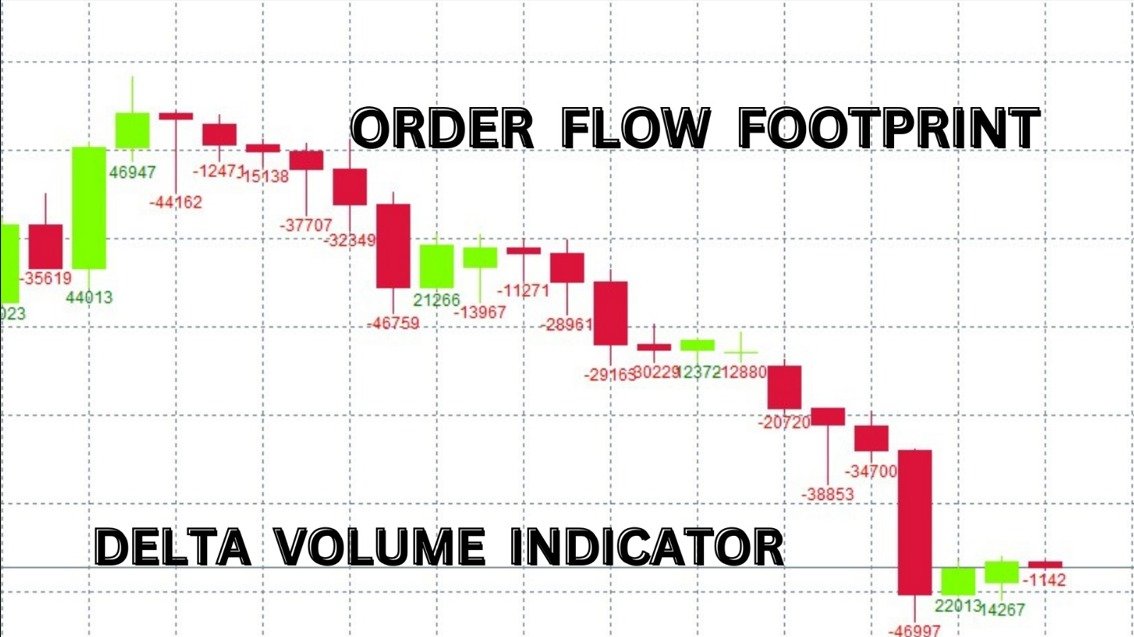
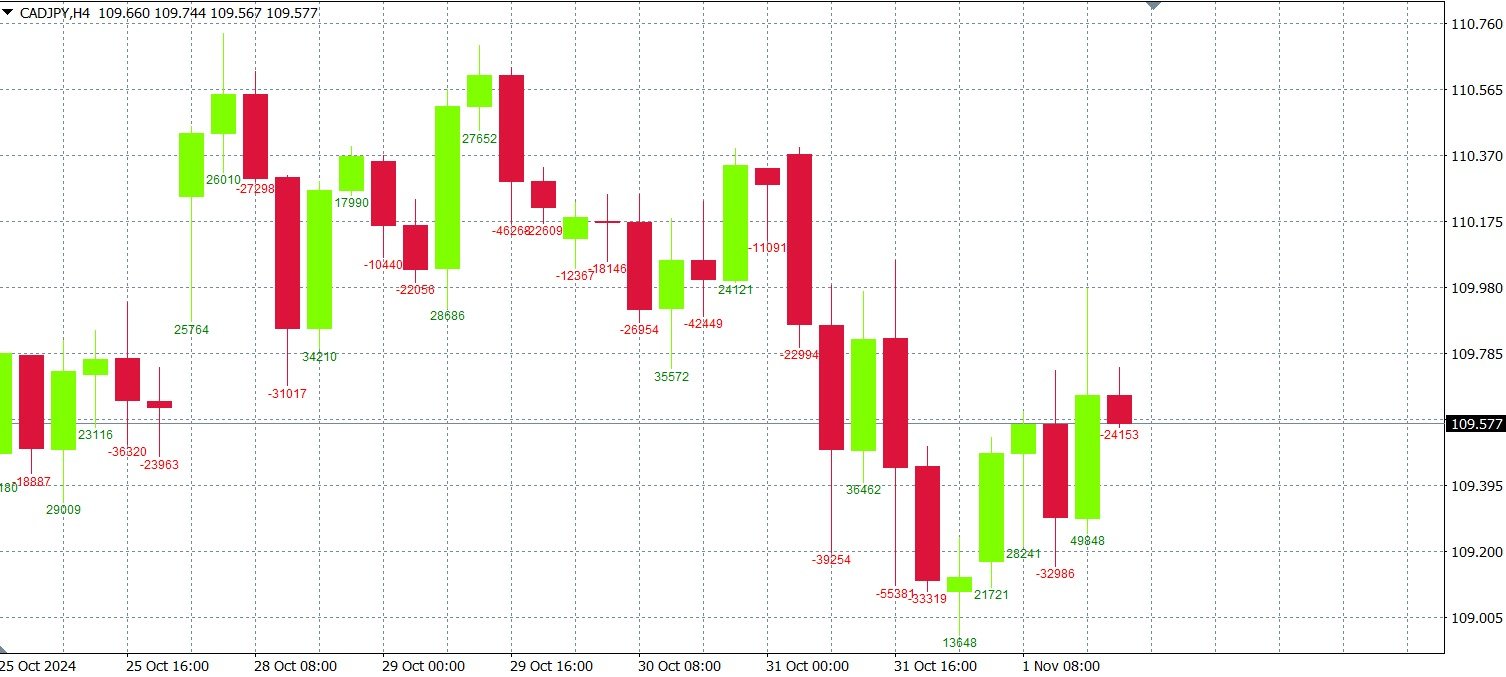
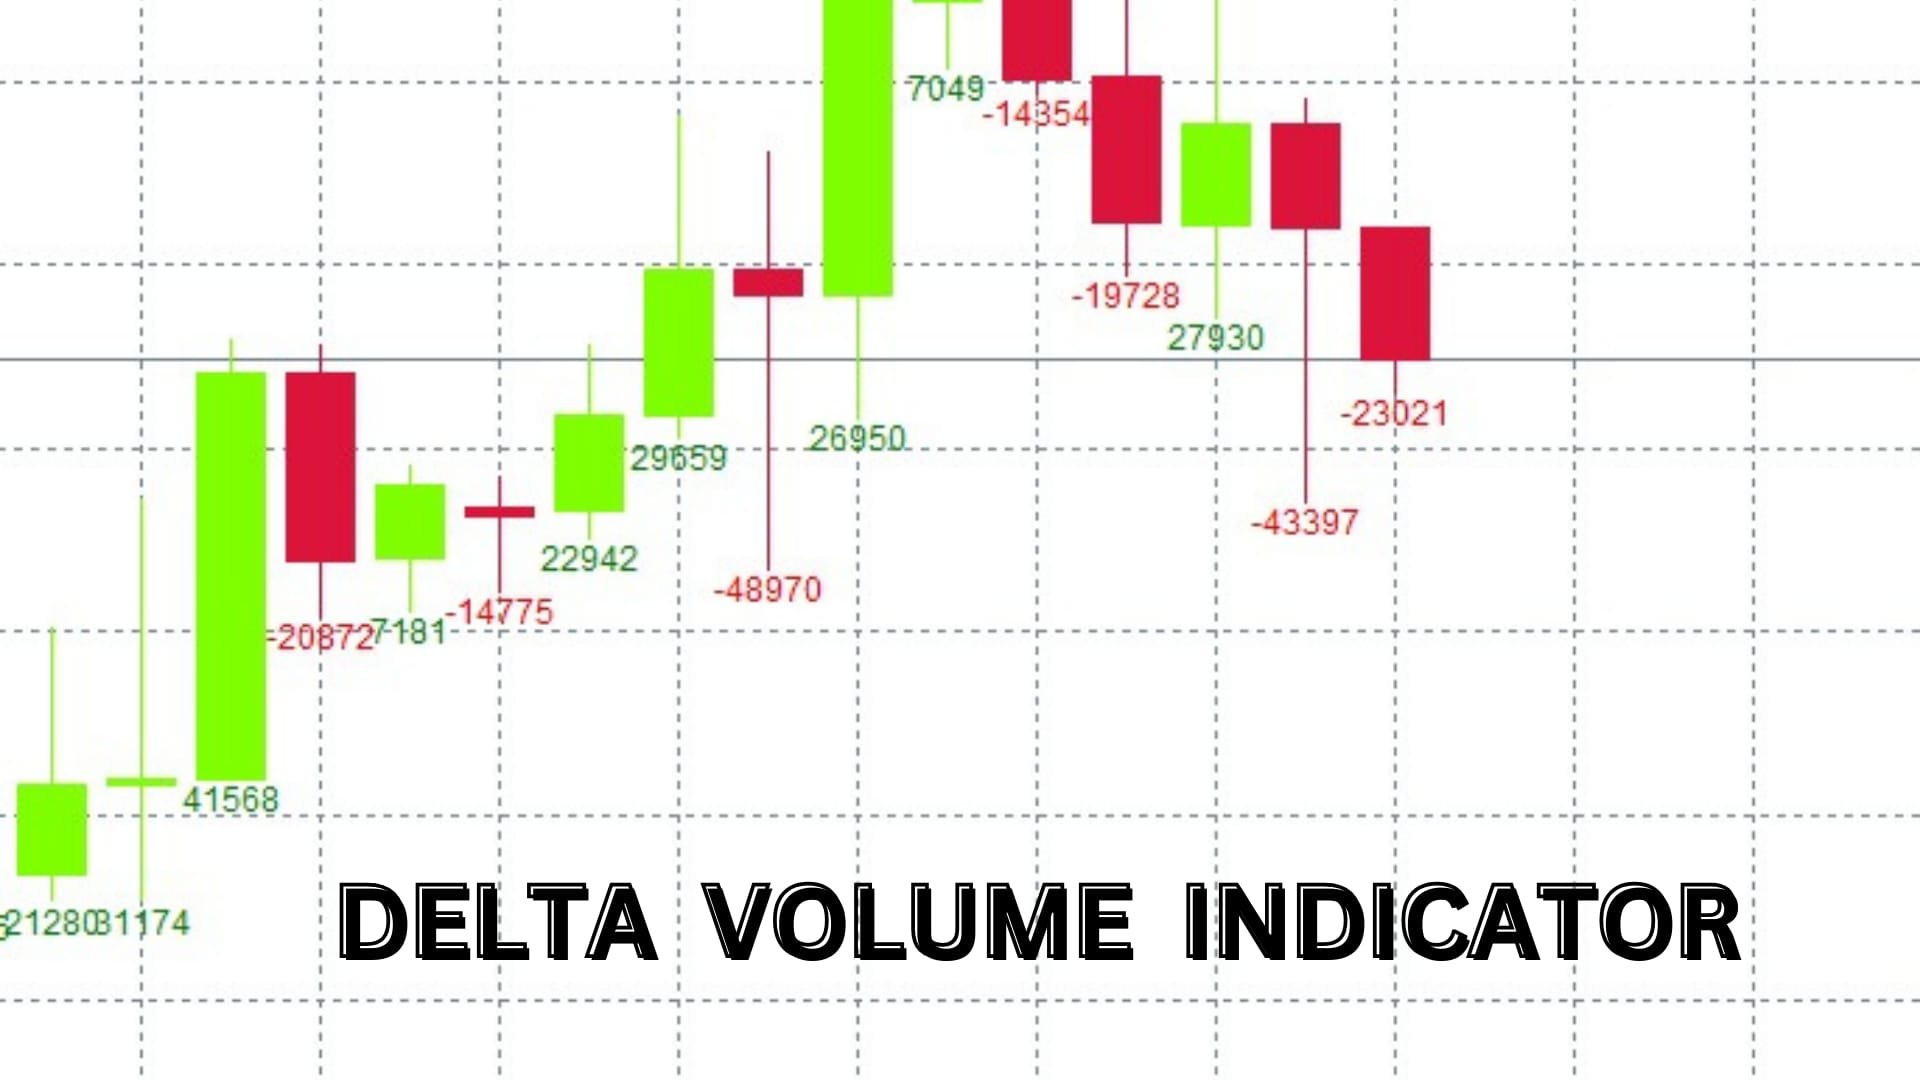
  • Powerful Visuals: Clear and detailed profiles that highlight the Delta Value of significant volume, making it easy to spot high-impact price levels.
  • Foot Print: Individual Candle Delta Footprint shows on the chart
  • Customizable Candle Display Settings: Set it up according to your trading style, with adjustable numbers of Delta display candle to ensure you are looking at volume profile in real time according to your settings.
  • Plug-and-Play Interface: Seamless integration with your platform, making it easy to install and start using right away.

Get ahead of the curve with the Delta Volume Profile Indicator! Whether you're a day trader, swing trader, or a long-term investor, this indicator brings you an edge that’s usually reserved for the institutional elite. Now is your chance to experience the power of real-time delta volume profile analysis and make the market’s hidden movements work for you!

Don’t just trade – Trade smart, trade powerful! Get the Delta Volume Profile Indicator now and elevate your trading to the next level.

This indicator available for MT4 and MT5 Version -- 

NOTE: Delta Volume Indicator is designed to show Historic and Present candle Delta volume as it is shown on the image, if otherwise kindly message me directly. Thanks


おすすめのプロダクト
Everyday trading represents a battle of buyers ("Bulls") pushing prices up and sellers ("Bears") pushing prices down. Depending on what party scores off, the day will end with a price that is higher or lower than that of the previous day. Intermediate results, first of all the highest and lowest price, allow to judge about how the battle was developing during the day. It is very important to be able to estimate the Bears Power balance since changes in this balance initially signalize about possi
BoxProfile MT4
Evgeny Shevtsov
4.92 (12)
The indicator displays volume profiles based on the nesting principle. Profiles periods are pre-set so that each subsequent profile has a length twice as long as the length of the previous profile. In addition to profiles, the indicator displays volume clusters sorted by color, depending on the volume they contain. Indicator operation features The indicator works on typical timeframes from M5 to MN, but for calculations uses historical data from smaller timeframes: M1 - for timeframes from M5
FREE
Volume DeltaPanel is a very powerful indicator that read the supply on Market. It calculates the Delta from movement of the price and the difference of BUY volumes and SELL volumes. The Volumes are added to price and normalized to symbol points. Its special structure allows you to get all Time Frames values available on the platform MT4. Panel can show 28 instruments simultaneously all customizable according to the offer of the Broker. A good observation of this instrument can suggest great ent
Deep Insight Candles is an indicator that brings an entirely new perspective to the price chart. It focuses on revealing hidden structures in market movements, uncovering buyer and seller pressure, thus helping traders to better identify key levels, dynamics, and potential reversals. The indicator conveys deeper market insights, allowing traders to make decisions based on a more accurate perception of market sentiment and pressure at specific price levels. This innovative approach transforms the
A technical indicator that displays information about the trading volume in the form of a histogram of distribution by price levels. It is used as an independent indicator that helps to evaluate the current objective situation of the instrument, as well as in the format of integration with other methods of analysis, to confirm or filter when making trading decisions. Key Features: Interactive profile update, real-time work Five modes of histogram calculation The possibility of separating the vol
Indicator (includes Volume Profile + Order Blocks) - a revolutionary indicator that combines two of the most powerful concepts of modern technical analysis: volume profiles and institutional players' order blocks. This tool allows you to see what is hidden from most traders and gives you a significant advantage in the market. Key benefits of the indicator: Visualization of "smart money": Clearly shows the areas of concentration of large players, highlighting areas with maximum volume in bright
Introduction to the use of MT4 platform AI Color Gradient Volume indicators I. Overview of indicators AI Color Gradient Volume is an innovative volume analysis indicator based on artificial intelligence technology for the MT4 platform. By converting the volume data into an intuitive color gradient graph, it helps traders to have a more acute insight into the inflow and outflow of funds in the market and the strength of the buying and selling forces, so as to provide strong support for trading
Pips 外国為替はすぐに使える取引システムです。 このインジケーターは、いつ、どの方向で注文をオープンする必要があるかをチャート上の矢印で示します。 矢印が緑の場合は買い取引をオープンし、矢印が赤の場合は売り取引をオープンします。 すべてが非常にシンプルで非常に効果的です。 テイクプロフィットは15~25ポイントを設定。 ストップロスはポイントレベルで設定されます。 ドットが移動すると、すぐに StopLoss をオーバーライドします。 M1 と M5 の取引に推奨される時間枠。 これはスキャルピング戦略であり、最小の時間枠で最も効果的です。 通貨ペアは任意です。 推奨される通貨のうち、GBPUSD、EURUSD、XAUUSD、USDCHF を提供できます。 設定はデフォルトのままにすることができます。 この戦略を使用すると、毎日 10 ~ 20 件の取引を開始できます。 Pips 外国為替インジケーターの利点: これは、あらゆる通貨ペアに対応する既成の取引戦略です。 これは最小の時間枠 M1 および M5 で取引するためのスキャルピング取引戦略です。 この戦略は非常にシンプルで
Market Profile 3
Hussien Abdeltwab Hussien Ryad
3 (2)
Market Profile 3 MetaTrader 4 indicator  — is a classic Market Profile implementation that can show the price density over time, outlining the most important price levels, value area, and control value of a given trading session. This indicator can be attached to timeframes between M1 and D1 and will show the Market Profile for daily, weekly, monthly, or even intraday sessions. Lower timeframes offer higher precision. Higher timeframes are recommended for better visibility. It is also possible t
FREE
Hurst Buy and Sell Mt4
Victor Alfonso Molina Botello
Hurst Buy and Sell  This innovative indicator, inspired by xAI Grok intelligence, uses the Hurst exponent to identify the nature of the market and generate buy/sell signals. The EA for this indicator (Hurst Razer PRO EA MT5) is now available, you can see it by clicking here!  https://www.mql5.com/es/market/product/153441?source=Site+Profile+Seller  If you want more signals from the indicator, change the minimum number of bars between consecutive signals. The lower the value, the more signals it
FREE
Simple QM Pattern is a powerful and intuitive trading indicator designed to simplify the identification of the Quasimodo (QM) trading pattern. The QM pattern is widely recognized among traders for effectively signaling potential reversals by highlighting key market structures and price action formations. This indicator helps traders easily visualize the QM pattern directly on their charts, making it straightforward even for those who are new to pattern trading. Simple QM Pattern includes dynamic
FREE
The   Visual Volatility Clustering   indicator clusters the market based on volatility. The indicator does not redraw and gives accurate data, does not use closing prices. Uses the opening prices or the highs or lows of the previous completed bar. Therefore, all information will be clear and unambiguous. The essence of the indicator is to divide the price market into certain areas according to a similar type of volatility. This can be done in any way. In this example, the indicator is configure
SX Supply Demand Zones accurately identifies and draws high-probability Supply and Demand zones using a sophisticated algorithm. Unlike traditional indicators that clutter your chart, this indicator is designed with a focus on performance and a clean user experience. New Unique Feature: Interactive Legend System What truly sets this indicator apart from everything else is the Interactive Control Legend. You have a professional dashboard directly on your chart that allows you to: Show/Hide: Ins
FREE
Everyday trading represents a battle of buyers ("Bulls") pushing prices up and sellers ("Bears") pushing prices down. Depending on what party scores off, the day will end with a price that is higher or lower than that of the previous day. Intermediate results, first of all the highest and lowest price, allow to judge about how the battle was developing during the day. It is very important to be able to estimate the Bears Power balance since changes in this balance initially signalize about possi
Session Volume Profile  is an advanced graphical representation that displays trading activity during Forex trading sessions at specified price levels. The Forex market can be divided into four main trading sessions: the Australian session, the Asian session, the European session and the favorite trading time - the American (US) session. POC  - profile can be used as a support and resistance level for intraday trading. VWAP  - Volume Weighted Average Price. ATTENTION! For the indicator to wo
In the age of speed, everyone wants to gets what he/she wants quickly. Trading is all about gaining money, and scalping is a way of doing it in a short time. The "Scorpion Scalper Pro" has been named on the scorpion because of its speed. The indicator serves to provide signals for the M15 timeframe. It also sends Alerts (window alert, email alert, push notification alert) whenever a buy/sell signal occurs, and the alerts are customizable (they can be turned ON or OFF). Indicator inputs : - Buy
Here is a sensitive indicator for Dublgis professionals. It is built on completely new algorithms and is more efficient, on any timeframes, since it filters random price movements. Finds and visually displays price reversal points. This tool can be used as confirmation when making a deal, as well as to determine the direction of the trend and its strength. The indicator was developed as a complement to a number of our other trading tools.
The "Market Profile" indicator displays the profiles and volumes of periods – weekly, daily, session (8-hour), 4-hour, hour, summary. The VAH/VAL price area is automatically highlighted by a dotted line for each profile (except for the summary). The indicator includes chroma Delta, which colors the profile areas. The areas of prevailing Buys is colored in green, that of Sells - in red. The intensity histogram features blue/red respectively. In the filter mode, the indicator displays the volume a
The indicator allows you to trade binary options. The recommended time frame is М1 and the expiration time is 1,2,3 minutes. The indicator suitable for auto and manual trading. A possible signal is specified as a arrows above/under a candle. You should wait until the candle closes! Arrows are not re-painted Trade sessions: TOKYO section (Half-end) Currency pairs: USD/JPY Working time frame: M1 Expiration time: 1,2,3 minutes. The indicator also shows good results when using the martingale strateg
FREE
このプロジェクトが好きなら、5つ星レビューを残してください。 このインジケータは、指定されたためのオープン、ハイ、ロー、クローズ価格を描画します 特定のタイムゾーンの期間と調整が可能です。 これらは、多くの機関や専門家によって見られた重要なレベルです トレーダーは、彼らがより多くのかもしれない場所を知るために有用であり、 アクティブ。 利用可能な期間は次のとおりです。 前の日。 前週。 前の月。 前の四半期。 前年。 または: 現在の日。 現在の週。 現在の月。 現在の四半期。 現年。
FREE
The "MR Volume Profile Rectangles 4" indicator is a charting tool that displays trading volume at different price levels rather than time intervals. A key concept in volume profile is the point of control (POC) —the price level with the highest volume traded during the session or time range. While tools like VWAP or OBV provide volume trends, the "MR Volume Profile Rectangles 4" indicator offers granular detail about where the most market activity occurs at specific price levels. This makes it a
GANN Forecaster – Precision Tool for Forex Traders (MT4) Elevate your trading with the Gann Forecaster Scanner for MetaTrader 4. This powerful, interactive tool provides precise price and time projections, giving you a professional edge across Forex, Gold, Indices, and Crypto markets. Building on the robust functionality of the Gann Forecaster indicator, this advanced scanner offers multi-pair analysis, continuously calculating Gann levels and alerting you to optimal trade entry points. A clea
Flat Reminder Overview Flat Reminder is a powerful technical analysis tool that identifies and highlights price consolidation zones on your chart. It detects when price action slows down and moves sideways, indicating potential reversal points, continuation setups, or key decision zones in the market. Key Features Consolidation Detection : Automatically identifies flat price zones where market momentum decreases Range Measurement : Calculates and displays the exact range of each consolidation in
FREE
Introducing Volume Orderflow Profile , a versatile tool designed to help traders visualize and understand the dynamics of buying and selling pressure within a specified lookback period. Perfect for those looking to gain deeper insights into volume-based market behavior! MT5 Version -  https://www.mql5.com/en/market/product/122657 The indicator gathers data on high and low prices, along with buy and sell volumes, over a user-defined period. It calculates the maximum and minimum prices during this
The most important price level in any "Volume profile" is the "Point of Control" . This is the price level with the highest trading volume. It is primarily the level where large players initiate their positions, making it the accumulation/distribution level for the "Smart money" . The idea of the indicator arose after the "MR Volume Profile Rectangles 4" indicator was made. When creating the "MR Volume Profile Rectangles 4" indicator, we spent a lot of time comparing the volumes with those from
外国為替マーケットプロファイル(略してFMP) これは何ではありません: FMPは、従来の文字コード化されたTPO表示ではなく、チャートデータプロファイルの計算全体を表示しません。また、チャートを期間に分割して計算しません。 それが何をするか: 最も重要なことは、FMPインジケーターは、ユーザー定義のスペクトルの左端とユーザー定義のスペクトルの右端の間にあるデータを処理することです。 ユーザーは、インジケーターの両端をマウスで引くだけでスペクトルを定義できます。 インジケーターの右端がライブバーに引き寄せられ、さらに(将来に)引っ張られると、インジケーターは「ライブ」と見なされます(新しいバーで更新されます) インジケーターは、アタッチされているチャートに「アンカー」オブジェクトをドロップし、その後、そのアンカーをハードドライブ上のファイルに関連付けます。 これにより、チャート(またはインジケーター)が閉じられるまで、再起動しても設定が維持された状態で、チャート上で継続的なFMPを実行できます。 FMPインジケーターは、1つのチャート上でそれ自体の多くのインスタンスを実行でき、
FREE
GT_Volume - это универсальный индикатор подходящий для всех валютных пар. Показывает текущий объем на горизонтальных уровнях. Объемы рисуются по мере движения цены. Все просто и нет ни чего лишнего. Индикатор очень помогает быстро определить сильные уровни сопротивления и поддержки, работает шустро! Есть возможность поменять цвет и выбрать день на котором отображать объемы.
Lisek Weis Wave
Darius Hans Lischka
5 (3)
This Weis Wave Volume indicator is a tool to help traders identify the current price trend.  Understanding volume can provide insight into a market's behavior to help you determine its overall health. The most important rule is this: volume precedes price. Typically, before a market price moves, volume comes into play. It has 2 main colors histogram which are green and red. – Green indicates an upward wave. The more the price increases, the bigger the green volume gets. – The red color shows a d
FREE
Accumulation/Distribution Technical Indicator is determined by the changes in price and volume. The volume acts as a weighting coefficient at the change of price – the higher the coefficient (the volume) is, the greater the contribution of the price change (for this period of time) will be in the value of the indicator. In fact, this indicator is a variant of the more commonly used indicator   On Balance Volume . They are both used to confirm price changes by means of measuring the respective vo
Подкрашивает аномально большие тиковые объёмы в красный цвет. Имеет следующие настройки: "Процент" по умолчанию "70"  (Процент на который аномальный объём должен быть больше предыдущего) "Уровень" по умолчанию "500" (Количество тиков, больше которого будем брать во внимание аномальный объём) Внимание! Данный индикатор был разработан для мелких таймфреймов M1,M5,M15. Идея в том, что на таких Таймфреймах увеличение количества тиков говорит об увеличении количество сделок, увеличения интереса к цен
このプロダクトを購入した人は以下も購入しています
Precautions for subscribing to indicator This indicator only supports the computer version of MT4 Does not support MT5, mobile phones, tablets The indicator only shows the day's entry arrow The previous history arrow will not be displayed (Live broadcast is for demonstration) The indicator is a trading aid Is not a EA automatic trading No copy trading function The indicator only indicates the entry position No exit (target profit)  The entry stop loss point is set at 30-50 PIPS Or the front hi
Looking for a powerful yet lightweight swing detector that accurately identifies market structure turning points? Want clear, reliable buy and sell signals that work across any timeframe and any instrument? Buy Sell Arrow MT Swing is built exactly for that — precision swing detection made simple and effective. This indicator identifies Higher Highs (HH) , Higher Lows (HL) , Lower Highs (LH) , and Lower Lows (LL) with remarkable clarity. It is designed to help traders easily visualize market stru
El indicador "MR BEAST ALERTAS DE LIQUIDEZ" es una herramienta avanzada diseñada para proporcionar señales y alertas sobre la liquidez del mercado basándose en una serie de indicadores técnicos y análisis de tendencias. Ideal para traders que buscan oportunidades de trading en función de la dinámica de precios y los niveles de volatilidad, este indicador ofrece una visualización clara y detallada en la ventana del gráfico de MetaTrader. Características Principales: Canal ATR Adaptativo: Calcula
Weis Wave with Alert
Trade The Volume Waves Single Member P.C.
4.82 (22)
Rental/Lifetime Package Options and Privileges' Rent Monthly Six Months   Yearly/Lifetime Weis Wave with Speed with Alert+Speed Index x x x Manual  x x x Quick Set up Video x x x Blog x x x Lifetime Updates x x x Setup and Training Material x x Rectangle Break Alert Tool      x Discord Access Channel "The SI traders" x   How to trade info visit:    http://www.tradethevolumewaves.com   ** If you purchase please contact me to setup your  : training Room and  complete manual access.  This is
Are you looking for a simple and reliable indicator that can help you spot market swing points easily? Do you want clear buy and sell signals that work on any timeframe and any trading instrument? Buy Sell Signal Pro is designed to do exactly that. It helps traders identify important market turning points and understand the current market structure in a clear and easy way. This indicator detects Higher Highs (HH), Higher Lows (HL), Lower Highs (LH), and Lower Lows (LL) so you can quickly see wh
Miraculous Indicator – ガン・スクエア・オブ・ナインに基づく100%非リペイントのFXおよびバイナリーツール この動画では、FXおよびバイナリーオプションのトレーダー向けに特別に開発された、非常に正確で強力な取引ツールである Miraculous Indicator を紹介しています。このインジケーターがユニークなのは、伝説的な ガン・スクエア・オブ・ナイン と ガンの振動の法則 に基づいている点で、現代の取引で利用できる最も正確な予測ツールの一つとなっています。 Miraculous Indicatorは 完全に非リペイント であり、ローソク足が確定した後にシグナルが変化したり消えたりすることはありません。つまり、見たものがそのまま利用できます。これにより、トレーダーは自信を持ってエントリーおよびエグジットを行うための信頼性と一貫性のある根拠を得ることができます。 主な特徴: ガン・スクエア・オブ・ナインとガン理論に基づいて構築 100%非リペイントのシグナルシステム すべての時間枠(M1、M5、H1、H4、日足、週足)で機能 FXおよびバイナリーオプション取引
PairMaster Buy Sell Arrow Indicator for MT4 Trade Reversals Like a Pro — Catch Every Swing Point with Precision The PairMaster Buy Sell Arrow Indicator is a powerful MetaTrader 4 tool built to identify high-probability swing trading opportunities . Designed for traders who value accuracy, clarity, and simplicity, PairMaster detects key market turning points and plots intuitive buy and sell arrows directly on your chart. Key Features Accurate Swing Point Detection – Automatically identifies ma
Meravith
Ivan Stefanov
5 (3)
マーケットメーカーのためのツール。 Meravith は次の機能を提供します: すべての時間足を分析し、現在有効なトレンドを表示します。 強気と弱気の出来高が等しくなる流動性ゾーン(出来高均衡)を強調表示します。 異なる時間足のすべての流動性レベルをチャート上に直接表示します。 テキスト形式の市場分析を生成し、参考情報として表示します。 現在のトレンドに基づいて目標値、サポートレベル、ストップロスを計算します。 取引のリスクリワード比を算出します。 口座残高に基づいてポジションサイズを計算し、潜在的な利益を推定します。 また、市場に大きな変化があった場合には警告を表示します。 インジケーターの主要ライン: 強気/弱気の出来高エグゾーストライン ― 目標値として機能します。 市場のトレンドを示すライン。市場が強気か弱気かによって色が変わり、トレンドのサポートとして機能します。主にその色が市場センチメントを示します。 出来高均衡ライン(Eq)。Eq(Volume Equilibrium)ラインはシステムの中核です。これは買い手と売り手の出来高のバランスポイントを表します。市場の流動性を示し
"Dragon's Tail" is an integrated trading system, not just an indicator. This system analyzes each candle on a minute-by-minute basis, which is particularly effective in high market volatility conditions. The "Dragon's Tail" system identifies key market moments referred to as "bull and bear battles". Based on these "battles", the system gives trade direction recommendations. In the case of an arrow appearing on the chart, this signals the possibility of opening two trades in the indicated directi
「 Dynamic Scalper System 」インジケーターは、トレンド波の中でスキャルピング取引を行う手法のために設計されています。 主要通貨ペアと金でテスト済みで、他の取引商品との互換性があります。 トレンドに沿った短期的なポジションオープンのシグナルを提供し、追加の価格変動サポートも提供します。 インジケーターの原理 大きな矢印はトレンドの方向を決定します。 トレンド波の中では、小さな矢印の形でスキャルピングシグナルを生成するアルゴリズムが機能します。 赤い矢印は強気方向、青い矢印は弱気方向です。 トレンドの方向には敏感な価格変動ラインが描かれ、小さな矢印のシグナルと連動します。 シグナルは次のように機能します。適切なタイミングでラインが現れるとエントリーシグナルが形成され、ラインが開いている間はポジションが保持され、完了すると取引が終了します。 推奨される動作時間枠はM1~H4です。 矢印は現在のローソク足に形成され、次のローソク足が開いている場合は、前のローソク足の矢印は再描画されません。 入力パラメータ Trend Wave Period - トレンド方向
IQ FX Gann Levels a precision trading indicator based on W.D. Gann’s square root methods . It plots real-time, non-repainting support and resistance levels to help traders confidently spot intraday and scalping opportunities with high accuracy. William Delbert Gann (W.D. Gann) was an exceptional market analyst, whose trading technique was based on a complex blend of mathematics, geometry, astrology, and ancient mathematics which proved to be extremely accurate. Setup & Guide:  Download  MT5 Ver
Introducing a powerful, precision-engineered indicator that seamlessly combines Pivot Points, Moving Averages, and Multi-Timeframe Analysis to deliver high-probability Buy and Sell signals in real-time. This tool is your strategic edge, designed to identify trend reversals, market momentum, and optimal trade entries, no matter your preferred trading style. Our algorithm goes beyond standard indicators—by analyzing multiple timeframes simultaneously, it spots true market turning points while fi
Pulse Scalping Line - an indicator for identifying potential pivot points. Based on this indicator, you can build an effective Martingale system. According to our statistics, the indicator gives a maximum of 4 erroneous pivot points in a series. On average, these are 2 pivot points. That is, the indicator shows a reversal, it is erroneous. This means that the second signal of the indicator will be highly accurate. Based on this information, you can build a trading system based on the Martingale
ゴールドラッシュ・トレンド・アロー・シグナル ゴールドラッシュ・トレンド・アロー・シグナル 指標は、XAU/USDにおける高速・短期スキャルパー向けに最適化された、正確でリアルタイムのトレンド分析を提供します。 1分足専用に設計されたこのツールは、明確なエントリーポイントを示す方向矢印を表示し、スキャルパーが変動の激しい市場状況でも自信を持って取引できるよう支援します。 この指標は、PRIMARY(主要)とSECONDARY(補助)のアラート矢印で構成されています。PRIMARYシグナルは、トレンドの方向転換を示す白と黒の方向矢印であり、SECONDARYシグナルは、PRIMARY矢印が示す方向を確認し、潜在的なエントリーポイントを示す青と赤の矢印です。 注意:トレンド方向の変化後にPRIMARYアラート矢印が1つだけ表示される場合、複数のSECONDARY青/赤矢印が表示される点に注意が必要です。SECONDARYシグナルは、シグナル基準を満たす任意のローソク足後に表示されます。したがって、長期的なトレンド移動の場合、画面に多くのSECONDARY矢印が表示されます(添付の
Product Name:   Quantum Regime Indicator Short Description:   A multi-engine structural regime and volatility filter. Description: Quantum Regime Indicator (QRI) is a sophisticated technical analysis algorithm designed to identify market structure shifts and volatility regimes. Unlike standard indicators that rely on immediate price action, QRI utilizes a hierarchical logic architecture to filter market noise and identify statistical extremes. The indicator is built on the philosophy of "Market
F-16 Plane Indicatorをご紹介します。これは、取引体験を革新するために設計された最先端のMT4ツールです。F-16戦闘機の無類のスピードと精度に触発され、このインジケーターは高度なアルゴリズムと最新技術を組み合わせ、金融市場で比類のないパフォーマンスを提供します。 F-16 Plane Indicatorを使用すると、リアルタイムの分析と高精度な取引シグナルの生成が可能で、競争相手を圧倒します。ダイナミックな機能により、さまざまな資産クラスで利益を見つけることができ、自信を持って的確な決定を行うことができます。 使いやすいインターフェースを備えたF-16 Plane Indicatorは、人気のあるMetaTrader 4プラットフォームとシームレスに統合され、スムーズで効率的な取引プロセスを実現します。初心者のトレーダーでも経験豊富なプロフェッショナルでも、このインジケーターは独自の取引スタイルと好みに合わせて簡単にカスタマイズすることができます。 F-16 Plane Indicatorのパワーを体感し、市場のトレンドを精密かつ敏捷にナビゲートします。高度なチャー
ECM Elite Channel is a volatility-based indicator, developed with a specific time algorithm, which consists of finding possible corrections in the market. This indicator shows two outer lines, an inner line (retracement line) and an arrow sign, where the channel theory is to help identify overbought and oversold conditions in the market. The market price will generally fall between the boundaries of the channel. If prices touch or move outside the channel, it's a trading opportunity. The ind
OrderFlow Absorption – MT4用プロフェッショナル・デルタ&アブソープションシグナルインジケーター OrderFlow Absorptionで本物のオーダーフロー分析の力を解き放ちましょう。MetaTrader 4向けの究極のデルタヒストグラム&アブソープションシグナルインジケーターです。あらゆる価格変動の裏側で何が起きているのかを知りたいトレーダーのために設計されており、市場を動かす隠れた買い/売り圧力や吸収イベントを明らかにします。 特徴 デルタヒストグラムの可視化:   買い圧力・売り圧力を色分けされたヒストグラムで即座に表示。 アブソープションシグナル検出:   高度なロジックで強気・弱気の吸収イベントを特定し、反転の兆しを早期に通知。 チャートマーカー:   吸収シグナルをチャート上に直接マークし、視覚的に分かりやすく表示。 ポップアップアラート:   新しい吸収シグナルが出現した際にリアルタイムで通知。 カスタマイズ可能な閾値:   弱いシグナルを除外し、高確率のセットアップに集中。 リソース管理:   大きなチャートでも高速に動作する効率的な計算。
Rtc ML Ai | Predictor CORE MACHINE LEARNING ENGINE Adaptive ML Market Predictor – Multi-Bar Trend & Candle Forecast What This Indicator Does This indicator is a  real-time market prediction engine  designed to analyze price behavior and estimate  future market tendencies . Unlike conventional indicators, this system  does not rely on static parameters or historical curve-fitting , but adapts its internal state dynamically during live market operation. Instead of using static rules, the indic
The Nihilist 5.0 Indicator includes Forexalien and Nihilist Easy Trend trading strategies and systems. It is composed of an MTF Dashboard where you can analyze the different input possibilities of each strategy at a glance. It has an alert system with different types of configurable filters. You can also configure which TF you want to be notified on your Metatrader 4 platform and Mobile application The indicator has the option to view how could be a TP and SL by using ATR or fixed points, even w
ZeusArrow Smart Liquidity Finder  Smart Liquidity Finder is Ai controlled indicator based on the Idea of Your SL is My Entry. It scan and draws the major Liquidity areas on chart partitioning them with Premium and Discount Zone and allows you find the best possible trading setups and help you decide the perfect entry price to avoid getting your Stop Loss hunted . Now no more confusion about when to enter and where to enter. Benefit from this one of it's kind trading tool powered by Ai an trade
This indicator depends on some secrets equations to draw Signals with Stop loss and maximum 4 Take profits. There is a free EA depends on this indicator as a gift when you purchase/rent it. Features Simply it gives you entry point as Ready sign (Buy / Sell) and arrow (Buy / Sell) after candle closed, also SL line and 4 TP lines or less. Once SL-TP lines are shown with the arrow, they remains as they are until signal change. It is historical indicator. No Repaint. user manual for V5 please click
Algo Trading Indicaor  With this indicator , you’ll have zones and trends that hight probability the price will reverse from it. so will gives you all the help that you need  Why should you join us !?  1-This indicator is logical since it’s working in previous days movement , to predict the future movements. 2-Algo trading indicator will help you to draw trends which is special and are too strong than the basics trend , trends will change with the frame time that you work on . 3-We can use
作者からのメッセージ 私は 7年以上 外国為替市場で取引を行っており、 専業トレーダー として活動しています。 長年のトレード経験を通じて、私が強く実感したのは、 取引における最大の課題は戦略そのものではなく、正しい通貨ペアを選ぶこと だという点です。 どれほど完成度の高い戦略であっても、間違った市場や通貨ペアに適用すれば、その効果は大きく低下します。 一方で、適切な通貨ペアを選択できれば、多くの戦略は自然と本来のパフォーマンスを発揮します。 この考えに基づいて開発したのが Currency Strength Index – Advanced Version です。 私の経験では、 通貨の強弱はトレンド取引の基盤 です。 完全な日足サイクル( 1440分 )の中で、市場の注目が最も強い通貨と最も弱い通貨に集中した場合、その強弱の偏りはすぐには解消されず、継続する傾向があります。 多くのトレンド戦略が機能する理由は、エントリーロジックだけではなく、 すでに市場を支配している資金の流れに沿って取引しているから です。 このインジケーターは、そうした 支配的な資金フローを客観的に特定す
Scalping signals M1 を購入した方全員に、 本インジケーターのシグナルに基づいて自動売買を行う EAロボットを無料プレゼント します。 Scalping signals M1 — M1向けトレンドスキャルピング完全エントリーシステム Scalping signals M1 は、チャートをわかりやすい行動マップに変えるインジケーターです。 カラートレンドチャネルが市場の方向を示し、矢印がエントリーポイントを知らせます。 チャネルの方向と矢印に従うだけでよく、初心者でも簡単に扱えます。 インジケーターは特に M1 で優れた性能を発揮し、 XAUUSD(ゴールド)、ポンド、ドルの主要通貨ペア、クロスなど、ほぼすべての通貨ペアに対応しています。 アラートとメール通知を搭載しているため、シグナルを見逃しません。 基本コンセプト Scalping signals M1 は使いやすい外観とは対照的に、内部では高度なアルゴリズムが動作しています。 視覚的に表示されるのは以下の2つだけです。 – トレンド方向を示すチャネル – トレンド継続が期待される位置での Buy/Sell 矢印
[Trend Line Pro 3]  Trend Line Pro 3 is a discretionary analysis indicator that visualizes swing structure based on Dow Theory / ZigZag concepts and organizes key lines (support/resistance and trendlines) as well as potential break/structure-change points (BreakEdge) directly on the chart. * This product is NOT an EA. It does not place trades or send orders. It helps you organize market structure with the same rules and align your decision criteria more consistently.
Bomb Bank Signal
Igor Pereira Calil
5 (1)
Bomb Bank シグナル: MetaTrader 4 の信頼度インジケーター Bomb Bank Signal は、金融市場で最も関連性の高いトレンドを特定するように設計された MetaTrader 4 の強力なインジケーターです。動きを正確に予測するツールをお探しなら、Bomb Bank が最適です。 仕組み: このインジケーターは、出来高分析、ローソク足終値、対称トレンドという 3 つの異なる方法を組み合わせて、売買の機会を検出してシグナルを送ります。 Bomb Bank は、買いの機会を特定するときは「爆弾」のようなものであり、売りシグナルを検出するときは「ドクロ」のようなものです。 ボムバンクはなぜ違うのですか? 完全な信頼性: Bomb Bank Signal は信号を削除しません。一度シグナルが発せられると、シグナルは残り続けるので、チャンスを逃すことはありません。 極めて高い精度: Bomb Bank は誤った信号を送信しません。リアルタイムで最新情報を更新し、市場の進化に合わせて調整しながら、以前のシグナルの透明性を維持します。 ライブアップデート: シ
BinaryIndicator is a highly accurate indicator for trading binary options. It shows excellent results in scalping. This indicator is based in multifactor analysis of trend indicators, as well as confirmation oscillators, which in the end gives an increased accuracy of signals. Advantages of the indicator Increased accuracy of signals. Excellent results when trading binary options with a short expiration time from M30 to M1 . It works on any timeframes. Works with any trade symbols. Parameters
Gold Channel is a volatility-based indicator, developed with a specific timing algorithm for the XAUUSD pair, which consists of finding possible corrections in the market. This indicator shows two outer lines, an inner line (retracement line) and an arrow sign, where the theory of the channel is to help identify overbought and oversold conditions in the market. The market price will generally fall between the boundaries of the channel. If prices touch or move outside the channel it is a tradi
The BB Reversal Arrows technical trading system has been developed to predict reverse points for making retail decisions. The current market situation is analyzed by the indicator and structured for several criteria: the expectation of reversal moments, potential turning points, purchase and sale signals. The indicator does not contain excess information, has a visual understandable interface, allowing traders to make reasonable decisions. All arrows appear to close the candle, without redrawin
作者のその他のプロダクト
Presenting UMS Scanner – Your Ultimate Edge in the MT4 Marketplace!  Unlock the secrets of the market with the ground-breaking UMS Scanner (Universal Market Strategy) – a revolutionary tool designed to empower traders like you. Say goodbye to overwhelming market noise and hello to precision, insight, and unparalleled trading confidence. Cut Through the Clutter: In today’s fast-paced trading world, deciphering valuable signals from market noise is the key to success. The UMS Scanner’s cutting-ed
フィルタ:
レビューなし
レビューに返信