Trend Scan
- インディケータ
- バージョン: 1.0
- アクティベーション: 5

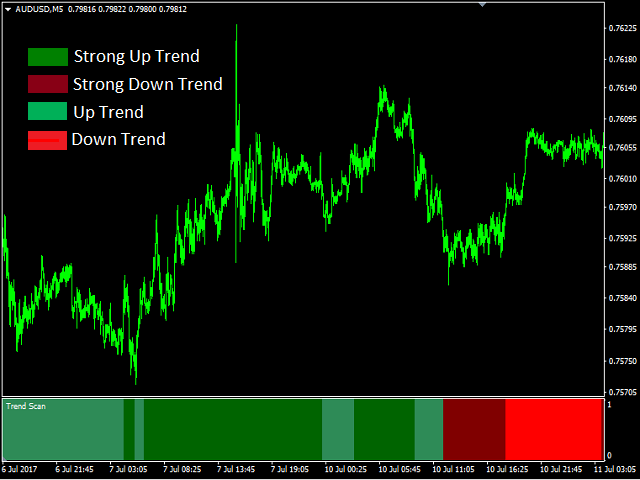
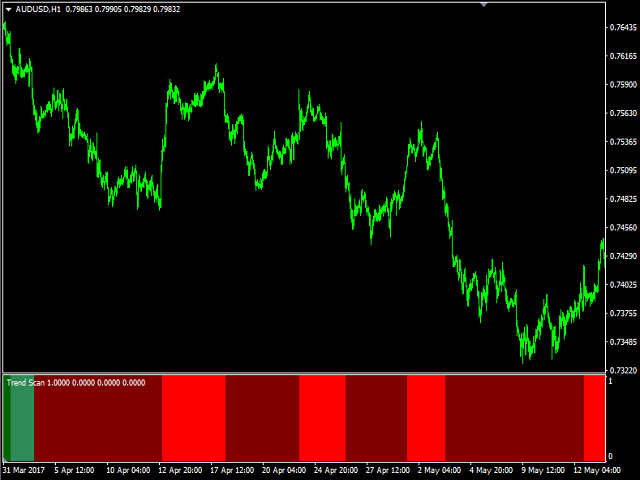
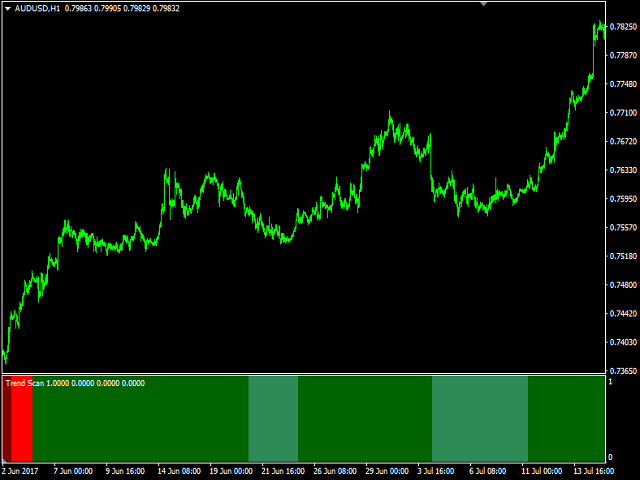
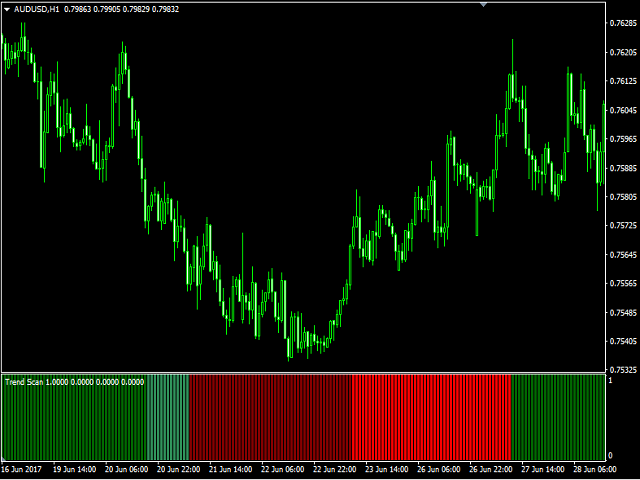
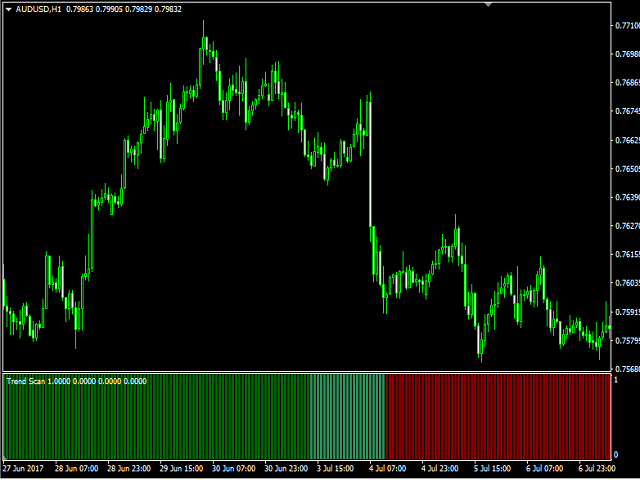
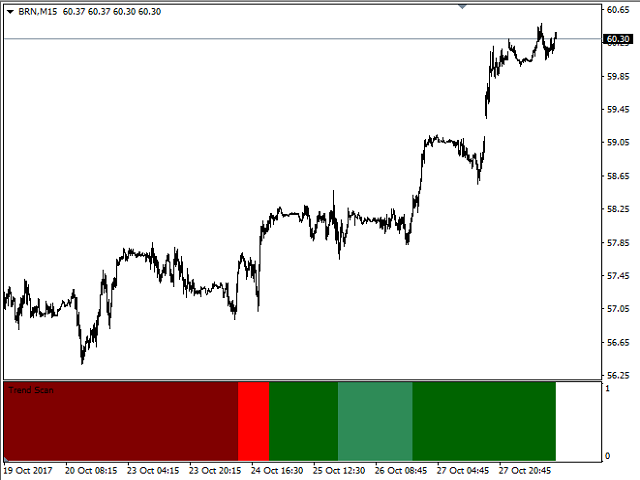
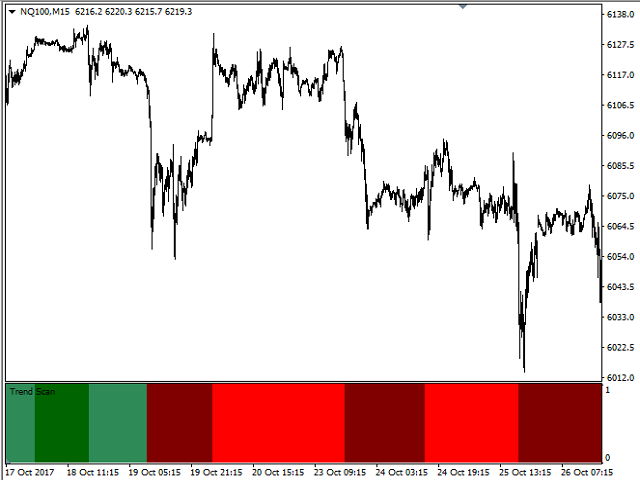
Determining the current trend is one of the most important tasks for a trader regardless of their trading style. Trend Scan is able to define a trend with a fairly high accuracy.
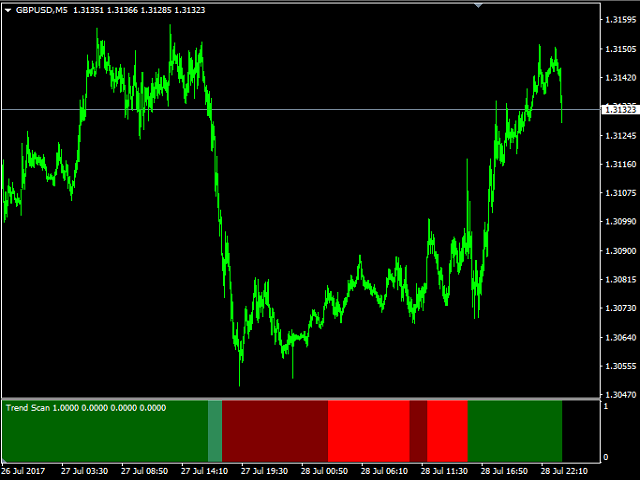
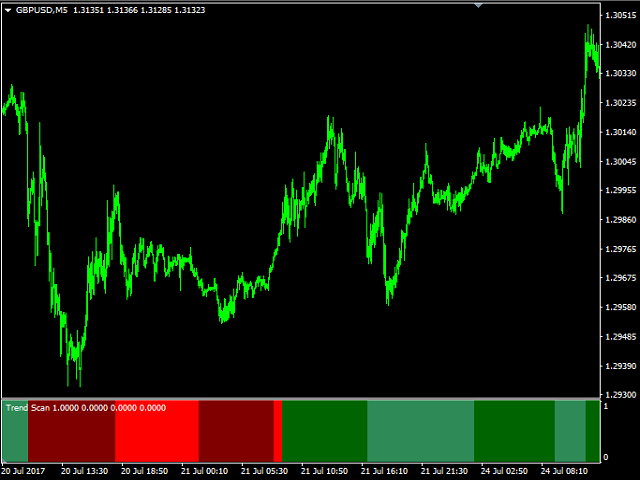
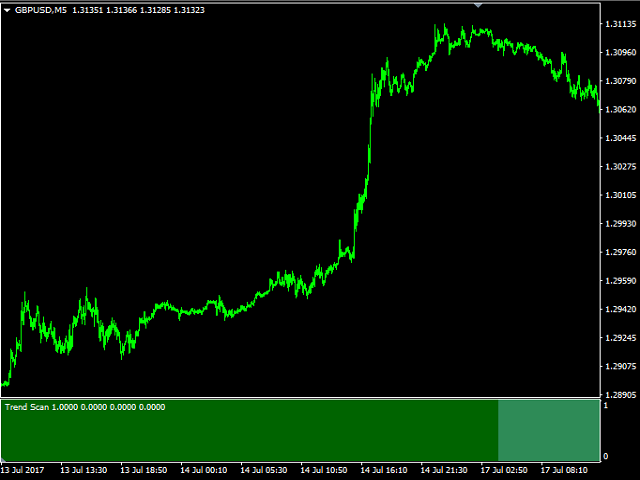
The indicator applies the proprietary method in its calculations. Trend Scan is suitable for any currency pair and timeframe. It does not change its readings. The indicator takes into account the volume and volatility readings, combines them and displays the result as a histogram. The color of the histogram can be configured to reflect the importance of the signal: a strong uptrend, an uptrend, a strong downtrend, a downtrend.
Indicator parameters
Main Settings:
- VolMode - whether to use real volumes in calculation.
- GlobalPeriod - global period for calculations.
- LocalPeriod - local period for calculations.
- SignalLevel - signal level. If VolMode = false, the values of the variable will not exceed 1. Otherwise, there is no limit for value increase.
- HistoryBars - number of bars for display.
Alert Settings:
- Alerts - if true, alert is enabled.
- AMessage - display a dialog window.
- ASound - generate a sound alert.
- AEmail - send an email at the address specified in the Email tab of the options window.
- ANotificaton - send notification to mobile terminals.
- soundfile - the name of the audio file.