Candlestick Patterns Custom
- インディケータ
- バージョン: 1.1
- アップデート済み: 30 11月 2021
- アクティベーション: 20

Candlestick Patterns Custom is the lite version of the Candlestick Patterns Analytics indicator, intended for use as a conventional arrow indicator and in expert advisors.
The considerable advantages of the indicator
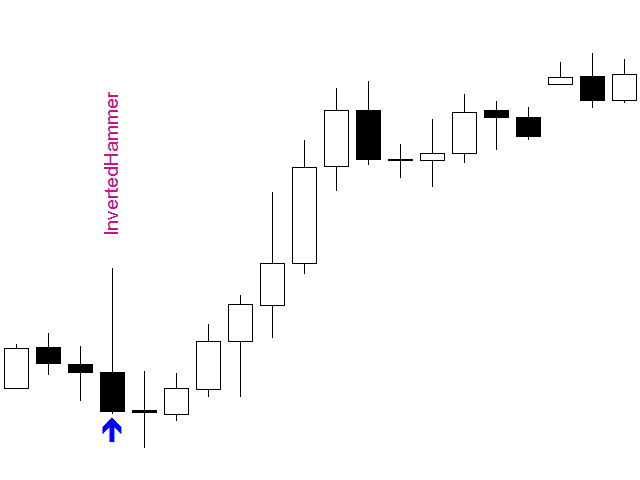
- It finds and marks 29 candlestick patterns (43 variants of signal patterns) on the chart;
- It allows the user to configure the signal of each pattern in accordance with the analysis results of the Candlestick Patterns Analytics indicator;
- The indicator can also be used as an arrow indicator in expert advisors.
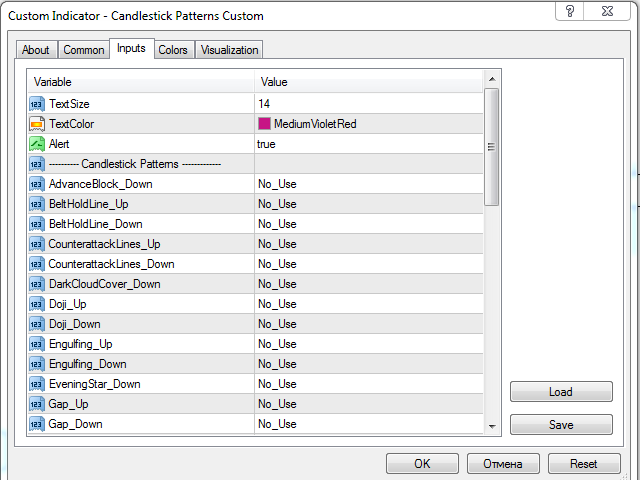
Description of Input Parameters
Each candlestick pattern has a drop-down menu with the options:
- No_Use - do not use the pattern;
- Buy_Signal - use the pattern as a buy signal;
- Sell_Signal - use the pattern as a sell signal.
The indicator settings:
- TextSize - size of the text on the chart;
- TextColor - color of the text on the chart;
- Alert - enable/disable alerts;
- ---------- Candlestick Patterns ------------- - separator;
- AdvanceBlock_Down - candlestick pattern;
- BeltHoldLine_Up - candlestick pattern;
- BeltHoldLine_Down - candlestick pattern;
- CounterattackLines_Up - candlestick pattern;
- CounterattackLines_Down - candlestick pattern;
- DarkCloudCover_Down - candlestick pattern;
- Doji_Up - candlestick pattern;
- Doji_Down - candlestick pattern;
- Engulfing_Up - candlestick pattern;
- Engulfing_Down - candlestick pattern;
- EveningStar_Down - candlestick pattern;
- Gap_Up - candlestick pattern;
- Gap_Down - candlestick pattern;
- GravestoneDoji_Down - candlestick pattern;
- Hammer_Up - candlestick pattern;
- HangingMan_Dowm - candlestick pattern;
- Harami_Up - candlestick pattern;
- Harami_Down - candlestick pattern;
- InvertedHammer_Up - candlestick pattern;
- LongLeggedDoji_Up - candlestick pattern;
- LongLeggedDoji_Down - candlestick pattern;
- MatHoldPattern_Up - candlestick pattern;
- MorningStar_Up - candlestick pattern;
- OnNeckLine_Up - candlestick pattern;
- OnNeckLine_Down - candlestick pattern;
- Piercing_Up - candlestick pattern;
- SeparatingLines_Up - candlestick pattern;
- SeparatingLines_Down - candlestick pattern;
- ShootingStar_Down - candlestick pattern;
- SideBySideWhite_Up - candlestick pattern;
- SideBySideWhite_Down - candlestick pattern;
- StalledPattern_Down - candlestick pattern;
- TasukiGap_Up - candlestick pattern;
- TasukiGap_Down - candlestick pattern;
- ThreeCrows_Down - candlestick pattern;
- ThreeLineStrike_Up - candlestick pattern;
- ThreeLineStrike_Down - candlestick pattern;
- ThreeMethods_Up - candlestick pattern;
- ThreeMethods_Down - candlestick pattern;
- ThreeWhiteSoldiers_Up - candlestick pattern;
- Tweezer_Up - candlestick pattern;
- Tweezer_Down - candlestick pattern;
- UpsideGapTwoCrows_Down - candlestick pattern;
How to Use the Indicator
The indicator allows to use the signals of the Candlestick Patterns Analytics indicator without the volumetric calculations and, respectively, without loading the terminal.
The indicator is configured according to the results from the report of the Candlestick Patterns Analytics indicator.
For example, a certain candlestick pattern for the selected pair and timeframe gives a positive result when buying. Therefore, select the "Buy_Signal" option in the drop-down menu of this pattern. Thus, you can configure any number of patterns.
I can help you with setting up the indicators, applying and analyzing them.