Candlestick Patterns MT5
- インディケータ
- バージョン: 1.1
- アクティベーション: 20

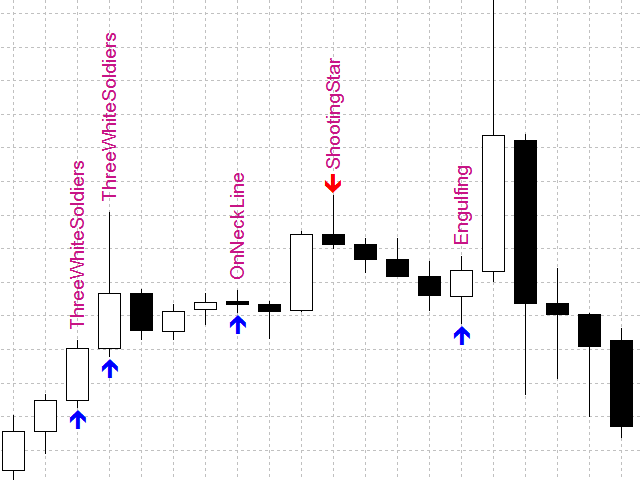
Candlestick Patterns MT5 is a simple and convenient indicator able to define 29 candle patterns.
Advantages
- Defines and highlights 29 candle patterns;
- Estimated trading direction is shown as an arrow;
- Each candlestick pattern can be disabled in the settings;
- The indicator can be used as an arrow indicator in EAs.
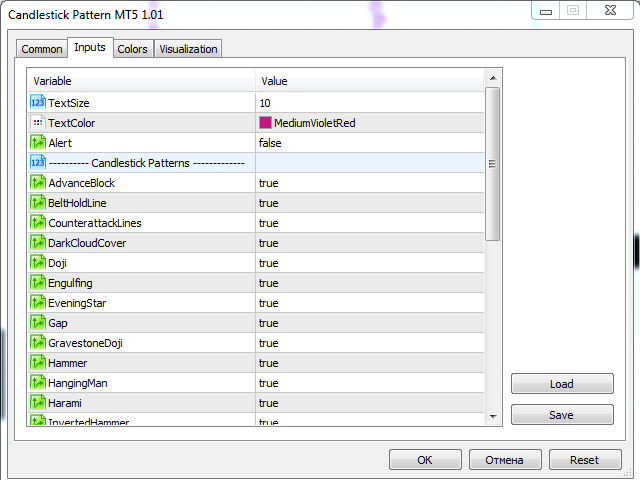
Parameters
- TextSize - chart text size;
- TextColor - chart text color;
- Alert - enable/disable alerts;
- ---------- Candlestick Patterns ------------- - settings separator;
- AdvanceBlock;
- BeltHoldLine;
- CounterattackLines;
- DarkCloudCover;
- Doji;
- Engulfing;
- EveningStar;
- Gap;
- GravestoneDoji;
- Hammer;
- HangingMan;
- Harami;
- InvertedHammer;
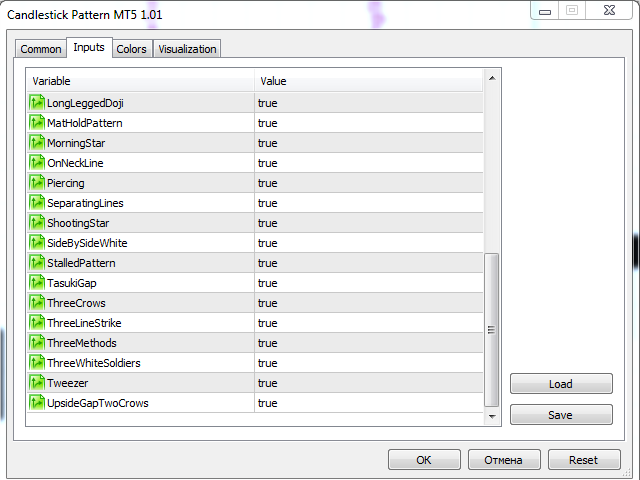
- LongLeggedDoji;
- MatHoldPattern;
- MorningStar;
- OnNeckLine;
- Piercing;
- SeparatingLines;
- ShootingStar;
- SideBySideWhite;
- StalledPattern;
- TasukiGap;
- ThreeCrows;
- ThreeLineStrike;
- ThreeMethods;
- ThreeWhiteSoldiers;
- Tweezer;
- UpsideGapTwoCrows.