MultiCurrency Indicators
- インディケータ
- バージョン: 1.1
- アップデート済み: 30 11月 2021
- アクティベーション: 20

MultiCurrency Indicators is a multi-currency indicator which calculates the values of multiple standard indicators for each of the 8 major currencies: EUR, GBP, AUD, NZD, USD, CAD, CHF, JPY.
Advantages of the indicator
- Calculation is performed for 8 virtual charts of the currencies: EUR, GBP, AUD, NZD, USD, CAD, CHF, JPY;
- Show the currency strength, which does not depend on the currency pair;
- It allows determining the strongest and the weakest currencies at any moment, it also sorts currencies by strength;
- It displays the strongest/weakest currency pair at any moment;
- It provides interactive buttons for quick navigation to the chart of the strongest/weakest currency pair;
- The standard line colors and selected for a comfortable operation with the black and white styles of the chart;
- Despite the extensive calculations, it does not load the terminal.
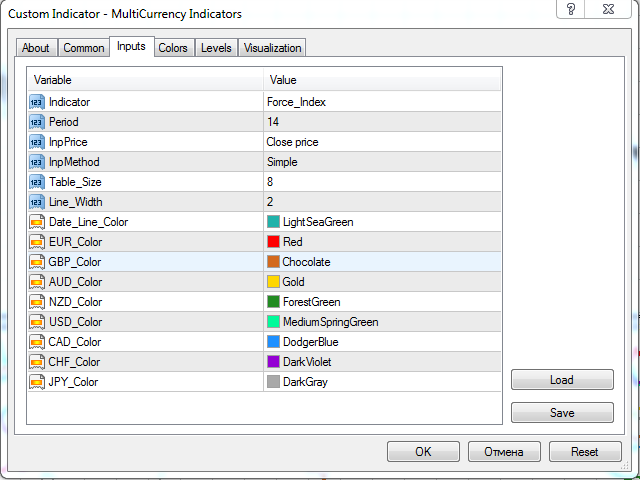
Description of Input Parameters
- Indicator - indicator for calculations;
- Period - period (ignored if a standard indicator does not have a period);
- InpPrice - price (ignored if a standard indicator does not have a price);
- InpMethod - method (ignored if a standard indicator does not have a method);
- Table_Size - size of the table in the indicator window;
- Line_Width - width of the indicator lines, as well as the date line width;
- Date_Line_Color - color of the dale line;
- EUR_Color - color of the EUR line;
- GBP_Color - color of the GBP line;
- AUD_Color - color of the AUD line;
- NZD_Color - color of the NZD line;
- USD_Color - color of the USD line;
- CAD_Color - color of the CA line;
- CHF_Color - color of the CHF line;
- JPY_Color - color of the JPY line;
Description
The indicator has 8 lines of the selected indicator, 2 columns and date line.
The lines correspond to the values of the standard indicator calculated on the virtual charts of the EUR, GBP, AUD, NZD, USD, CAD, CHF, JPY currencies.
The Force Index values in the columns are sorted in descending order from top to bottom, that is, the order of the currencies corresponds to the order of the lines on the chart. Also, the appropriate value of the Force Index on the chart is indicated in the column next to each currency.
The strongest/weakest currency is displayed at the top of each column, as well as the value of the standard indicator for that pair. Clicking the currency pair button changes the current chart to the chart of the corresponding currency pair. The right column corresponds to the current time, the left column corresponds to the time of the date line.
The date line allows viewing the indicator values easily at any moment with by simply dragging the line.
How to Use the Indicator
The indicator is widely used in strategies the use the standard indicators. It allows analyzing the market in greater depth, developing new trading strategies, as well as testing and using the existing ones more successfully.
It belongs to the group of standard multi-currency indicators.
If you have questions or suggestions, feel free to contact me.