Session Flow Map MT5

SessionFlowMap — POCレベル付きマルチセッション出来高・デルタプロファイル

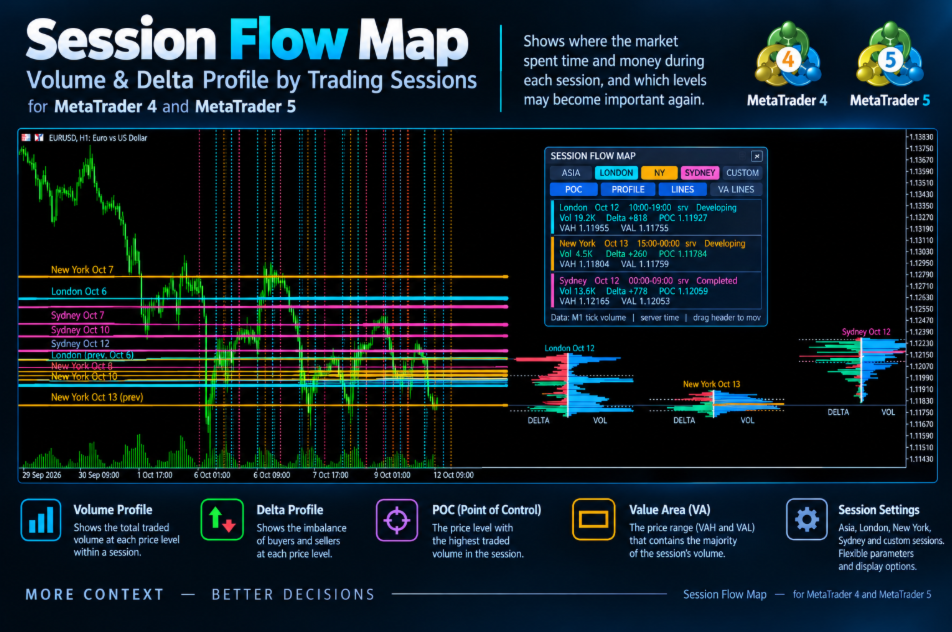
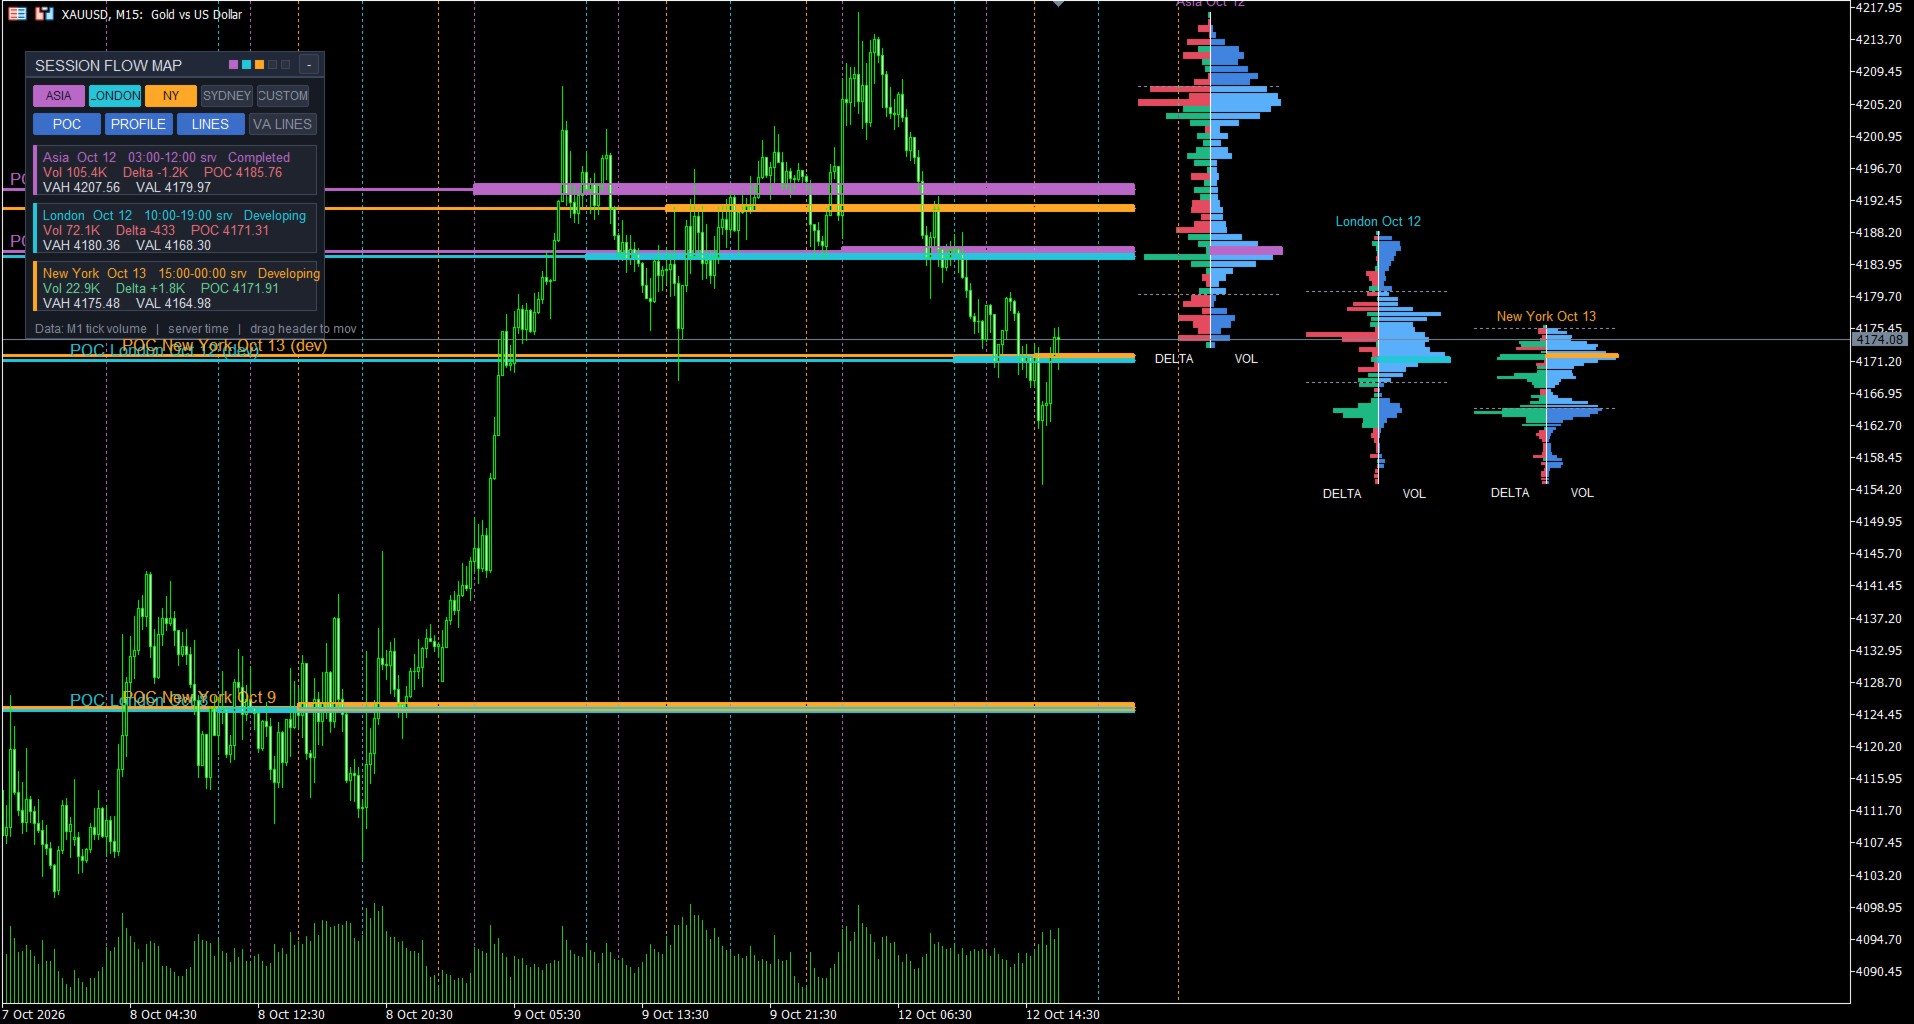
SessionFlowMap は、FXの取引日を構成する各セッション(アジア、ロンドン、ニューヨーク。必要に応じてシドニーと任意のカスタムセッション)について、出来高プロファイルとデルタプロファイル(買いと売りの偏り)を作成し、チャート上に表示します。各セッションで POC(Point of Control:最も多く取引された価格)と Value Area(VAH と VAL:出来高の大部分が集中した範囲)を算出し、それらのレベルを水平線として右へ延長します。各セッションで市場がどこに時間と資金を費やしたか、そしてどのレベルが再び意識されそうかが一目で分かります。

MT4-version: https://www.mql5.com/en/market/product/200941

動作の仕組み

  • 各セッションは、それぞれの時間帯に従って M1 履歴から切り出されます。アジア、ロンドン、ニューヨーク、シドニーの時間は GMT で設定し、ブローカーのサーバー時間へ自動変換されます。カスタムセッションはサーバー時間でそのまま指定します。
  • セッションの価格レンジは価格行に分割され(目標行数は設定可能)、出来高が各行に配分されます。FXには集中型の出来高がないため、ティックボリュームを使用します。
  • 出来高プロファイルは各行の合計出来高です。デルタプロファイルは各行の買い出来高から売り出来高を引いた値です(緑は買い優勢、赤は売り優勢)。
  • 「M1 bars」モードでは、各ローソク足の終値がその値幅の中のどこにあるかから買い・売りの比率を推定します。「Real ticks」モードでは、各ティックの方向(ブローカーが提供する場合は BUY/SELL フラグ)から算出します。
  • POC は出来高が最大の行です。Value Area は POC から広がり、設定した割合(既定は70%)の出来高を含むまで拡大して、VAH と VAL を決定します。
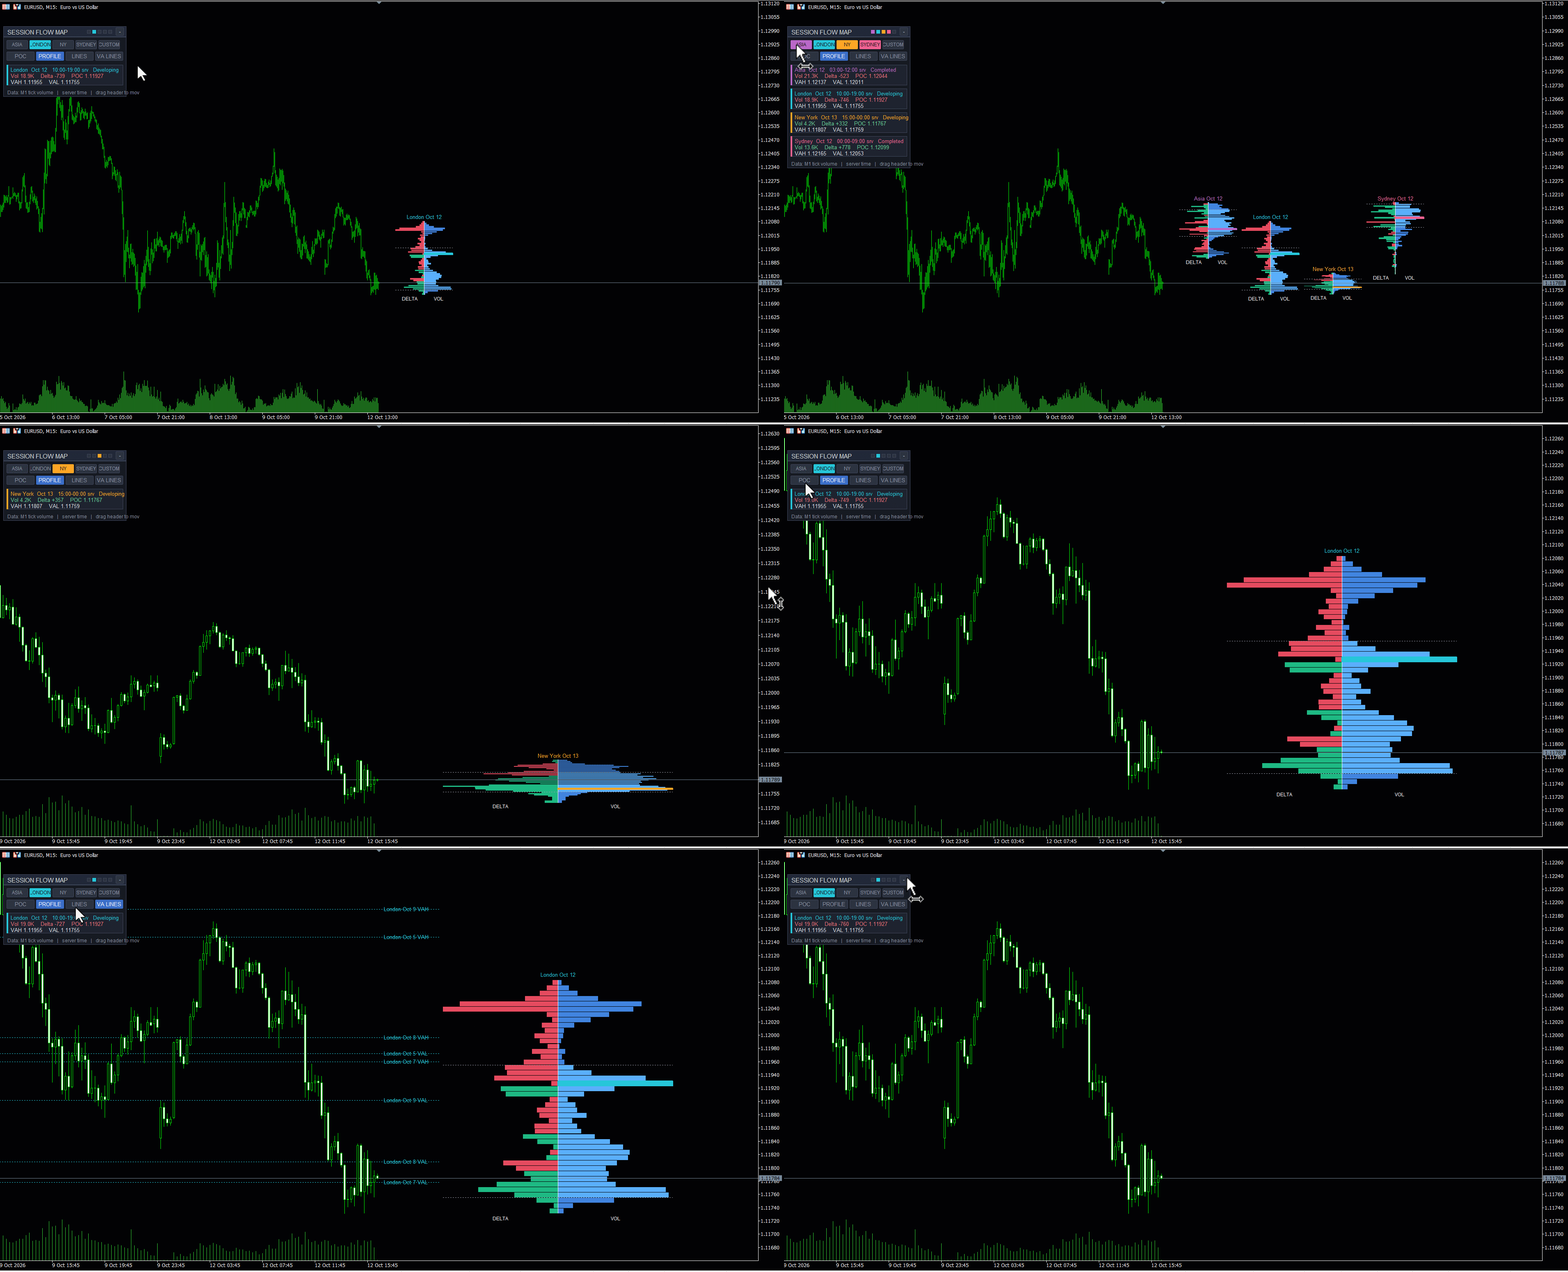
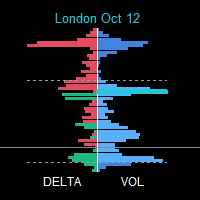
  • 各セッションの最新プロファイルは、最後のローソク足の右側にクラスターとして描画されるか(出来高とデルタが分割線を挟んで背中合わせ)、チャート上のセッション内に描画されます。POC はゾーンやラインで表示され、チャート全体を横切る長いラインの左上にラベルが付きます。過去セッションの POC は基準レベルとしてチャートに残ります。
  • 縦線が各セッションの開始と終了を示します。セッションごとに色が異なります。

トレーダーの活用方法

  • 前セッションの POC を、サポートやレジスタンス、また価格を引き寄せる「磁石」として使い、レベルへの再接近時の反応を観察します。
  • ネイキッド POC(naked POC)モード:価格がまだ戻っていないレベルは延長され、最初に触れた時点でラインが止まります。
  • VAH と VAL を「適正価値」の境界として見ます。範囲内での受け入れ、範囲外での拒否、Value Area からのブレイクアウトなどです。
  • デルタプロファイルは、どの価格帯で買い手または売り手が優勢だったかを示します。POC 付近のデルタを隣接する行と比較します。
  • セッションの文脈:アジアのレンジ、ロンドンとニューヨークの POC がそれに対してどこにあるか、ロンドンとニューヨークの重なりなど。
  • コンフルエンス:異なるセッションや日付の POC が近い位置にあれば、より重要なゾーンになります。
  • アラートは、価格が延長されたレベルに戻ったときに知らせます。
  • どの銘柄・時間足でも動作します(プロファイルは M1 から作成)。M5〜H1 での利用が一般的です。

パネルとボタン

  • パネルはヘッダーをドラッグして移動でき、「-」ボタンで折りたためます。ヘッダーの色付きの点は有効なセッションを示します。
  • ASIA、LONDON、NY、SYDNEY、CUSTOM ボタンで、チャート上で直接セッションのオン・オフを切り替えられます。
  • POC、PROFILE、LINES、VA LINES ボタンでレイヤー(POC レベル、プロファイル、セッションの縦線、延長された VAH/VAL)を切り替えます。
  • セッションごとにカードが表示されます:名称、日付、サーバー時間での時間帯、状態(Completed=終了、Developing=形成中)、出来高、デルタ、POC、VAH、VAL。最下行にはデータソースが表示されます。
  • パネルの位置、折りたたみ状態、ボタンの状態はチャートごとに個別に記憶されます。

必要条件

必要な期間の M1 履歴が読み込まれている必要があります。チャートのシフト(Chart shift)を有効にし、プロファイルのクラスター用に右側に余白を確保してください。

設定項目

1. Sessions

  • 「Show Asian session」 — アジアセッションを有効にします(パネルの ASIA ボタンと同じ働きです)。
  • 「Asian session hours (GMT, HH:MM-HH:MM)」 — アジアセッションの開始と終了(GMT)。既定は 00:00-09:00。日をまたぐセッションにも対応します。
  • 「Show London session」 / 「London session hours (GMT, HH:MM-HH:MM)」 — ロンドンセッション。既定は 07:00-16:00。
  • 「Show New York session」 / 「New York session hours (GMT, HH:MM-HH:MM)」 — ニューヨークセッション。既定は 12:00-21:00。
  • 「Show Sydney session」 / 「Sydney session hours (GMT, HH:MM-HH:MM)」 — シドニーセッション。既定はオフ、時間は 21:00-06:00。
  • 「Show custom session (broker day by default)」 / 「Custom session hours (SERVER time, HH:MM-HH:MM)」 — サーバー時間で指定する独自のセッション。既定の 00:00-24:00 はブローカーの1日全体です。
  • 「Auto-detect broker GMT offset」 — サーバーの GMT に対するオフセットを、ブローカーの夏時間切り替えを含めて自動検出します。
  • 「Manual broker GMT offset, hours (if auto is off)」 — 自動検出がオフのときに使う、時間単位の固定オフセット。
  • 「Skip sessions starting on Saturday/Sunday」 — 週末に始まるセッションをスキップします。 ヒント:ロンドンとニューヨークの時間は GMT で設定されています。これらの市場が夏時間に切り替わるときは、時間を1時間ずらしてください。

2. Data

  • 「Data source」 — 「M1 bars (tick volume, fast)」:1分足から高速に計算。「Real ticks (precise, slower)」:ティックから正確に計算(やや低速)。
  • 「Refresh interval (seconds)」 — 現在のセッションを再計算・再描画する間隔。新しいローソク足が出ると直ちに再計算されます。

3. Volume and delta profiles

  • 「Show volume profile」 — 出来高プロファイルを表示します。
  • 「Show delta profile」 — デルタプロファイルを表示します。
  • 「Volume profile side (delta is opposite)」 — 出来高を分割線のどちら側に描くか。デルタは反対側に描かれます。
  • 「Target price rows per session (10-70)」 — プロファイルの細かさ。オブジェクトが多すぎる場合、描画時のみ行がまとめられ、POC と Value Area は正確なままです。
  • 「Profile placement」 — 「Shared divider at right」:全セッションの最新プロファイルを最後のローソク足の右側に並べます。「Session edges」:セッションの時間範囲内にプロファイルを描きます。
  • 「Previous sessions: edge」 — 過去セッションのプロファイルをセッションのどちらの端(左または右)に描くか。
  • 「Profiles to display」 — 「Latest session of each type only」:各タイプの最新セッションのみ。「Latest + previous sessions」:過去のセッションも追加。
  • 「Previous sessions with full profiles (1-10)」 — 各タイプで、フルプロファイルで表示する過去セッションの数。
  • 「Profile width (% of session, edges mode)」 — プロファイルの片側の最大幅(セッション長に対する割合)。
  • 「Shared divider: width per side (bars)」 — 共有分割線モードでのプロファイルの片側の幅(ローソク足の本数)。
  • 「Shared divider: gap after last bar (bars)」 — 最後のローソク足からクラスターまでの距離。プロファイルが価格の邪魔になるときは増やします。
  • 「Show value area high / low lines」 — 各プロファイルに VAH と VAL の点線を表示します。
  • 「Value area (%)」 — Value Area に含める出来高の割合。既定は70。
  • 「Show volume / delta numbers in rows」 — 各行の中に出来高とデルタの数値を表示します。
  • 「Drawing budget (max histogram boxes)」 — ターミナルを軽く保つためのヒストグラムオブジェクト数の上限。

4. POC

  • 「Show POC」 — POC を表示します。
  • 「POC display」 — 「Zone」:POC の行に塗りつぶしのゾーン。「Line」:ライン。
  • 「Zone width basis」 — 「POC row」:ゾーンを POC の行と同じにします。「Custom points」:中心を基準に指定幅のゾーンにします。
  • 「Custom zone total width (points)」 — 「Custom points」モードでのゾーン全体の幅(ポイント)。
  • 「Extend developing session POC right」 — 形成中のセッションの POC を右へ延長します。
  • 「Zone transparency (0-100)」 — ゾーンの塗りの透明度。
  • 「Zone border width」 — ゾーンの枠線の太さ。
  • 「Show POC center line inside zone」 — ゾーン中央の破線。
  • 「POC line across the whole chart (extended POCs)」 — POC ラインを履歴の先頭からクラスターまで引き、左上にラベルを付けます。
  • 「POC line width」 — POC ラインの太さ。

5. Previous sessions levels

  • 「Extend previous sessions' POC right」 — 終了したセッションの POC を右へ延長します。
  • 「Previous sessions to extend per session type (1-30)」 — 各タイプで、直近の終了済みセッションをいくつ延長するか。
  • 「Allow incomplete sessions in history」 — データが不完全なセッションのレベルも延長できるようにします(アスタリスク * で表示)。
  • 「Show dated level labels」 — セッション名と日付付きのレベルラベルを表示します。
  • 「Naked POC mode: stop extension at first revisit」 — 価格が最初に POC に戻った時点でラインを止めます。
  • 「Also extend previous VAH / VAL right」 — 過去セッションの VAH と VAL も延長します。
  • 「Extension length to the right (bars)」 — クラスターがラインを制限しない場合の、右への延長の長さ(ローソク足の本数)。
  • 「Stop extended lines before the profile cluster (shared divider mode)」 — 延長ラインをプロファイルのクラスターの手前で止め、クラスターを見やすく保ちます。

6. Colors

  • 「Asian session color」、「London session color」、「New York session color」、「Sydney session color」、「Custom session color」 — セッションごとの色:POC、ライン、ラベル、パネルのカード。
  • 「Volume」 — 出来高ヒストグラムの色。
  • 「Volume inside value area」 — Value Area 内の出来高の色。
  • 「Positive delta」 / 「Negative delta」 — プラスとマイナスのデルタの色。
  • 「Value area lines」 — VAH と VAL ラインの色。
  • 「Profile transparency (0-100)」 — ヒストグラムの透明度。
  • 「Show profile titles」 — プロファイルの上(セッション名と日付)と下(VOL と DELTA)のタイトル。

7. Alerts

  • 「Alert when price touches extended POC / VAH / VAL」 — 価格が延長レベルに触れたときにアラートを出します(VAH と VAL は、延長がオンの場合)。
  • 「Popup alert」 — ポップアップウィンドウ。
  • 「Push notification」 — モバイルアプリへのプッシュ通知。
  • 「Sound alert」 — 音による通知。
  • 「Touch tolerance (points)」 — タッチ判定の許容幅(ポイント)。

8. Panel

  • 「Show interactive panel (drag header, buttons)」 — ボタン付きパネルを表示します。
  • 「Panel start X (drag header to move)」 / 「Panel start Y (drag header to move)」 — パネルの初期位置。その後はマウスでドラッグして移動できます。

9. Session lines

  • 「Show vertical lines at session start / end」 — セッションの開始と終了に縦線を表示します。
  • 「Session lines style」 — それらの線のスタイル。
作者のその他のプロダクト
インディケータは、最も可能性の高いトレンドストップ/反転エリア、自信のあるトレンド移動エリアを計算します。 計算では次のことが考慮されます。 価格変動率; チャートの相対偏差角度。 価格変動の平均振幅。 その「コンフォートゾーン」を離れる価格。 ATRインジケーターの値。 インジケーターは、価格がストップ/リバーサルエリアに入るとアラートを生成できます。 設定 全長を描きますか? -チャートの最後まで領域を描画します。 Show StopUP-trend-上昇トレンドのストップ/反転エリアを表示します。 上昇トレンドを表示-自信を持って上昇トレンドの領域を表示します。 下降トレンドを表示-自信を持って下降トレンドの領域を表示します。 Show StopDOWN-trend-下降トレンドのストップ/反転エリアを表示します。 エリア変更のアラート-価格がトレンドストップ/変更エリアに入ったときにアラートを生成します。 次は、各商圏の色設定です。
フラットとトレンドを決定するための指標。 価格が2つのヒストグラムと2つの線(赤と青)のいずれかを下回っている場合、これは売りゾーンです。 このバージョンのインジケーターを購入するときは、1つの実際のアカウントと1つのデモアカウント用のMT4バージョン-ギフトとして(受け取るには、プライベートメッセージを書いてください)! 価格が2つのヒストグラムと2つの線(赤と青)のいずれかを上回っている場合、これは購入ゾーンです。 MT4バージョン: https//www.mql5.com/en/market/product/3793 価格が2つの線の間、またはいずれかのヒストグラムのゾーンにある場合、市場に明確な傾向はありません。簡単に言えば、市場は横ばいです。 インジケーターの動作は、スクリーンショットでより明確に示されています。
SuperTrend
Evgeniy Zhdan
2.5 (2)
The Supertrend Expert Advisor The Supertrend Expert Advisor with averaging elements. It has been developed during three months until I finally got good results. It is not a scalper. The minimum balance to start trading - 100 $. Is automatically adjusted to the 4 and 5-digit prices. Has an efficient risk management system. The lot and limit on the maximum lot is automatically calculated based on the settings specified in the EA. As a result, you have a complete automated trading system. Download
StarDust searches for divergences in the values of several indicators considering them as signs of flat and enters the market if a relatively steady trend is detected. The Expert Advisor trades "basic" symbols with a low spread. The best results are achieved on М15. The EA automatically adjusts to 4 and 5-digit quote flows. Settings Comment_to_orders – comment to a placed order. The field can be left blank if no comment is required. MM – enable money management with automatic setting of a worki
The EA catches the price when it moves against the trend in an effort to open an order in an opposite direction (direction of the main trend). Screenshots illustrate examples of entries and the strategy gist. The EA uses stop losses depending on values of ATR. Settings: Lot_ - if Risk_ = 0, the EA will trade this lot; Risk_ - risk per one trade. Stop loss is taken into account; koeff_ATR - coefficient multiplied by the ATR value to calculate stop loss (the bigger the value, the bigger stop loss
The FastBoom EA finds the most probable points of price pullback/reverse and places an order. It places averaging orders if the price moves further against take profit. Settings of the EA: Lots - initial lot; LotExponent - multiplier for following orders (Martingale). 1 - no multiplier. TakeProfit - take profit in points; Stochastic Settings InpKPeriod - K Period of Stochastic InpDPeriod - D Period of Stochastic InpSlowing - Stochastic Slowing LevHigh - level for sell positions of Stochastic L
The Expert Advisor calculates the double/triple divergence of volumes, and starts trading. It uses a unique formula of lot calculation, which greatly improves stability of trading. Recommended TF - 1h. Currency pair - EURUSD , but the EA can be used on any trading instruments which are not subject to high volatility. Settings mode - trading direction can be set manually; close - order close level (details on the screenshot); Step between orders - step between orders in points; Maximum orders -
The Expert Advisor opens orders from the horizontal line, the a trader can set on any level by dragging using the mouse or by changing the line properties. For example, when a horizontal line is above the current price, the EA will open a Buy order once the horizontal line is reached. And vice versa: If the line is below the current price, the EA will open a sell order once the line is crossed. A buy crossover of the line is: opening of the current candlestick below the horizontal line; the curr
SellerATR
Evgeniy Zhdan
5 (1)
The Expert Advisor only sells. Recommended currency pairs : EURUSD; GBPUSD; USDCHF; USDJPY; USDCAD; AUDUSD; EURGBP; EURAUD; EURCHF; EURJPY; GBPCHF; CADJPY; GBPJPY; AUDNZD; AUDCAD; AUDCHF; AUDJPY; CHFJPY; EURNZD; EURCAD; CADCHF; NZDJPY; NZDUSD. Timeframe: H1. Percent% manages closing both loss-making and profitable deals based on the account overall status. Using the EA on 23 symbols mentioned above allows the robot to cope with the drawdown in case of a long trend. While positions on some pairs
Illusion
Evgeniy Zhdan
3 (2)
The Illusion EA uses the probability theory - after a series of consecutive virtual losses - i.e. right during a flat the EA already starts trading in the trend. In addition, the EA considers the ratio of bullish/bearish candles on the higher timeframes to determine the greatest probability of the price movement direction. Only 1 order can be opened at a time. In case of a loss the following order will be placed with an increased lot (the multiplication coefficient is set in the parameters). The
The indicator plots a trend line and determines the levels for opening trades, in case the price goes "too far" away from the trend level. More detailed information is available in the screenshots. Settings Away from the trend line - distance from the trend line to the trades level; Arrow Signal for deals - enable displaying an arrow when the price reaches the trades level; Size of Arrow - size of the arrow; Alert Signal for deals - enable generating alerts when the price reaches the trades lev
Turbina
Evgeniy Zhdan
5 (4)
The axiom of the Forex market is that any trend will be broken. The Expert Advisor determines trend direction (the pink line), and calculates levels for opening opposite orders depending on the settings. The value of Away from the trend line for Deal will be different for each pair and timeframe, depending on the volatility of the trading instrument. Next orders can be opened with an increased lot (a static lot is used by default). See the screenshots to understand the idea of the Expert Advisor
The Expert Advisor determines the moments of strong movements and opens a position in the direction of the most probable price movement. The strategy always uses stop loss and take profit. Several independent orders can be in the market (the maximum number is set in parameters). The goal of the EA's underlying trading system is the quantitative excess of the number of profitable deals over the number of losing ones. Recommended: EURUSD 5m; GBPUSD 5m; USDJPY 5m. The Expert Advisor is able to work
Vise is a trend indicator. The upper and lower lines follow the price showing the prevailing price direction. Frequent breakthroughs of the upper line indicate a bullish trend, while frequent breakthroughs of the lower line indicate a bearish one. Parameters Points for UpLine - initial number of points for the upper line; Points for DownLine - initial number of points for the lower line. During the breakthrough of the upper level (line), this level shifts upwards by Points for UpLine. If the up
Twinkle is a trend-based scalper using stop loss and take profit invisible to the broker. The EA does not look for trend reversals. The EA catches strong market movements and opens orders in the direction of the trend. Your broker will not see the order closing levels. The EA closes orders independently when reaching the take profit or stop loss levels specified in the settings. Recommended trading symbols: EURUSD M5, GBPUSD M5. ECN accounts with 5 digits quotes are recommended. Expert Advisor
Shine
Evgeniy Zhdan
4.75 (4)
This Expert Advisor implements elements of the Martingale system. Orders are opened at a specified distance from the moving average. The Parabolic SAR indicator and certain technical details are used to ensure the most accurate entries. The EA is highly customizable. It is recommended for simultaneous use on 4 currency pairs: EURUSD M15; GBPUSD M15; USDJPY M15; USDCAD M15. Despite good stability, it is advisable to disable the EA operation during the days rich in news releases. Configurations P
LuckyCase is an Expert Advisor with martingale elements. The EA strategy is based on a significant "deviation" of the price from SAR inadicator and the Bands levels breakthrough point. The money management system is an essential part of the EA. It starts working after a trade is opened. Trades are closed after accumulating specified points of market orders, by deposit % or after an opposite side of the channel is broken through. The default EA settings are meant for: EURUSD M15; USDJPY M15. The
The Elize Expert Advisor has been designed to work with the EURCHF currency pair. It considers the peculiarities of this trading instrument, its behavior and dependence on the behavior of other currencies. In particular, when the currencies of the European countries (EURUSD, GBPUSD, EURNOK, EURCHF) move in the same direction, the EA starts its operation and opens a deal in the trend direction of the European currencies. In the event of price rollbacks, the EA uses a unique method for making the
Brief Description of the All Trend Lines Indicator The indicator analyzes the wave structure of the market. What it displays on the chart: First. Wave pivots (semaphores) • Red markers – wave highs • Yellow markers – wave lows • Yellow-green markers – additional local extremes Second. Trend lines • Purple/blue lines – trends based on highs (resistance/support) • Beige/green lines – trends based on lows • Lines are built automatically by connecting wave pivots of the same type Third. Main trend
The Expert Advisor has been specifically developed for trading gold (Spot Gold). The strategy is based on Fibo levels calculated from the previous (first) candle High/Low and the width of the current and lower timeframes channel. If important Fibo levels of different orders are located in a single price channel (within a spread), the EA defines this channel as the target for price movement and starts operation. Martingale and averaging are not used. Each order is independent and is accompanied b
The algorithm of this Expert Advisor determines the significant price levels, where the trend often turns into a flat or reverses. Stochastic Oscillator serves as an additional filter of overbought/oversold zones. The EA sets stop loss and take profit after opening an order. The underlying trailing strategy applies a trailing stop. The EA is recommended for simultaneously use on three trading instruments: EURUSD M5, GBPUSD M5, EURCHF M5. Settings: Comment to order - comment to orders. MaxRisk -
The Expert Advisor looks for technical analysis patterns formed on the higher (hourly) timeframe to start working on the 5-minute chart. Technical analysis patterns used: double top/double bottom, head/shoulders, flag, expanding/narrowing triangles. The Relative Vigor Index technical indicator is used as the filter for opening deals. It is based on the idea that on the bull market the closing price is, as a rule, higher, than the opening price. It is the other way round on the bear market. This
The Expert Advisor calculates the divergence on the current and higher timeframes. In case the divergences coincide, the EA starts its operation. Deals have strict take profit and stop loss levels. Each deal is managed by trailing stop. The strategy involves the use of a tight stop-loss. Therefore, losing deals and/or series of losing deals are not uncommon. This EA is not suitable for those who have difficulties coping with losing deals. The EA is recommended for simultaneous use on the followi
The Expert Advisor has been developed specifically for the features of the CHFJPY currency pair. The EA's algorithm determines the direction of the current trend and starts operation. In case of a price reversal within the current trend, the EA adds additional orders. If trend changes, the EA starts to work in the direction contrary to the initial grid of orders. If there were no conditions for closing orders and the trend direction changed again, the EA continues to work with the "first" grid o
The Expert Advisor algorithm determines on daily charts those candlestick patterns, which set the intraday trading direction. The trading EA determines how long the price is moving in overbought/oversold zones and starts working in the direction of the expected trend movement. Each position is accompanied with a tight stop loss and take profit. Only one active position can be open in the market. The EA was developed and tested using 99% quality quotes. The Expert Advisor has a built-in news filt
The strategy of this Expert Advisor is based on a hedging system, which implies placing opposite orders. The EA algorithm determines trend beginning and opens a position in the trend direction. In case of a wrong entry, the EA tries to neutralize the drawdown through opposite (hedging) orders at a preset interval (Coefficient of counter orders). Orders are closed when one of the two values ​​is reached - profit in percent or profit in points. The EA does not use lot increase. The EA wast tested
Советник работает по принципу хеджирования с периодическими "перекосами" в сторону трендовых направлений. Направления тренда советник определяет на основании стандартного индикатора Parabolic Stop and Reverse system (SAR). Уникальная стратегия установки балансирующих позиций позволяет избегать больших просадок даже при самых не благоприятных рыночных условиях. Параметры по умолчанию рекомендуется использовать на торговом инструменте: GBPJPY 15m. Разработка и оптимизация параметров производились
Snoot
Evgeniy Zhdan
5 (1)
This Expert Advisor works using a grid in the direction of a trend movement with the step between opened positions defined in the settings. The positions are closed by the total take profit. The Parabolic SAR standard indicator is used to filter order opening, which comes in the MetaTrader 4 package. The EA has been developed and tested using 99,9% quality of quotes. Operation of the EA in real time can be viewed in the signals . The best trading results have been achieved on CHFJPY M15. Settin
The Expert Advisor builds channels based on the data obtained using ATR and MA indicators according to the equations: Upper channel border = MA + ATR * (FIBO); Lower channel border = MA - ATR * (FIBO), where FIBO has the following values: Style of Trade - Aggressive = 1.61852; Style of Trade - Average = 3.26704; Style of Trade - Calm = 4.85556. Trades are opened inside the channel with the intervals defined in the settings. Long and short positions are opened independently. Positions are closed
The trading statistics indicator notifies the trader of the aggregate income of the trading account for different time intervals. The indicator has wide display settings on the graph. There is a choice of one of the two display languages on the chart- English and Russian. Settings Indicator language (ENG, RUS) - Select the language to display on the chart; To control the magic (-1: any magic) - Entering the Magic for control (-1: any Magic); Angle of indicator tie - Selecting the angle of the c
フィルタ:
レビューなし
レビューに返信