Demetra Twin Days Past Days That Began Alike

Finds the past days whose first hours moved like today, draws what followed them as a fan, and checks that reading against a simple later-week test. Counts and ranges, not odds. It never trades on live charts.

Main features

  • Twins: once enough hours of today are complete, Twin Days searches the past days of your symbol for the ones whose hourly path so far is closest to today, and keeps the closest ones. How far back it looks, how many twins it keeps, and how many completed hours of today it waits for are your inputs.
  • What followed, as counts and ranges: how many twins closed higher by the end of their day, the typical rest-of-day move, and the middle of the range of those moves. Example: "5 of 8 closed higher".
  • A fan on the chart: the typical and middle-range rest-of-day moves of the twins, drawn from the current hour to the end of the server day.
  • A later-week check: the same search is repeated on past days, using only the data that existed on each of those days, and compared with a 50/50 split. The panel says plainly when the twins did not beat that, which on most symbols they do not, and stays quiet until there are enough test days.
  • The closest twins listed with their date, how near they were, and how their day went on.
  • Server-time days. A broker's short Sunday open and very short holiday days are not used as days.
  • Optional alert once a day when today's twins are ready (popup, sound, push, e-mail; off by default). Sent only while connected with the history in sync, and remembered across restarts, so a restart never repeats it. Never in the Strategy Tester.
  • Panel with an explanation on every row. Minimize hides the panel and the fan. On a chart too small for the full panel, it folds itself to a title bar. No account data on screen.
  • Out-of-range inputs are refused with one clear message. No DLL, no web requests. English UI. (The Strategy Tester demo presses the panel buttons and opens one validator trade.)

Trading involves risk of loss. Twin Days shows what followed similar days on past prices; it gives no trading signals, no odds and no guarantee of results. Past counts do not predict future ones.

おすすめのプロダクト
EW Close All – ワンクリックですべて終了。 EW Close All は軽量で多言語対応のEA(エキスパートアドバイザー)です。ボタンを1回クリックするだけで、すべてのオープン中のポジションを即座に決済し、すべての保留中注文をキャンセルできます。 すべての保有ポジションを決済   すべての保留注文を取消   どんな通貨ペア・時間足でも動作   多言語インターフェース対応   シンプル・高速・確実 素早い撤退、リスク管理、取引終了時のクリーンアップに最適。 完全にコントロールを維持 — EW Close All で数秒ですべてをクローズ! EW Close All – ワンクリックですべて終了。 EW Close All は軽量で多言語対応のEA(エキスパートアドバイザー)です。ボタンを1回クリックするだけで、すべてのオープン中のポジションを即座に決済し、すべての保留中注文をキャンセルできます。 すべての保有ポジションを決済   すべての保留注文を取消   どんな通貨ペア・時間足でも動作   多言語インターフェース対応  
FREE
Symbol Cost Monitor は、複数の取引銘柄における取引コストを同時かつ迅速に監視するために開発された、MetaTrader 5向けの高機能分析ユーティリティです。 スプレッドとスワップは、取引の最終的な結果に直接影響します。特にスキャルピング、活発なデイトレード、数日間にわたるポジション保有、複数銘柄の同時取引では、これらのコストを正確に把握することが重要です。MetaTrader 5の標準インターフェースでは、すべての情報を1つの画面で簡単に比較できないため、通常は各銘柄の仕様を個別に開いて確認する必要があります。 Symbol Cost Monitorは、選択された銘柄の主要データを収集し、チャート上のコンパクトなパネルに表示します。スプレッドが拡大している銘柄の確認、スワップの比較、取引条件の変化の監視、ポジションを開く前の潜在的なコストの評価を簡単に行えます。 パネルのデータはリアルタイムで更新され、気配値表示に登録されているすべての銘柄、またはユーザーが指定した銘柄リストを監視できます。色分け表示により取引条件の悪化を素早く確認でき、設定した水準をスプレッドが
FREE
ATTENTION: the utility cannot work in the Strategy Tester, if you want to try the demo version for free for a week, or have any questions, write me an email! You can find my address on my user profile. TrendLine Auto Executor is a software capable of identifying the trendlines you have drawn on the chart and opening orders as soon as they are touched or exceeded. The software allows you to manage two orders at a time for each chart by tracking two groups of trendlines, one for each order, and e
Opening Range Gap (ORG) Automatically maps the daily Opening Range Gap — one of the most-watched institutional reference points — directly on your chart. The Opening Range Gap is the price void left between the previous session's close and the new session's open. Smart-money traders treat this zone as a magnet and a decision point: price often returns to fill it, reacts at its edges, or uses it as a launchpad for the day's expansion. This indicator removes the guesswork — it detects the gap the
Background Tool for MetaTrader 5  https://elitefx.store/ Personalise your MetaTrader 5 workspace with your own chart background images. Background Tool provides an on-chart control panel for switching images and adjusting their brightness. Features Display your own background images on your chart. Browse images using Previous and Next. Adjust brightness with Lighter and Darker. Turn the background display on or off. Reload images and save your preferences. Manage backgrounds from a compact on-c
CGE Trade Desk
Carl Gustav Johan Ekstrom
5 (1)
Professional Trade Desk for MT5: Limit & Market Orders, Risk Control and Grid Bot CGE Trade Desk is a chart-driven order panel for MT5 traders on retail accounts or prop firm challenges. Plan the trade on the chart, size it from your risk, and let the desk protect your account from costly mistakes. Drag your entry, stop and take-profit lines on the chart, then click PLACE ORDER. The desk handles lot size, expiry and risk limits for you. Daily loss caps, profit targets, a daily lockout and a fail
FREE
STAMINA HUD – Advanced Market & Trend Dashboard (MT5) STAMINA HUD   is a professional   market information panel   designed for traders who want   clarity, speed, and control   directly on the chart. It provides a   clean heads-up display (HUD)   with essential market data and   multi-timeframe trend direction , without cluttering the chart or generating trading signals. What STAMINA HUD Shows   Current Price   Spread (in real pips)   Today High–Low range (pips)   Average D
FREE
JT360 DNA Mini PnL Pointer V1.04 Public Компактно. Наглядно. Всегда перед глазами. JT360 DNA Mini PnL Pointer — это лёгкий индикатор для MetaTrader 5, который отображает суммарную текущую прибыль или убыток по всем открытым позициям текущего символа графика. Компактная индикация непосредственно на графике объединяет PnL относительно первоначального риска в формате R, тонкую мини-полоску и настраиваемую цветовую матрицу. Фирменные цвета JT360 — бирюзовый и пурпурный — выделяют крайние значения и
FREE
This tool is used to generate a K - line reflection chart of a currency pair for foreign exchange transactions. For example, if the currency pair is EURUSD, a custom currency pair named EURUSD_ref is generated and a chart for that currency pair is opened. The price of a custom pair of currency is the inverse of the price of the original pair, which is the equivalent of a new pair of currency, the USDEUR. The usage is simple, put it on any chart, the new chart will open, and then draw the corr
See how your account is really doing at a glance, right on the chart. The dashboard reads your account and trade history and never opens, modifies or closes a trade. How it works Every second the dashboard reads balance, equity, margin and open positions. Closed results come from the deal history: for each closing deal the profit, swap, commission and fee are added together. From these deals it calculates closed profit for today, this week and this month, plus statistics for the period you choos
FREE
The Mirror Chart MT5 is a overlay indicator specifically designed to project a second financial instrument directly onto the main chart window. This tool is invaluable for traders who rely on correlation analysis, as it visualizes the price movements of two different instruments in real time. Unlike traditional overlays, this indicator utilizes intelligent, dynamic centering and scaling logic. It continuously analyzes the visible price range in the current window for both symbols and calculates
FREE
The trade cost caused by spreads is an important indicator when formulating trade profit-loss ratios. Spread costs info is particularly important for short-term traders, especially scalping traders. This tool can output the spread cost of all Forex currencies (including XAU and XAG) in the platform in different account types (USD account, EUR account, etc.). Calculation and code See articles: THE TRADE COST OF FOREX CURRENCY Part1 THE TRADE COST OF FOREX CURRENCY Part2 THE TRADE COST OF FOREX C
FREE
这款专为MetaTrader 5设计的EA(Expert Advisor),能够在加载后自动关闭所有图表,并立即从当前图表中自行移除。它适合那些希望快速清理所有图表,并避免手动关闭每个图表的用户。 功能特点: 一次性清理: 加载后立即关闭所有打开的图表。 自动移除: 执行完毕后,EA自动从当前图表中移除,无需手动操作。 快速高效: 适用于快速清理交易环境,特别适合在需要快速重置或结束交易日的情境。 使用说明: 只需将此EA添加到任何一个图表上,它将自动执行关闭所有图表的操作并自行移除。使用前,请确保已保存所有重要的图表数据和设置。 风险提示: 请谨慎使用此EA,以防不小心关闭重要图表。 适用于MetaTrader 5平台。 技术支持: 如有任何技术问题或需求,请联系我以获得帮助。
FREE
RiskCompass Panel MT5 1. The Problem and the Approach You have a position idea, and the first real question is always the same: how much of this account am I about to put at risk, and can the account carry it. The information that answers that question is scattered across half a dozen windows. Balance is on one tab. Margin level is somewhere else. The spread you just paid is visible only if you look at the instrument row. The server day, which decides whether your daily loss limit has already be
FREE
TrendVision AI
Murtadha Majid Jeyad Al-Khuzaie
TrendVision AI – Smart Trend Channels & Price Forecasting for MetaTrader 5 Discover market structure and explore potential future price direction with TrendVision AI, an advanced technical indicator for MetaTrader 5 that combines automatic trendline analysis with a machine-learning-based price forecasting model. How Does TrendVision AI Work? TrendVision AI analyzes historical candlestick data within a configurable lookback window. It automatically draws two trendlines directly on the chart:
FREE
Playback of previously saved data from the order book. Key features: Historical data navigation Adjusting the playback speed with the "---" and "+++" buttons, as well as with the mouse, you can by scrolling the wheel over the area of ​​these buttons and between them Turning Price Centering On and Off Time display accurate to thousandths of a second Attention: This product also needs a utility to save data: https://www.mql5.com/en/market/product/71642
FREE
最大 7 つの市場セッション と 3 つの週の範囲 を チャート に表示し、完全にカスタマイズ可能 各セッションとレンジは表示または非表示にすることができ、各トレーダーのニーズに応じて特別な日中または週内の期間に合わせて調整できます 次のいずれかを使用してセッションの開始/終了時間を定義します。 GMT/UTC 時間(任意のタイムゾーンに調整可能) サーバー/ブローカー時間 (チャート時間)  現地時間(コンピュータの時間) PRO バージョンの機能 名前 : 各セッションと週の範囲を特定の名前で区別します 開始時刻と終了時刻を分単位で指定する : 時:分(HH:mm) または単に時間(HH) 形式で設定できます 週単位範囲の開始日と終了日:  週単位範囲の任意の曜日(日曜日から月曜日まで)間の期間を設定します GMT 時間のタイムゾーン オフセットを調整可能 : タイムゾーン オフセットを GMT 基準時間に設定すると、場所に応じて市場の基準時間を簡単に使用できます。 たとえば、ニューヨーク時間: GMT -5 Android 版または iPhone 版 MetaTrader ア
Script to calculate equity and balance at a specific date and time.  This script makes up for a lack of MetaTrader account history, that does not show how the balance and equity changes in time. Balance calculation includes closed orders only. Equity calculation includes orders closed before and orders that are still open at the specified time. Example: date and time set to 2020/07/06 00:00. If I had a Buy 1 lot EURUSD position opened at price 1.12470 on the 2020/07/02, the program would ca
FREE
AlsoSell Cockpit は、分析・数量計算・発注・管理・振り返りまで、トレードの全工程をチャート上の洗練されたパネルにまとめます。チャートから離れる必要はありません。 発注と執行 - ワンクリックの成行 BUY / SELL。リスク基準でロットを自動計算します。 - チャートプランナー:エントリー・損切り・利確のラインをチャート上で直接ドラッグ。ロットは損切り距離とリスク%からリアルタイムに計算され、リスクリワード比と到達時の正確な損益($)がドラッグ中に表示されます。 - スマート執行:EXECUTE はエントリー位置に応じて成行か指値/逆指値の待機注文を自動で選択します。 - 価格検証(SL/TP の正しい側+ブローカーの最小ストップ距離)により、無効な注文を送信前にブロックします。 - リバース:ネットポジションを決済し、反対側へワンクリックでドテンします。 - 柔軟なロット管理:リスク%による自動、またはパネル上の手動ロットステッパー。 - すべての注文にマジックナンバーとコメントを付与し、管理を容易にします。 ポジション管理 - ワンクリック決済:全部 / 利益
FREE
Telegram Notification Worker (v5.31) Telegram Notification Worker is a high-performance, professional utility designed to bridge the gap between your MetaTrader 5 terminal and Telegram. It acts as a dedicated background worker that forwards custom alerts, trade events, and system status messages from any of your Expert Advisors (EAs) directly to your Telegram chat or channel. Key Technical Features: Asynchronous Messaging Engine: Unlike standard notification scripts, this worker uses an asynchr
FREE
Account Info ASは、MetaTrader 5用の強力な情報スクリプトです。チャート上に取引口座に関する詳細情報を直接表示します。このスクリプトは、口座分析、リスク管理、そして取引判断に必要なすべてのデータを提供します。 主な機能 完全な財務情報 口座の種類(デモ/リアル/コンテスト) 残高、エクイティ、マージン 現金およびパーセンテージでのフリーマージン マージン水準 現在の損益 リスク管理 マージンコールとストップアウト水準 現在のシンボルの1ロットに対するマージン計算 一般的な取引商品のマージン 取引情報 オープンポジション(数量、方向、総利益) 種類別の未決注文 現在のシンボル情報: ロットサイズ(最小/最大/刻み) スプレッド(ピップス) スワップサイズ テクニカルデータ 現在のサーバー時刻 会社名とサーバー名 口座番号と顧客情報 設定 このスクリプトには3つのシンプルなパラメータがあります: Line_spacing - データ間に空白行を追加して、読みやすさを向上させます ShowAllSymbolsInfo - 一般
FREE
概要 このインジケーターは、クラシックな ドンチャンチャネル を強化したバージョンで、実践的なトレード機能を追加しています。 標準の3本線(上限、下限、中央線)に加え、 ブレイクアウト を検出し、チャート上に矢印で視覚的に表示します。また、チャートを見やすくするために、 現在のトレンド方向と逆側のラインのみを表示 します。 インジケーターの機能: 視覚的シグナル :ブレイクアウト時にカラフルな矢印を表示 自動通知 :ポップアップ、プッシュ通知、Eメール RSIフィルター :市場の相対的な強弱に基づいてシグナルを検証 カスタマイズ可能 :色、ラインの太さ、矢印コード、RSI閾値など 動作原理 ドンチャンチャネルは次のように計算します: 上限線 :直近N本のクローズ済みローソク足の最高値 下限線 :直近N本のクローズ済みローソク足の最安値 中央線 :最高値と最安値の平均値 上方ブレイクアウト は終値が上限線を超えたときに発生し、 下方ブレイクアウト は終値が下限線を下回ったときに発生します。 インジケーターは以下を行います: 3本のドンチャンラインを描画 方向転換後の最初のブレイクアウト
FREE
Important Lines
Terence Gronowski
4.88 (24)
This indicator displays Pivot-Lines, preday high and low, preday close and the minimum and maximum of the previous hour. You just have to put this single indicator to the chart to have all these important lines, no need to setup many single indicators. Why certain lines are important Preday high and low : These are watched by traders who trade in a daily chart. Very often, if price climbs over or falls under a preday low/high there is an acceleration in buying/selling. It is a breakout out of a
FREE
Core function Intelligent transaction management one-click opening and closing operation, which supports user-defined lots to set multiple closing modes: all closing, closing by direction and closing by profit and loss status. Professional risk control, real-time risk monitoring and spread control to avoid high-cost trading environment. Visual control panel has an intuitive graphical interface, and all functions can be operated with one button to display position information, profit and loss sta
FREE
AUTO RISK MANAGER PRO:あなたのForex取引パートナー! AUTO RISK MANAGER PRO_MT4 — MT4バージョン デモ版 + 詳細な説明 感情のせいでお金を失うのはもうやめましょう! リスク管理はプロフェッショナルなアルゴリズムに任せる時です。 想像してみてください: 市場が急にあなたのポジションに逆行したその時、 あなたは寝ている、働いている、または家族と過ごしている——よくある話ですか? Auto Risk Manager Pro があれば——もう二度とそんなことはありません! メリット: 革命的なリスク管理アプローチ 24時間365日の自動資金保護 パソコンの前にいなくても自動で稼働 正確な利益目標設定——最適なタイミングで利益を確定 厳格な損失制限——重大な損失を防止 マルチカレンシー対応——どんな金融商品でも使用可能 チャートを閉じる機能(EAも同時にアンロード) コントロールパネル Control Panel Settings(パネル設定) PanelColor = clrDarkSlateGray — パネルの色 PanelX =
Welcome to my MMTrader Manager product. EA that allows You for simple managing trades and positions. Key Features: Position Opening – Open trades quickly with customizable Take Profit (TP), Stop Loss (SL), and lot size settings. Position Closing – Close trades with one click. Grid System – Automatically create a grid of orders. Recovery Mode – Loss recovery lot calculation. Trade History Data – Acces data to historical positions. User-Friendly Interface – A clear and simple panel designed. This
FREE
Xauiq ATR Trade Manager is a position management utility designed for manually opened XAUUSD trades. It does not generate entry signals and does not decide whether to buy or sell. After a manual position is detected, the utility manages risk, partial profit taking and the remaining position according to the confirmed settings. Main Features Manual Position Management The utility manages eligible manually opened positions and detects the actual Buy or Sell direction before calculating any level.
FREE
MT5 History Checker Can you trust the historical data behind your MT5 backtest? MT5 History Checker is a diagnostic utility designed to identify missing periods and coverage problems in the historical data supplied by your MetaTrader 5 broker. Select the symbol and date range you want to examine and run the checker. The utility analyses the available history and provides a clear PASS, WARNING or FAIL result. What it checks Historical tick-hour coverage M1 historical-data coverage Missing periods
FREE
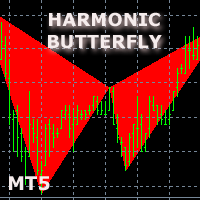
The indicator detects and displays М. Gartley's Butterfly pattern. The pattern is plotted by the extreme values of the ZigZag indicator (included in the resources, no need to install). After detecting the pattern, the indicator notifies of that by the pop-up window, a mobile notification and an email. The pattern and wave parameters are displayed on the screenshots. The default parameters are used for demonstration purposes only in order to increase the amount of detected patterns. Parameters z
Basic Theme Builder: チャートカスタマイズを簡単に Basic Theme Builder インジケーターで、MetaTrader 5   のチャート外観のカスタマイズをシンプルに変革しましょう。この直感的なインジケーターは、使いやすいパネルを提供し、さまざまなテーマやカラースキームを簡単に切り替えることができます。これにより、取引環境の視覚的な魅力と機能性が向上します。 Free MT4 version Basic Theme Builder インジケーターは、MetaTrader 5 のチャートを簡単にパーソナライズしたいトレーダーに最適なツールです。シンプルなパネルインターフェースとさまざまなテーマプリセットを使用して、取引スタイルや気分に合わせてチャートの外観をすぐに調整できます。クラシックなルックからモダンな美学まで、多彩なオプションを提供する Basic Theme Builder で、視覚体験を最適化しましょう。 主な機能: 簡単なテーマ管理: 便利なパネルインターフェースを使用して、ワンクリックでチャートのテーマを素早く変更できます。 定義済みのプ
FREE
このプロダクトを購入した人は以下も購入しています
Trade Assistant MT5
Evgeniy Kravchenko
4.43 (216)
取引 ごとのリスクの 計算、新規注文 の 簡単 な 設置、部分的 な 決済機能 を 持 つ 注文管理、 7 種類 のトレーリングストップなど 、便利 な 機能 を 備 えています 。 追加の資料と説明書 インストール手順   -   アプリケーションの手順   ライン機能 チャート上にオープニングライン、ストップロス、テイクプロフィットを表示します。この機能により、新規注文を簡単に設定することができ、注文を出す前にその特徴を確認することができます。   リスク計算 リスク計算機能は、設定されたリスクとストップロス注文のサイズを考慮して、新規注文のボリュームを計算します。ストップロスの大きさを自由に設定できると同時に、設定したリスクを守ることができます。 Lot calc ボタン - リスク 計算 を 有効 / 無効 にします 。 Risk フィールドでは 、必要 なリスクの 値 を 0 から 100 までのパーセンテージまたは 預金通貨 で 設定 します 。 設定」 タブで 、 リスク 計算 の 種類 を 選択 します :「 $ 通貨」、「 % 残高」、「 % エクイティ 」、「
Farmed Hedge Yield Farming | All Markets (Manual - Hybrid - Semi/Automated EA) VERIFIED TRADING RESULTS - Farmed Hedge Yield Axi Copy:  https://www.mql5.com/en/signals/2356376 - Farmed Hedge Yield Exn Copy:   https://www.mql5.com/en/signals/2356404 - Farmed Hedge Yield V Copy:  https://www.mql5.com/en/signals/2357156 IMPORTANT NOTICE: FarmedHedge is a MANUAL-FOCUSED TRADING UTILITY ,not a fully automated EA. Results shown on this Signal include manual trades and overall strategic management.
Trade Manager EAへようこそ。これは、取引をより直感的、正確、そして効率的にするために設計された究極の リスク管理ツール です。これは単なるオーダー実行ツールではなく、包括的な取引計画、ポジション管理、リスク管理のためのソリューションです。初心者から上級者、迅速な実行を必要とするスキャルパーまで、Trade Manager EAはあらゆるニーズに対応し、為替、指数、商品、暗号通貨などさまざまな市場で柔軟に対応します。 Trade Manager EAを使用すると、複雑な計算が過去のものになります。市場を分析し、エントリーポイント、ストップロス、テイクプロフィットのレベルをチャート上のラインでマークし、リスクを設定するだけで、Trade Managerが最適なポジションサイズを即座に計算し、SLとTPをピップ、ポイント、口座通貨でリアルタイムに表示します。すべての取引が簡単かつ効果的に管理されます。 主な機能: ポジションサイズ計算機 :定義されたリスクに基づいて取引サイズを瞬時に決定します。 簡単な取引計画 :エントリー、ストップロス、テイクプロフィットを設定するためのド
Telegram to MT5 Multi-Channel Copier   は、 Telegram と Discord チャンネルのトレードシグナルを MetaTrader 5 へ自動コピーします。ボット不要、ブラウザ拡張不要、手動コピー不要。Telegram や Discord にシグナルが届くと、EA が数秒であなたのターミナルに注文を出します。 さらに、チャンネルをコピーする前に、内蔵バックテスターでそのチャンネルがあなたの口座でどう動いたかを確認できます。 製品は 2 つのコンポーネントで構成されます:Telegram チャンネルを監視する Windows アプリと、MT5 ターミナルでシグナルを執行する本 EA です。MT4 版もあります   こちら . 購入前にお試しください:   アプリは無料でダウンロードできます。ご自身のチャンネルを接続し、各シグナルがどのように読み取られるかをご確認ください。Backtest タブと実際の取引には、購入またはレンタルした EA が必要です。このページの無料デモはストラテジーテスターでのみ動作し、テスターでは Telegram と D
TradePanel MT5
Alfiya Fazylova
4.88 (173)
Trade Panelは多機能なトレーディングアシスタントです。アプリには手動取引用の50以上のトレーディング機能が搭載されており、ほとんどの取引作業を自動化することができます。 アプリの説明書: https://www.mql5.com/en/blogs/post/756482 デモ口座用アプリの試用版: https://www.mql5.com/en/blogs/post/750865 アプリのインストール方法: https://www.mql5.com/en/blogs/post/756239 アプリをビジュアルモードでテストする方法: https://www.mql5.com/en/blogs/post/770277 VPSのMetaTraderにアプリをインストールする方法: https://www.mql5.com/en/blogs/post/770190 取引。 ワンクリックで取引操作を行うことができます: リスクを自動計算して指値注文やポジションを開く。 複数の注文やポジションをワンクリックで開く。 注文のグリッドを開く。 保留中の注文やポジションをグループごとに閉じる
Local Trade Copier EA MT5
Juvenille Emperor Limited
4.94 (150)
Local Trade Copier EA MT5 は、同一の Windows PC または Windows VPS 上で稼働する複数の MetaTrader 5 口座間で、取引をコピーおよび管理するための高速で柔軟なトレードコピーツールです。 ローカルでの取引同期に加え、Receiver 側でロットサイズ、リスク管理、取引フィルター、シンボルマッピング、取引管理、口座保護を個別に設定できます。 Transmitter と Receiver のターミナルは約 1分 で設定でき、同一ブローカーまたは異なるブローカーの口座間で、手動取引や EA による取引をコピーできます。適切な条件下では、ローカルの MetaTrader ターミナル間で取引情報を 0.5秒未満 で同期できます。実際の約定速度は、ブローカーのレイテンシー、ネットワーク状況、PC/VPS の性能、ターミナルの負荷によって異なります。 ご購入前に無料デモをお試しください Local Trade Copier EA MT5 の完全機能版無料デモ を、MT5 デモ口座で 1回につき4時間 テストできます。 Local Trad
News Trade EA MT5
Konstantin Kulikov
4.55 (11)
僕自身が数年間使っている便利なロボットをご紹介します。半自動モードでも完全自動モードでもお使いいただけます。 >>> Chat <<< 当プログラムは経済指標カレンダーで発表されるニュースをもとにした取引の柔軟な設定が可能です。戦略テスターでは確認不可です。実際の取引のみです。 最新の設定アーカイブをダウンロードしてください: https://www.mql5.com/en/blogs/post/747929 シグナルモニタリング: https://www.mql5.com/en/signals/author/test-standart 当該エキスパート・アドバイザーのためのカスタマイズ設定セットを作る場合は、ブログの全パラメータの説明を参照してください :   https://www.mql5.com/en/blogs/post/748545 。 基本的なデフォルト設定について 一つのチャートからGBPとの通貨ペア(GBPUSD、EURGBP、GBPJPY、GBPCAD、GBPAUD、GBPCHF)で取引をします。GBPは最もボラティリティの高い通貨のため、取引が成功するチ
Exp COPYLOT CLIENT for MT5
Vladislav Andruschenko
3.97 (35)
MetaTrader 5 用のプロフェッショナル取引コピー機 MetaTrader 向けの高速・高性能・信頼性の高い 取引コピー機 です。 COPYLOT は、MT4 と MT5 のターミナル間で Forex 取引をコピーでき、 Hedge 口座と Netting 口座の両方に対応しています。 COPYLOT MT5 版の対応構成: - MT5 Hedge → MT5 Hedge - MT5 Hedge → MT5 Netting - MT5 Netting → MT5 Hedge - MT5 Netting → MT5 Netting - MT4 → MT5 Hedge - MT4 → MT5 Netting MT4 版 完全な説明 + DEMO + PDF 購入方法 インストール方法 ログファイルの取得方法 テストと最適化の方法 Expforex のすべての製品 MT4 ターミナルへのコピーも可能です(MT4 → MT4、MT5 → MT4): COPYLOT CLIENT for MT4 COPYLOT は、2台、3台、さらには10台のターミナル間で同時に動作できる、プロフェッ
自分の取引ルールで Telegram のシグナルをコピー Telegram to MT5 Signal Trader は、Telegram の公開・非公開チャンネルやグループから、テキスト形式の取引シグナルを MetaTrader 5 へ自動でコピーします。1つのデスクトップアプリで複数の配信者と MT5 口座を管理し、 配信者ごとにリスクと取引設定を個別に指定 できます。 シグナルのコピーに Telegram ボットや API 設定は必要ありません。 電話番号または QR コードでご自身の Telegram アカウントにログインし、すでに参加しているチャンネルやグループを選ぶだけです。ボットの作成や、Telegram API トークン、API ID、API hash の入力は不要です。 ポジションサイズを選び、複数の利確水準に分けて決済し、建値へのストップ移動やトレーリングストップを自動化できます。配信者のシグナルを受け取りながら、実際の取引方法は自分で管理できます。 本製品は、この MT5 エキスパートアドバイザ(EA)と、必須の Windows 連携アプリで構成されます。 インス
The product will copy all telegram signal to MT5 ( which you are member) , also it can work as remote copier.  Easy to set up, copy order instant, can work with almost signal formats, image signal,  s upport to translate other language to English Work with all type of channel or group, even channel have "Restrict Saving Content", work with  multi channel, multi MT5 Work as remote copier: with signal have ticket number, it will copy exactly via ticket number. Support to backtest signal. How to s
Strategy Ledger Pro
Abdullah Uygar Tuna
5 (14)
日本語に対応しました。 Strategy Ledger Pro は、MetaTrader 5 用の読み取り専用の口座分析パネルです。口座の成績をエキスパートアドバイザー(EA)、戦略、銘柄、マジックナンバーごとに分け、それぞれが実際にどれだけ貢献しているかを明らかにします。 パネルは 11 言語に対応しています:English、Français、Deutsch、Español、Italiano、Português、Русский、Türkçe、中文、日本語、한국어。 デモをダウンロードする前に。 Market では、有料製品のデモはストラテジーテスター内でのみ実行されます。このパネルはご自身の口座の取引を分析しますが、ストラテジーテスターには読み取る口座履歴がないため、デモは空のパネルで起動し、その旨を表示します。これはデモの仕組みによるもので、製品の制限ではありません。 この説明内の動画では、実口座でのパネルの動作をご覧いただけます。 すべての機能を解説した詳しい マニュアル (英語)と、情報交換やお知らせのための AureusAI Trading Suite グループをご用意し
================================================================================ POC BREAKOUT - V20.72. Full Professional Grade Toolkit ================================================================================ POC Breakout is a full MetaTrader 5 trading dashboard for discretionary traders who want breakout signals, Point of Control (POC) context, volume profiles, order flow, market structure, news, alerts, and advanced trade planning in one professional workspace. Attached directly to you
EA Overfitter
Stephen J Martret
5 (3)
That backtest looks great. But will it still be making money tomorrow, next week, next month? EA Overfitter re-runs your EA on 100 price histories it has never seen. One score tells you if the edge is real. A backtest tells you what an EA did on one price history — the one that happened to occur. What you cannot tell from it is how much of that result was the strategy and how much was the particular path. EA Overfitter answers that. It builds up to 100 synthetic price histories your EA has n
Power Candles Strategy Scanner:自己最適化するマルチシンボル・セットアップファインダー わずかな動きのたびに鳴るスキャナーは、やがて無視されるようになります。慌ただしいローソク足の確定ひとつでアラートが次々と届き、本当にトレードしたい唯一のセットアップがノイズに埋もれてしまう。 Power Candles Strategy Scanner は、自己最適化する Power Candles エンジンを Market Watch のすべてのシンボルで動かし、あなた自身のフィルターを通過したものだけを知らせます。基準は、直近の確定足の強さ、セットアップのリスクリワード、リアルタイムのスプレッド、そしてあなたがトレードする資産クラスです。シンボルがリストに入った瞬間、スキャナーがあなたを呼びます。フィルターで外したものはすべて静かなまま。同じローソク足の確定で出たヒットは、すべて1通のメッセージにまとめて届きます。 購入前にパネルとすべてのフィルターをご覧ください。 スクリーンショット、全機能のツアー、Power Candles との連携ワークフロー: stein.
Timeless Charts
Samuel Manoel De Souza
5 (9)
Timeless Charts is an all-in-one trading utility for professional traders. It combines custom chart types such as Seconds Charts and Renko with advanced order flow analysis using Footprints , Clusters , Volume Profiles , VWAP studies, and anchored analysis tools for deeper market insight. Trading and position management are handled directly from the chart through an integrated trade management panel , while Market Replay and Virtual Accounts provide environments for practicing trading skills and
TelegramからMT5へ: 究極のシグナルコピーソリューション Telegram to MT5 を使えば、取引がシンプルになります。DLL を必要とせず、Telegram のチャンネルやチャットから MetaTrader 5 プラットフォームに取引シグナルを直接コピーできる最新ツールです。この強力なソリューションは、正確なシグナル実行、豊富なカスタマイズオプション、時間の節約、そして効率性の向上を実現します。 [ Instructions and DEMO ] 主な特徴 直接的なTelegram API統合 電話番号とセキュアコードで認証します。 ユーザーフレンドリーな EXE ブリッジを通じてチャット ID を簡単に管理できます。 複数のチャネル/チャットを追加、削除、更新して、同時に信号をコピーします。 高度なフィルターによる信号解析 例外的な単語 (例: 「レポート」、「結果」) を含む不要な信号をスキップします。 柔軟な SL および TP 形式 (価格、ピップ、ポイント) をサポートします。 価格ではなくポイントを指定するシグナルのエントリ ポイントを自動的に計算します。
MetaTrader 5 用トレーディングパネル — チャートとキーボードから行うプロフェッショナルなワンクリック取引 アクティブトレーダーのために設計された高機能 Trading Panel。標準の MetaTrader 操作よりも、はるかに速く、直感的に、そして効率的に取引を実行できます。 本パネルは、ポジション管理、未決注文管理、利益コントロール、執行スピードをひとつのプロフェッショナルなワークスペースに集約した実践的なソリューションです。 これは単なる補助ツールではありません。MetaTrader 5 のための本格的な trading cockpit です。チャートから直接操作し、キーボードで素早くコマンドを実行し、自動計算や視覚的なガイドを活用することで、手動トレードをより速く、より明確に、より快適にします。 このパネルを使えば、チャート上からワンクリックで注文を実行でき、標準の MetaTrader コントロールと比べて最大 30 倍速く取引操作を行うことができます。 新しいプレミアム版が利用可能です: VirtualTradePad PRO SE で取引ワークフローを強
次回アップデート — バージョン 2.52 近日公開!【新機能】 市場分析とトレードワークフローを強化する、4つの主要な新機能にご期待ください 皆様のトレードニーズに応える4つの新機能により、市場分析を次のレベルへと引き上げます。新機能をご紹介します: 1. TRADE OVERVIEW DASHBOARD 2. CONFLUENCE AT ZONE 3. STRONG & WEAK HIGH/LOW 4. OTE 1. TRADE OVERVIEW DASHBOARD 市場全体の状況をより簡単に把握できるダッシュボードです。トレード判断をサポートするガイダンスを提供し、市場分析とトレード計画を体系的に行えるよう支援します。すべてを1つの画面で確認できます。 マルチタイムフレーム市場概要(Multi-Timeframe Market Overview) 市場の方向性と価格構造をより明確に把握 市場状況をすばやく確認 体系的な市場分析とエントリー計画のためのガイダンス 2. CONFLUENCE AT ZONE 価格が重要なゾーンに入るとき…いくつのサポート要因が一致しているかを確認で
Telegram To MT5 — シグナルコピア Telegram チャンネルのトレードコールを、実際の MT5 注文に変換します — 自動で、好きなだけの口座に対応し、リスクとルールは完全にあなたの管理下に置けます。 Telegram To MT5 は、あなたが Telegram で既にフォローしている VIP / シグナルチャンネルを MetaTrader 5 端末に接続します。無料の付属デスクトップアプリがメッセージを読み取り(ボットを禁止しているチャンネルでも可能)、この EA があなたの口座でそれらを執行します — あなた自身のリスク設定、シンボルマッピング、テイクプロフィット処理、セッションおよびニュースフィルターを適用します。 これはシグナルコピアであり、ブラックボックス戦略ではありません。どのチャンネルを信頼するか、各トレードのロットと管理方法をあなたが決めます。 ステップバイステップの設定と付属アプリのインストールガイド 仕組み [あなたの Telegram チャンネル] -> [付属デスクトップアプリ] -> [MT5 + この EA] -> 注文 付属デスクトッ
Your EAs cannot see each other, but Anchor can. Anchor gives you one place to coordinate your EAs, manage risk, and decide when trading is allowed. It works alongside the trading bots you already use without any changes to them. The Problem One EA opens a trade. Then another starts trading. The next thing you know, you wake up to multiple grids built across your account. Each EA may be doing exactly what it was designed to do, but together they can place far more risk on your account than you in
Trade Indicator Assistant   is a powerful MT5 utility designed to turn indicators into automated trading systems. Its main feature is the ability to automatically detect an indicator’s   BUY and SELL signal buffers , without requiring you to know the buffer numbers, search through indicator settings, or modify the indicator source code. Bonus Indicator:   After purchasing Trade Indicator Assistant, contact me to receive   Trade Signal Pro   completely free as a bonus indicator. [Download Demo V
EA Auditor
Stephen J Martret
5 (7)
EA Auditor is an independent analysis tool for traders evaluating Expert Advisors and trading signals on MetaTrader 5. It audits backtest reports, reviews posted developer signals, and cross-verifies the two against each other to help traders assess strategies before committing capital. The MQL5 market offers a wide range of Expert Advisors from many developers, with varying approaches, quality, and transparency. EA Auditor provides a consistent, data-driven framework for reviewing them, answer
Trade Manager は、リスクを自動的に計算しながら、取引を迅速に開始および終了するのに役立ちます。 過剰取引、復讐取引、感情的な取引を防止する機能が含まれています。 取引は自動的に管理され、アカウントのパフォーマンス指標はグラフで視覚化できます。 これらの機能により、このパネルはすべてのマニュアル トレーダーにとって理想的なものとなり、MetaTrader 5 プラットフォームの強化に役立ちます。多言語サポート。 MT4バージョン  |  ユーザーガイド + デモ Trade Manager はストラテジー テスターでは機能しません。 デモについてはユーザーガイドをご覧ください。 危機管理 % または $ に基づくリスクの自動調整 固定ロットサイズを使用するか、ボリュームとピップに基づいた自動ロットサイズ計算を使用するオプション RR、Pips、または価格を使用した損益分岐点ストップロス設定トレーリングストップロス設定 目標に達したときにすべての取引を自動的に終了するための 1 日あたりの最大損失 (%)。 過度のドローダウンからアカウントを保護し、オーバートレードを防ぎます
MT5 to Telegram Signal Provider は、Telegramのチャット、チャンネル、またはグループに 指定された シグナルを送信することができる、完全にカスタマイズ可能な簡単なユーティリティです。これにより、あなたのアカウントは シグナルプロバイダー になります。 競合する製品とは異なり、DLLのインポートは使用していません。 [ デモ ] [ マニュアル ] [ MT4版 ] [ Discord版 ] [ Telegramチャンネル ]  New: [ Telegram To MT5 ] セットアップ ステップバイステップの ユーザーガイド が利用可能です。 Telegram APIの知識は必要ありません。必要な全ては開発者から提供されます。 主な特長 購読者に送信する注文の詳細をカスタマイズする機能 例えば、Bronze、Silver、Goldといった階層型のサブスクリプションモデルを作成できます。Goldサブスクリプションでは、すべてのシグナルが提供されます。 id、シンボル、またはコメントによって注文をフィルターできます 注文が実行されたチャート
RETAILBERG FOOTPRINT CHART PRO — Order-Flow Workspace for MetaTrader 5 Version 7.00  |  Professional System  |  31 tools  |  One chart A full 150-page illustrated User Manual is included. Please read the full manual to understand this feature packed footprint chart elements and ui. https://www.mql5.com/en/blogs/post/777982 DEMO / STRATEGY TESTER — PLEASE READ FIRST
DrawDown Limiter
Haidar Lionel Haj Ali
5 (23)
DrawDown Limiter v5.0 — 高度な口座保護コントローラー DrawDown Limiter v5.0 は、取引口座を監視し、設定されたリスク、利益、ニュース、スケジュール、ロールオーバー、またはポジション数の制限に達した際に自動的に対応する、クライアント側で動作する口座保護コントローラーです。 1つの専用チャートから、 手動取引、自動売買戦略、複数のExpert Advisor、指値・逆指値注文、保有ポジション を監視できます。口座全体を保護することも、Magic Numberを使用して特定のEAまたは複数のEAのみを監視することもできます。 DrawDown Limiter の目的は、単にドローダウンを表示することではありません。 設定した取引ルールを積極的に適用し 、保護条件が有効である限り、そのルールを継続的に実行することを目的としています。 DrawDown Limiter v5.0 は、損失額だけを監視するのではなく、戦略がいつ取引を継続できるのか、どのエクスポージャーを維持できるのか、いつ取引を停止すべきか、そして自動売買環境をいつ安全に再開できるのかま
VirtualTradePad PRO SE MT5 — MetaTrader 5向けプロフェッショナル取引コントロールセンター VirtualTradePad PRO SE は、 MetaTrader 5 向けのプレミアムなチャートベースの取引パネルであり、トレード管理ワークスペースです。より速い執行、明確なポジション管理、構造化されたトレード管理、視覚的なレベル計画、そしてチャート上で完結するプロフェッショナルなワークフローを求めるトレーダー向けに設計されています。 これは単なる BUY / SELL パネルではありません。PRO SE は、手動取引、予約注文、ポジション管理、部分決済、バスケット損益管理、平均化レベル、ATMルール、シグナル監視、リアルタイム市場情報、ストラテジーテスター (Strategy Tester) ワークフロー、VPS向け運用を、1つの連携されたインターフェースに統合します。 MT4版 | 完全な説明とスクリーンショット | 購入方法 | インストール方法 | ログファイルの取得方法 | テストと最適化の方法 | Expforex のすべての製品 PRO
Trader Evolution
Siarhei Vashchylka
5 (7)
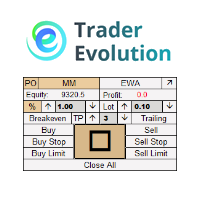
" Trader Evolution " - A utility designed for traders who use wave and technical analysis in their work. One tab of the utility is capable of money management and opening orders, and the other can help in making Elliott wave and technical analysis. Manual (Be sure to read before purchasing) | Version for MT4 Advantages 1. Trading in a few clicks. Immediate and pending orders are available in the panel 2. Money management. The program automatically selects the appropriate lot size 3. Simplifies
Trade copier MT5
Alfiya Fazylova
4.61 (57)
Trade Copierは、取引口座間の取引をコピーして同期するように設計された専門的なユーティリティです。 コピーは、同じコンピューターまたはvps にインストールされている、サプライヤーのアカウント/端末から受信者のアカウント/端末に行われます。 購入する前に、デモ アカウントでデモ バージョンをテストできます。 デモ版 こちら 。 詳細な説明は こちら 。 主な機能と利点: MT5ネッティングアカウントを含む、MT5> MT5、MT4> MT5、MT5> MT4のコピーをサポートします。 高いコピー速度(0.5秒未満)。 ベンダーモードと受信者モードは同じ製品内に実装されています。 チャートから直接リアルタイムでコピーを制御できる、簡単で直感的なインターフェイス。 接続が切断されたり、端末が再起動されたりしても、設定と位置が失われることはありません。 コピーするシンボルを選択できます。また、受信者のシンボルを置き換えることもできます(例:EURUSD> USDJPY)。 各シンボルごとにコピーの個別設定を行うことができます。 バックコピーをサポートします。 特定の注文のみのコピー
AW Trade Manager
AW Trading Software Limited
AW Trade Manager は、チャート上のリスクリワードツールを備えた MetaTrader 5 用のトレードパネルです。トレードは Entry、Stop Loss、Take Profit の線をマウスでドラッグして計画します。ラベルには価格、距離、金額が表示され、ゾーンで利益と損失を示し、ロットはリスクから計算されます。発注前には確認ウィンドウに、リスク、証拠金、ポジションのルールを含むトレード全体が表示されます。 マニュアルと説明 -> こちら / 無料 LIVE デモ版 -> こちら エントリー後のポジション管理のために、パネルにはブレークイーブン、トレーリング、部分決済、時間による決済、非表示の水準が用意されています。これらは Rules タブですべての新規トレードに対して、またはポジションのウィンドウで個別のポジションに対して有効にします。個々のトレードとは別に、口座のリスク制限、バスケット、スケジュールされたタスク、アラート、MT5 の経済指標カレンダーが機能します。 特長: チャート上のトレードプラン: ラベル、ゾーン、R:R 付きの Entry、Stop Los
作者のその他のプロダクト
See every hour against its own past Session Pulse measures how each hour of the week usually behaves. It reads the symbol's H1 history on your broker and builds a weekday by hour fingerprint, Monday to Friday, hour by hour. For each hour of each weekday it stores the usual range, the usual spread and how often that hour produced a spike. Then it puts the live market next to that fingerprint. Main features 1. Weekday by hour fingerprint. Monday 09:00 and Friday 09:00 are different hours, and S
Every fair value gap on your chart shows how much of it is already filled, and how often gaps on this symbol and timeframe were filled before. Rift measures every fair value gap. Each gap carries a live fill meter, and the panel tells you what the gaps of this symbol and timeframe did in the past on your broker's own data: how often they were filled, and how long it usually took. You see at a glance which gaps are fresh, which are half used, and how far price is from the next one, in the right
Trading sessions set in each city's own clock, with daylight saving handled for you, and each session measured against the average daily range (ADR). With Meridian Sessions you enter London, New York, Tokyo and Sydney in their own city time. The indicator converts them to your broker's clock day by day, including the weeks when Europe, the United States and Australia change their clocks on different dates. For each session the panel tells you how big its range is, what share of the ADR it used
Day, week and month VWAP with sigma bands, a manual anchored VWAP you set with one click, and six automatic anchors. Every line gets a respect score measured on your own chart, so you can see which VWAPs price has actually reacted to. Fulcrum VWAP Pro draws the volume weighted average price from several starting points at once. For each line it keeps a record of how price behaved around it: the respect score, shown next to the line and in the panel. Automatic anchors with a weak record switch t
Support and resistance levels from six kinds of sources, each with a biography: how many times price tested it, how many breaks failed, the share of tests that held, and whether a break was clean or suspected. Broken levels flip role, and the strongest overlaps become confluence zones. Levels Memory collects levels from swings, higher timeframe swings, the previous day, week and month, floor pivots, Fibonacci retracements and round numbers. Levels that sit close together are merged into one lev
Is the edge of your strategy robust, or did the backtest just get lucky? Robustness Lab takes the closed trades of a strategy and puts them through a set of stress tests: Monte Carlo risk, trade order, the best trades removed, luck, extra costs, missed trades and stability over time. The answer is one clear verdict and an A to F grade, with every test shown on one panel. It reads the trades from your account history, from a Strategy Tester or trade history report saved as HTML, or from a CSV fi
How much stress and how much size can your trading take? Risk Scenario Lab takes the closed trades of a strategy and re-runs them under harder conditions: higher costs, bigger losses, smaller wins, other lot sizes and compounding. It shows where the edge breaks, the largest lot size that keeps the risk inside your own limits, and what the positions open right now would lose in a bad move, all on one panel. It reads the trades from your account history, from a Strategy Tester or trade history re
Brick Lab builds Renko, Range and Seconds charts from real ticks and shows what spread and commission cost you on every brick, session by session. It helps you choose a brick size your broker can afford. What you get - Renko, Range and Seconds charts built from real ticks inside the EA, not from M1 bars. No external generator. - The cost of one brick after spread and commission, for each trading session, with a warning when a session gets too expensive. - A suggested brick size based on normal
One question: after an economic release, did the first move hold or fade? AfterRelease takes the most recent high-impact releases on your broker's calendar and prices and shows how many times the first move held and how many times it faded a few bars later, always with the number of cases. - TODAY'S CASE: one button loads today's release that already has an actual value, and the market it moves. - Choose the market and timeframe in the inputs; the panel always says which market it analysed. -
How old is the last swing high and swing low that has not been broken yet - and what happened to past swings of the same age? ExtremeAge shows both live swings on one panel: price, time and age in bars. Below them it lists past swings from your broker's history that reached a similar age, and how many of them stayed intact or were broken soon after, always with the number of cases. - Pick any market from the panel: forex, metals, indices, energies, crypto, stocks. Broker symbol names with suff
Precision Lot gives you the lot size that keeps your real loss at the stop within your risk. Besides the stop distance it counts the live spread, the slippage you really got on your past stop-outs, and the commission. What you get - Drag the ENTRY and SL lines on the chart, or use a fixed stop or an ATR stop. - The real-cost lot next to the textbook lot, so you see the difference at a glance. - Your own costs: stop slippage and commission measured on your closed trades. Until you have history,
Know what your stop cannot protect, before you hold overnight. Session Split separates what a symbol did inside the session from what it did overnight, measures how often the night jumped past a stop, and gives a hold-or-flat reading for the coming night. It never trades on live charts. Main features Overnight vs in-session: total move and how often each part was up, over the trading days you choose. Night risk: how much of the day-to-day movement happens outside the session. Stop Leak: how ofte
A lab with one question: after a large move, did price go further, give half of it back, or give all of it back? GiveBack looks at the past large moves of the symbol on your own broker's history and shows how many went further, how many gave half back and how many gave everything back, always with the number of cases (N). No DLL, no web requests, no trades on live charts (in the Strategy Tester only, the demo presses the panel buttons and opens one minimum-lot test trade so the automatic check c
One panel to open trades sized by risk, manage them in R and keep your account inside its limits: daily loss, drawdown, daily target, news and spread - with a clear lamp that tells you whether a new trade is allowed. Main features - Orders sized by risk % of equity or a fixed lot. The risk lot includes your broker's commission; orders whose smallest lot would risk too much are refused. A margin cap cuts lots that would use too much free margin. - Stop loss required by default; a warning (or, i
Prop Pass Replays takes your real closed trading days and replays them thousands of times under the rules of your prop firm phase. It counts how many replays reach the target and how many break the daily or maximum loss first. These are counts of your past days, not a forecast. What you get - Ready presets for common 2-step and 1-step phases, or your own rules: target, daily loss, maximum loss (static or trailing), minimum days and deadline. - Clear counts: replays passed out of the total, rep
Your closed trades, measured in R. R Ledger finds the habits that cost you money: revenge trades, trades without a stop, oversized risk, and trading outside your hours. It shows what each habit cost, and when you trade best. It never trades on live charts. Main features Every closed trade is turned into R (the money you had at risk at entry). For a trade opened without a stop, R uses the typical risk of your trades that had a stop. Trades are then split into rule-breaking and clean, so one line
A map of every hour of every weekday: how often that hour closed up, its average return, and whether that tendency still held in later weeks. Any symbol from your terminal. It never trades on live charts. Main features One cell per weekday and hour. Colour shows how often that hour closed up over the lookback you set. Hover a cell for the up share, the average return, and whether the same direction kept showing up in later weeks. Only closed bars are counted. A cell stays blank until there are e
フィルタ:
レビューなし
レビューに返信