Reflection Candles Chart

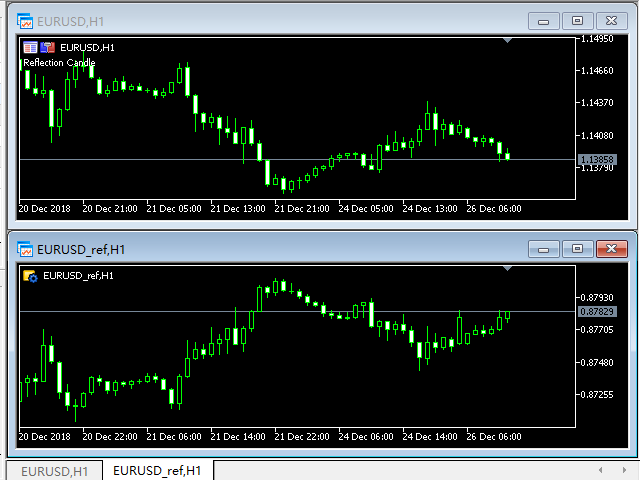
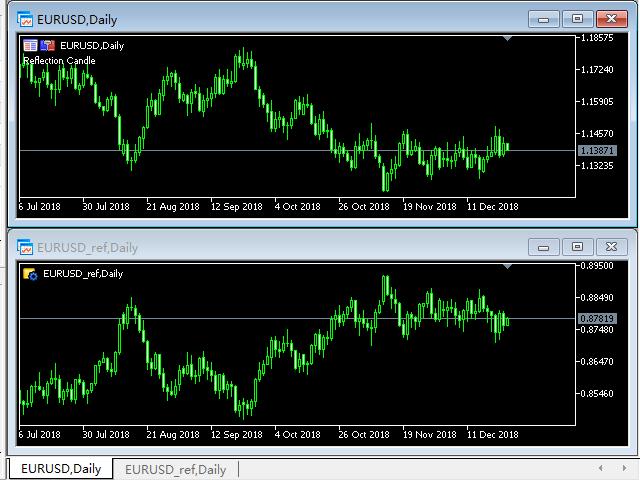
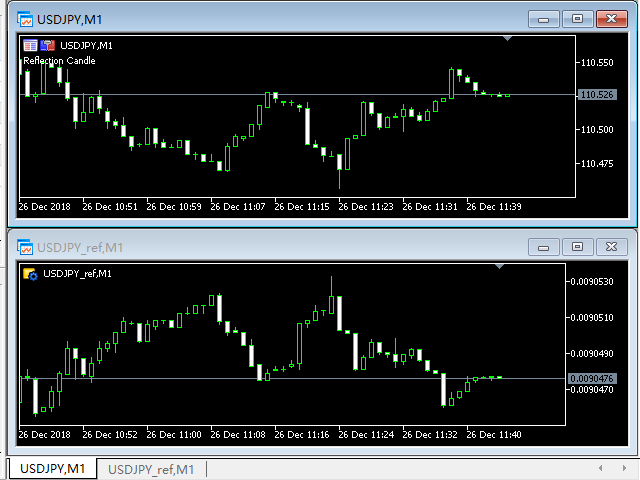
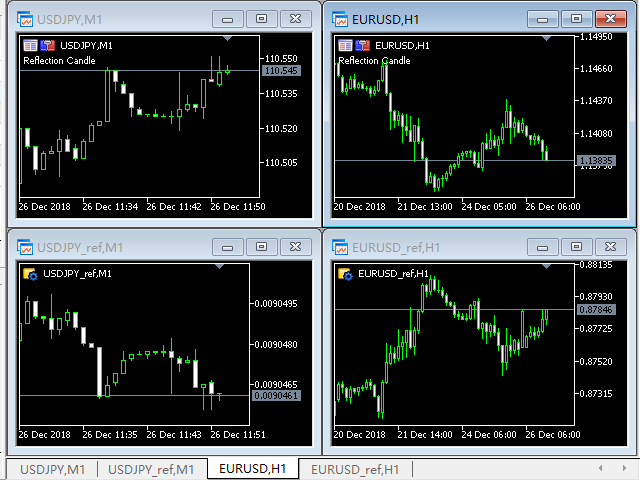
This tool is used to generate a K - line reflection chart of a currency pair for foreign exchange transactions.

For example, if the currency pair is EURUSD, a custom currency pair named EURUSD_ref is generated and a chart for that currency pair is opened.
The price of a custom pair of currency is the inverse of the price of the original pair, which is the equivalent of a new pair of currency, the USDEUR.

The usage is simple, put it on any chart, the new chart will open, and then draw the corresponding price K graph in real time.
However, you cannot load an application to run on a reflection diagram generated by an indicator.


おすすめのプロダクト
RSI Currency Strength Meter is a powerful and elegant multi-currency indicator that measures the real-time relative strength of the 8 major currencies using RSI logic. By calculating the smoothed performance of each currency across its major pairs and applying the RSI formula, it delivers clean and responsive strength lines that make it easy to spot which currencies are truly strong or weak at any moment. This indicator is particularly useful for visualizing currency correlations and divergence
CosmiCLab SMC FIBO CosmiCLab SMC FIBO is a professional trading indicator designed for traders who use Smart Money Concepts (SMC), market structure analysis and Fibonacci retracement levels. The indicator automatically detects market swings and builds Fibonacci levels based on the latest impulse movement. It also identifies market structure changes such as BOS (Break of Structure) and CHOCH (Change of Character), helping traders understand the current market direction. CosmiCLab SMC FIBO also pr
概要 Candle Timer Countdown Pro は、現在のローソク足が終了するまでの残り時間を、滑らかで正確なカウントダウンとして表示します。さらに、円形のプログレスアーク(進行表示)を組み合わせることで、残り時間を瞬時に視覚的に把握できます。 ティック間で停止したり、時間がずれてしまう他のタイマーとは異なり、本インジケーターはサーバー時間の補間(Server Time Interpolation)を使用し、M1 から MN まであらゆる時間足で途切れのないスムーズなカウントダウンを実現します。 1分足でのスキャルピングでも、H4でのスイングトレードでも、現在のローソク足が正確にいつ確定するのかを把握することで、エントリータイミングの最適化、ローソク足パターンの確認、そして早すぎる判断の回避に役立ちます。 このタイマーが他と違う理由 多くの MT5 用キャンドルタイマーは TimeCurrent() のみに依存しており、新しいティックが到着したときにしか更新されません。低ボラティリティ時や上位時間足では、ティックの間隔が数秒空くことがあり、その間タイマーが停止し、その後突
Broker Connection Monitor - Keep Your Trading Secure! Ensure Stable Trading with Real-time Broker Connection Monitoring! Are you tired of unexpected connection drops affecting your trades? Do you want to monitor your broker's connection status, server speed, and lost connections in real-time? The Broker Connection Monitor is a must-have utility that gives you a clear, live status of your trading environment directly on your chart! What Does This Utility Do? Tracks Broker Connection – Instantly
Automated Report Generator for the Spanish Treasury This utility allows you to generate automated reports for the Spanish treasury with several advantages: A detailed report is generated in an HTML file in the MetaTrader 5 base directory. This report includes all operations individually. For accounts nominated in another currency, the report will automatically generate a profit column in euros using the same broker data. Profits in other currencies will be accounted for as indicated by the Spa
はじめに これは、トレンドの乖離を検出するために設計されたプルバック EA です。これは、「占中占占」理論の最初のタイプの売買ポイントに相当します。この EA は、非常に高い利益率を備え、一貫した長期的な収益性を実現します。ダイナミック グリッド トレーディングを採用しているため、さまざまな市場状況にシームレスに適応できます。 新しい EA プロモーション価格: $99 → $149 ライブ シグナル https://www.mql5.com/en/signals/1080741 ファイルの設定 https://c.mql5.com/6/954/Profit.set https://c.mql5.com/6/954/Low_Risk.set 機能 自動調整に仮想注文を利用 変化する市場状況に適応 スプレッドとプラットフォーム仕様に対する感度が低い マーチンゲールを使用せずに動的グリッドを採用 (プログラム可能) 他の EA と互換性あり 5 年間の最適化されたフレームワークを使用したオブジェクト指向プログラミング 使用方法 時間枠: M15 主要ペア: GBPUSD、AUDUSD
AUTOMATIC TRADE COPIER for local *   use . (copy trades between several metatrader terminals on the local computer/ *or GLOBALLY after setting your network /server !) Can copy trades from one or   several main MT5 accounts   to several MT5 and MT4 accounts   (no limit). For MT5 to MT4 copy you have to also get version for Metatrader 4 here : https://www.mql5.com/en/market/product/80842 - very fast execution (theoretically up to 5ms delay, depends on computer speed) - user can set speed of copy
Check out my TRADE PLANNER MT5 – strongly recommended to anticipate account scenarios before risking any money. This is a multi-symbol, multi-timeframe, table-based indicator for MetaTrader 5 that identifies 46 types of candlestick formations. Each formation has its own image for easier recognition. The indicator includes popular patterns such as Engulfing, Hammer, Three Line Strike, Piercing, and Doji-like candles. You can check the full list of patterns in the screenshots below. Also you can
Candlestick Pattern Scanner is a multi-timeframe and multi-symbol dashboard and alert system that checks all timeframes and currency pairs for different candlestick patterns that are formed in them. Scanner is integrated   with support and resistance zones so you can check the candlestick patterns in most important areas of the chart to find breakout and reversal patterns in the price chart. Download demo version   (works on M4,M6,M12,H3,H8 timeframes and 20 symbols of Market Watch window) Read
This tool will help you calculate position size based on the lines that you draw on the chart. It will automatically create the trading setup in the background and provide adaptive buttons for market and pending order confirmation. The design is very simple and straightforward, with just a single click you will be able to place the trading setup. Features Set your risk based on your predefined amount or percent of your account balance. Drag the lines to define the entry, take profit target and s
Advantage The analyzer provides an opportunity to examine correlation in history, for example, for the previous month excluding the current one, thus allowing you to evaluate symbol movement in history. It can be conveniently used in conjunction with the LineSyncMirrorCharts analyzer. Charts are synchronized by a market type: Forex, CFD, Futures, and Indices. The analyzer calculates the distance covered by the price on a specified period in points. The tool fits pairs and portfolio traders. Des
Trading Utility for Forex Currency Pairs Only not for Gold  Functions Auto Lot Calculation based on Risk Auto stoploss  Auto TakeProfit Breakeven Auto Close Half % Close in percentage with respect to the PIPs Pending Orders BuyLimit Sell Limit with distances BuyStop Sell Stop    with distances Trading Informations Risk in percentage For Multiple trades Combine Takeprofit and Combine Stoplosses
XagusdHamzai85pattern – Visual Pattern Detector for XAGUSD XagusdHamzai85pattern is a purely visual Expert Advisor designed for advanced technical analysis of Silver (XAGUSD) . It does not open any trades : its purpose is to clearly and instantly display price action patterns directly on the chart , making it ideal for backtesting, pattern study, and manual decision support . Detected Patterns The EA automatically detects and draws signals for the following classic patterns: Bullish & Bearish En
Order Book, known also as Market Book, market depth, Level 2, - is a dynamically updated table with current volumes of orders to buy and to sell specific financial instument at price levels near Bid and Ask. MetaTrader 5 provides the means for receiving market book from your broker, but in real time only, without access to its history. The indicator OrderBook Cumulative Indicator accumulates market book data online and visualizes them on the chart. In addition, the indicator can show the market
リアルタイム価格と総利益表示インジケーター ライブトレードと画面共有に最適 デイトレーダー、スキャルパー、ライブストリーミングトレードセッション専用に設計 このプロフェッショナルインジケーターは、チャート上でリアルタイム価格表示と包括的な利益追跡を提供します - 高頻度取引とライブトレーディング配信に不可欠です。 主要機能 リアルタイム価格表示 毎秒ライブビッド価格更新 全シンボルタイプのプロフェッショナル書式設定 貴金属向けゴールド/XAU特別書式設定 画面共有に最適な大型明確表示 デイトレーディング決定のための瞬時価格更新 包括的利益追跡 トレーディング履歴からのアカウント総利益 トレード終了時のリアルタイム利益更新 カスタム追加利益金額 手数料とスワップの包含 プラス/マイナス指標付きプロフェッショナル利益書式設定 パフォーマンス最適化 スマートキャッシュシステム - 最小CPU使用量 1秒更新間隔 - 稲妻の速さ 効率的なタイマーベース更新 リアルタイム取引監視 プロフェッショナルエラー処理 高度なカスタマイズ 調整可能なフォント名とサイズ 利益と損失のカスタム色 チャート上
FREE
自動注文とリスク管理のためのユーティリティ。利益を最大化し、損失を抑えることができます。トレーダーのための練習トレーダーによって作成されました。このユーティリティは使いやすく、トレーダーが手動で、またはアドバイザーの助けを借りて開いた成行注文で機能します。マジックナンバーで取引をフィルタリングできます。このユーティリティは、同時に任意の数の注文を処理できます。 次の機能があります。 1.ストップロスとテイクプロフィットレベルの設定; 2. トレーリング ストップ レベルで取引を終了します。 3. 損益分岐点の設定。 ユーティリティは次のことができます。 1. オーダーごとに個別に作業します (レベルはオーダーごとに個別に設定されます)。 2. 一方向注文のバスケットを操作します (レベルはすべての注文に共通に設定され、BUY と SELL は個別に設定されます)。 3. 多方向注文のバスケットを操作します (レベルはすべての注文に共通に設定され、BUY と SELL が一緒に設定されます)。 オプション: STOPLOSS - =-1 が使用されていな
以下是为您翻译的日语版本。为了符合日本交易者的使用习惯,我使用了专业且简洁的表达方式,并特别强调了“纪律性”和“精准度”。 同时也考虑到了您将来要加入的“日损限额进度条”和“圆角UI”设计,文字风格偏向现代与高端感。 Prop Calculator Assistant  計算ミスによるプロップファーム口座の失格をゼロに。リスク管理は「アシスタント」に任せましょう。 Prop Calculator Assistant は、FTMOやなどのチャレンジ合格を目指すトレーダーや、プロップ口座を運用するプロトレーダーのために設計された究極のトレード管理パネルです。暗算や手動での注文修正を排除し、独自のビジュアル・インターフェースによって、あなたのルールを厳格に守り抜きます。 これは、相場を予想する自動売買(EA)ではありません。精度を追求する裁量トレーダーのためのプロ仕様**「コックピット」**です。あなたがセットアップを決めれば、アシスタントが瞬時にロット数を計算し、発注からエグジットまでを自動で管理します。 ️ プロップトレーダーに選ばれる理由 ロット計算のミスを完全排除: チャート上の
MT5 Telegram Notifier — Real-Time Account Monitoring Stay informed and in control of your trading account from anywhere. This utility Expert Advisor sends instant notifications and detailed reports directly to your Telegram chat. Key Benefits Real-Time Alerts : Receive notifications when positions open, close, or pending orders change. Risk Management : Margin level alerts help you act before critical thresholds. Hedging Support : Displays every position individually using ticket-based logic. O
Price Magnet — Price Density and Attraction Levels Indicator Price Magnet is a professional analytical tool designed to identify key support and resistance levels based on statistical Price Density. The indicator analyzes a specified historical period and detects price levels where the market spent the most time. These zones act as “magnets,” attracting price action or forming a structural base for potential reversals. Unlike traditional Volume Profile tools, Price Magnet focuses on price-time d
EPo-CreW Forex Super ORB-H4 インジケーターへようこそ! 本ガイドでは、市場の最初の4時間のオープニングレンジに基づいて、高確率のトレード機会を特定するためのこの強力なツールの使い方を解説します。 初心者の方から経験豊富なトレーダーまで、このシステムはより高い自信と一貫性を持って取引する手助けとなります。 これはデモ製品です。インストール日から30日後に有効期限が切れます。フルバージョンはこちら: https://www.mql5.com/en/market/product/160926?source=Site OR https://t.me/Fundamental_fx 取引:すべての通貨、金(GOLD)とBTCUSD NB: M5 タイムフレームに切り替えることを確認してください。このインジケーターを使うのに最適なタイムフレームです。 トレーディング戦略 戦略1:ブレイクアウト & リトレースメント(メイン) SELL(売り)セットアップ: 価格が青いラインを上にブレイクする(高値ブレイク) ゴールドの BREAKOUT 矢印が表示される 価格が再び青い
FREE
この情報インジケーターは、アカウントの現在の状況を常に把握したい人にとって役立ちます。 VERSION MT 4 -   More useful indicators このインジケーターには、ポイント、パーセンテージ、通貨での利益、現在のペアのスプレッド、現在の時間枠でバーが閉じるまでの時間などのデータが表示されます。 チャート上に情報線を配置するには、いくつかのオプションがあります。 価格の右側 (価格の後ろにあります)。 コメントとして (グラフの左上隅に); 画面の選択した隅。 情報区切り記号を選択することもできます。 | / \ # このインジケーターは使いやすく、非常に有益です。設定で不要な情報項目を無効にすることも可能です。 設定 外観の種類     - 情報行の表示タイプ。次の 3 つのオプションがあります。 価格に従ってください     - 価格に従う。 コメントとして     - コメントとして; 画面の選択した隅に     - 画面の選択した隅にあります。 添付用グラフコーナー     - 表示タイプを選択した場合 画面の選択されたコーナーでは、この項目を使用して
FREE
The Ultimate Ichimoku MTF Dashboard: Your All-In-One Trading Edge Transform Your Trading with One Powerful Indicator Imagine having a professional trading assistant that monitors multiple timeframes simultaneously, identifies high-probability entries, warns you of potential reversals, and provides clear risk management guidance-all in one clean, intuitive display. That's exactly what the Ichimoku MTF Dashboard delivers.     Why This Isn't Just Another In
インディケータは現在のクオートを作成し、これを過去のものと比較して、これに基づいて価格変動予測を行います。インジケータには、目的の日付にすばやく移動するためのテキスト フィールドがあります。 オプション: シンボル - インジケーターが表示するシンボルの選択; SymbolPeriod - 指標がデータを取る期間の選択; IndicatorColor - インジケータの色; HorisontalShift - 指定されたバー数だけインディケータによって描画されたクオートのシフト; Inverse - true は引用符を逆にします。false - 元のビュー。 ChartVerticalShiftStep - チャートを垂直方向にシフトします (キーボードの上下矢印)。 次は日付を入力できるテキストフィールドの設定で、「Enter」を押すとすぐにジャンプできます。
Smart Trading Monitor - Real-Time Position Tracking, P/L Analysis & Alert System Real-Time Monitoring: Automatically tracks open/closed positions, clearly displays yesterday's/previous day's P/L - no more manual calculations! Smart Alerts (Premium only): Instant push notifications + sound alerts for position changes - never miss a trading opportunity! Simple & Intuitive: One-click installation with key data displayed directly on charts for faster decision making High Compatibility: Su
市場ボリュームプロファイル指標 + スマートオシレーター。通貨ペア、株式、先物、暗号資産など、ほぼすべての銘柄で動作し、リアルボリュームとティックボリュームの両方に対応しています。プロファイル作成範囲は、1週間や1ヶ月などの自動設定のほか、境界線(赤と青の2本の垂直線)を動かして手動で設定することも可能です。ヒストグラム形式で表示され、特定の価格レベルにおけるヒストグラムの幅は、その価格帯で行われた取引量(約定数)を表します。 Mode level line color パラメータを使用すると、価格が反発する可能性が高い重要なボリュームレベルを自動表示できます。また、 Maximum color パラメータは、指定した範囲全体で最も取引が集中した最大ボリュームレベルを個別に表示します。 スマートオシレーターは買われすぎ・売られすぎのゾーンを表示します。複数のインジケーターからの情報を分析し、処理されたデータに基づいて、買われすぎと売られすぎのゾーンを対応する色で塗りつぶします。 Volume every day では、 Range period パラメータでプロファイル作成の時間間隔を
Cumulative delta indicator As most traders believe, the price moves under the pressure of market buying or selling. When someone redeems an offer standing in the cup, the deal is a "buy". If someone pours into the bid standing in the cup - the deal goes with the direction of "sale". The delta is the difference between purchases and sales. A cumulative delta - the difference between the cumulative sum of purchases and sales for a certain period of time. It allows you to see who is currently contr
Position Stress Monitor Position Stress Monitor is a utility for MetaTrader 5 designed to visualize position structure and risk conditions directly on the chart through a compact panel. The tool does not attempt to predict the market or generate entry signals. Instead, it focuses on a different problem that many traders encounter in practice: understanding how a group of positions behaves as a whole. In real trading, especially when managing multiple entries or holding both buy and sell positio
概要 ATRマルチレベルおよび移動平均バンドインジケーターは、トレーダーが市場のトレンド、サポートおよびレジスタンスレベル、ボラティリティを特定するのを支援する強力なツールです。このインジケーターは、価格変動の周りにビジュアルバンドを作成するために、複数の移動平均とATR(平均真の範囲)乗数を組み合わせています。これにより、トレーダーは潜在的な反転ポイント、トレンド条件、および市場の統合ゾーンを検出するのに役立ちます。 特徴 複数バンドの視覚化: トレンドを簡単に識別するために、赤、オレンジ、黄色、緑、青、紫などの異なる色で、6つの動的バンドを表示します。 ATRボラティリティバンド: 市場のボラティリティに基づいてバンドのグラフを調整し、反転または価格の継続の可能性について明確な視覚的信号を提供します。 カスタマイズ可能なパラメーター: ATR乗数と移動平均の期間を調整可能で、市場の異なる条件やトレーディング戦略に適応します。 トレンドの明確な識別: バンドはボラティリティに応じて拡張および収縮し、トレーダーがトレンド、統合期間、および潜在的なブレイクポイントを簡単に視認できます。
FREE
AURA SMC QUANTUM V1.01 code in English, structured for a professional presentation or MQL5 Market description: AURA SMC QUANTUM V1.01 | Logic Breakdown The Aura SMC Quantum is an advanced automated trading system (EA) specifically engineered for Gold (XAUUSD) on the H4 timeframe. It combines high-probability Smart Money Concepts (SMC) with a sophisticated Hybrid Grid management system. 1. Market Analysis Strategy (SMC & Trend Filter) The core "intelligence" of the EA relies on a dual-layer confi
Gold Venamax - これは最高の株式テクニカル指標です。 指標アルゴリズムは資産の価格変動を分析し、ボラティリティと潜在的なエントリーゾーンを反映します。 インジケーターの機能: これは、快適で収益性の高い取引のためのマジックとトレンド矢印の 2 つのブロックを備えたスーパー インジケーターです。 チャート上にブロックを切り替えるための赤いボタンが表示されます。 マジックはインジケーター設定で設定されているため、異なるブロックを表示する 2 つのチャートにインジケーターをインストールできます。 Gold Venamax は、異なる矢印バッファー (GV と SD) を備えた 2 つのチャートに配置できます。 これを行うには、設定で異なる Magic を選択する必要があります。たとえば、あるマジック = 999、別のマジック = 666 を選択します。次に、チャート上の赤いボタンで矢印バッファを選択できます。 インジケーター設定の各矢印バッファー (GV および SD) には、快適で収益性の高い取引のための個別の矢印フィルターがあります (UseFiltrGV = true;
このプロダクトを購入した人は以下も購入しています
Trade Assistant MT5
Evgeniy Kravchenko
4.42 (209)
取引 ごとのリスクの 計算、新規注文 の 簡単 な 設置、部分的 な 決済機能 を 持 つ 注文管理、 7 種類 のトレーリングストップなど 、便利 な 機能 を 備 えています 。 追加の資料と説明書 インストール手順   -   アプリケーションの手順   -   デモアカウント用アプリケーションの試用版 ライン機能 チャート上にオープニングライン、ストップロス、テイクプロフィットを表示します。この機能により、新規注文を簡単に設定することができ、注文を出す前にその特徴を確認することができます。   リスク計算 リスク計算機能は、設定されたリスクとストップロス注文のサイズを考慮して、新規注文のボリュームを計算します。ストップロスの大きさを自由に設定できると同時に、設定したリスクを守ることができます。 Lot calc ボタン - リスク 計算 を 有効 / 無効 にします 。 Risk フィールドでは 、必要 なリスクの 値 を 0 から 100 までのパーセンテージまたは 預金通貨 で 設定 します 。 設定」 タブで 、 リスク 計算 の 種類 を 選択 します :「 $ 通
Trade Manager EAへようこそ。これは、取引をより直感的、正確、そして効率的にするために設計された究極の リスク管理ツール です。これは単なるオーダー実行ツールではなく、包括的な取引計画、ポジション管理、リスク管理のためのソリューションです。初心者から上級者、迅速な実行を必要とするスキャルパーまで、Trade Manager EAはあらゆるニーズに対応し、為替、指数、商品、暗号通貨などさまざまな市場で柔軟に対応します。 Trade Manager EAを使用すると、複雑な計算が過去のものになります。市場を分析し、エントリーポイント、ストップロス、テイクプロフィットのレベルをチャート上のラインでマークし、リスクを設定するだけで、Trade Managerが最適なポジションサイズを即座に計算し、SLとTPをピップ、ポイント、口座通貨でリアルタイムに表示します。すべての取引が簡単かつ効果的に管理されます。 主な機能: ポジションサイズ計算機 :定義されたリスクに基づいて取引サイズを瞬時に決定します。 簡単な取引計画 :エントリー、ストップロス、テイクプロフィットを設定するためのド
Local Trade Copier EA MT5
Juvenille Emperor Limited
4.96 (136)
Local Trade Copier EA MT5 による、驚くほど高速な取引コピーを体験してください。1分で簡単にセットアップできるこの取引コピー機は、同じWindowsコンピュータまたはWindows VPS上の複数のMetaTrader端末間で取引をコピーすることができ、0.5秒未満の高速コピースピードを実現します。 初心者であろうとプロのトレーダーであろうと、 Local Trade Copier EA MT5 には、あなたの特定のニーズに合わせてカスタマイズするための幅広いオプションが用意されています。これは、利益の可能性を高めたい人にとって究極のソリューションです。 今すぐ試してみて、これが市場で最も速くて簡単なトレードコピー機である理由を理解してください。 ヒント: デモアカウントで Local Trade Copier EA MT5 デモバージョンをダウンロードして試すことができます: ここ ダウンロードした無料のデモ ファイルを MT5 >> ファイル >> データ フォルダを開く >> MQL5 >> Experts フォルダに貼り付けて、ターミナルを再起動しま
TradePanel MT5
Alfiya Fazylova
4.87 (153)
Trade Panelは多機能なトレーディングアシスタントです。アプリには手動取引用の50以上のトレーディング機能が搭載されており、ほとんどの取引作業を自動化することができます。 注意!割引は2026年5月5日まで有効です。2026年5月6日から価格は100ドルになります。 購入前に、デモアカウントでアプリのデモ版をテストすることができます。デモアカウント用のアプリの試用版をダウンロードするには、次のリンクをご利用ください: https://www.mql5.com/en/blogs/post/750865 。 完全な手順 こちら 。 取引。 ワンクリックで取引操作を行うことができます: リスクを自動計算して指値注文やポジションを開く。 複数の注文やポジションをワンクリックで開く。 注文のグリッドを開く。 保留中の注文やポジションをグループごとに閉じる。 ポジションの方向を反転(Buyを閉じてSellを開く、またはSellを閉じてBuyを開く)。 ポジションをブロックする(不足している量のポジションを開くことでBuyとSellのポジション量を等しくする)。 すべてのポジションを部分的に
ベータリリース Telegram to MT5 Signal Trader はまもなく正式なアルファ版をリリースします。いくつかの機能はまだ開発中で、小さな不具合に遭遇する可能性があります。問題が発生した場合はぜひご報告ください。皆さまのフィードバックがソフトウェア改善に役立ちます。 Telegram to MT5 Signal Trader は、 Telegram のチャンネルやグループからの取引シグナルを自動的に MetaTrader 5 にコピーする強力なツールです。 パブリックおよびプライベートの両方のチャネルに対応し、複数のシグナル提供元を複数のMT5口座に接続可能です。ソフトウェアは高速で安定し、すべての取引を細かく制御できます。 インターフェースは直感的で、ダッシュボードとチャートは見やすく設計されており、リアルタイムで動作状況をモニターできます。 必要環境 MQL の制限により、EA は Telegram と通信するためのデスクトップアプリが必要です。 インストーラーは公式の インストールガイド にあります。 主な機能 マルチプロバイダー: 複数の Telegram
Farmed Hedge Yield Farming | All Markets (Manual - Hybrid - Semi/Automated EA) MULTI-ASSET SUPPORT Trade any asset available on your broker - Forex: Major, Minor, Exotic pairs - Crypto: BTC, ETH, XRP, SOL, BNB - Stocks: Apple, Tesla, Amazon, Google, etc. - Commodities: Gold, Silver, Oil, Gas - Indices: US30, NAS100, SPX500, DAX40 - Any CFD your broker offers VERIFIED TRADING RESULTS - Farmed Hedge Yield Axi Copy:  https://www.mql5.com/en/signals/2356376 - Farmed Hedge Yield Exn Copy:   https:/
Power Candles Strategy Scanner - 自動最適化型マルチシンボル設定ファインダー パワーキャンドル・ストラテジー・スキャナーは 、パワーキャンドル・インジケーターを駆動するのと全く同じ自己最適化エンジンを、マーケットウォッチに登録されているすべての銘柄に対して並行して実行します。1つのパネルで、現在統計的に取引可能な銘柄、各銘柄で勝率の高い戦略、最適なストップロス/テイクプロフィットの組み合わせが表示され、新たなシグナルが発生した瞬間に通知が届きます。 このツールは、Stein Investmentsのエコシステムの一部です。  18種類以上のツールをすべて閲覧し、AIを活用したセットアップの推奨を受け取り、  https://stein.investments でコミュニティに参加しましょう 市場動向を網羅。銘柄ごとに3,000件以上の自動最適化。2種類のアラート。ワンクリックでチャートを切り替えて即座にアクション。 なぜこれが必要なのか 多くのマルチ銘柄スキャナーは、 価格の動き (ボラティリティ、変動率、銘柄ごとのRSI)を表示するだけです。それ
ABQ Visual Risk Sizer
Cristian David Castillo Arrieta
ABQ Visual Risk Sizer - Institutional Risk & Trade Execution カテゴリ:ユーティリティ / リスク管理 手動によるロット計算は、時間とコストの浪費につながります。 現代のトレーディング、特にプロップファーム(Prop Firms)の口座を運用する場合、ロット計算の誤りや注文入力のわずか5秒の遅れが、デイリードローダウンルールの違反や絶好のエントリーポイントを逃す原因となります。 ABQ Visual Risk Sizer は、この問題を根本的に解決するために設計された機関投資家レベルのツールです。複雑なリスクの数学的計算を、MetaTrader 5のチャート上で直接、直感的かつ迅速、そして100%正確な視覚的体験へと変貌させます。 外部のカレンダ計算機やExcelシートはもう必要ありません。チャート上のラインをドラッグするだけで、ワンクリックで取引を実行できます。 ABQ Visual Risk Sizer が必要な理由 プロップファームのための完全保護: 各取引で、設定した正確なリスク比率(または金額)を維持します。ゴールド
Trade Dashboard simplifies how you open, manage, and control your trades, with built-in lot size calculation. It allows you to execute trades, manage risk, and control positions directly on the chart, with tools such as partial close, breakeven, and trailing stop. Designed to reduce manual work and help you stay focused on your trading decisions. A demo version is available for testing. Detailed explanations of features are provided within the MQL5 platform. Installation instructions are include
Exp COPYLOT CLIENT for MT5
Vladislav Andruschenko
3.82 (34)
MetaTrader 5 用のプロフェッショナル取引コピー機 MetaTrader 向けの高速・高性能・信頼性の高い 取引コピー機 です。 COPYLOT は、MT4 と MT5 のターミナル間で Forex 取引をコピーでき、 Hedge 口座と Netting 口座の両方に対応しています。 COPYLOT MT5 版の対応構成: - MT5 Hedge → MT5 Hedge - MT5 Hedge → MT5 Netting - MT5 Netting → MT5 Hedge - MT5 Netting → MT5 Netting - MT4 → MT5 Hedge - MT4 → MT5 Netting MT4 版 完全な説明 + DEMO + PDF 購入方法 インストール方法 ログファイルの取得方法 テストと最適化の方法 Expforex のすべての製品 MT4 ターミナルへのコピーも可能です(MT4 → MT4、MT5 → MT4): COPYLOT CLIENT for MT4 COPYLOT は、2台、3台、さらには10台のターミナル間で同時に動作できる、プロフェッ
Footprint Chart Pro — Professional OrderFlow EA for MetaTrader 5 Version 6.34 | Professional tool for real traders | Institutional-Grade Visualization DEMO USERS - PLEASE SELECT EVERY TICK / REAL TICK WHEN TESTING AND YOU HAVE DOWNLOADED HISTORICAL DATA. IF YOU SEE A WAITING SCREEN AND IT IS NOT DOWNLOADING, IT MEANS YOU HAVE LOW HISTORICAL DATA. TRY 1 MIN AND 5 MIN FIRST ON 1 DAY DATA. ONE DAY DATA SHOULD BE THE NEWEST AND MOST CURRENT DATE. PLEASE WAIT UNTIL THE MARKET HAS ROLLED OVER PERIOD.
EA を買う前に、本当に耐えられるのか、それともバックテストでたまたま良く見えただけなのかを確認してください。 ほとんどのロボットは、見栄えのするバックテストと一緒に売られています。 右肩上がりのカーブ。 良い Profit Factor。 ほとんど疑いのない見た目。 それでも、その多くの EA は、市場がその履歴どおりに動かなくなった瞬間に崩れ始めます。 なぜでしょうか。 それは、バックテストが証明するのは一つだけだからです。 その戦略が、ある特定の価格の流れでは機能したということです。 別の流れでも通用することは証明しません。 頑健であることも証明しません。 もちろん、その EA があなたのお金に値することも証明しません。 なぜなら、あなたが EA を買うのは過去のきれいなカーブを眺めるためではないからです。 変化する市場で使うために買うのです。 AntiOverfit PRO がすること AntiOverfit PRO は、MetaTrader 5 の Expert Advisor が本当にしっかりしているのか、それとも特定の過去データにたまたまうまくはまっているだけなのかを確
Trade copier MT5
Alfiya Fazylova
4.59 (41)
Trade Copierは、取引口座間の取引をコピーして同期するように設計された専門的なユーティリティです。 コピーは、同じコンピューターまたはvps にインストールされている、サプライヤーのアカウント/端末から受信者のアカウント/端末に行われます。 キャンペーン - すでに「Trade copier MT5」をご購入の方は、「Trade copier MT4」を無料で入手できます(MT4 → MT5 および MT4 ← MT5 のコピー用)。詳細な条件については、どうぞ個別メッセージでお問い合わせください。 購入する前に、デモ アカウントでデモ バージョンをテストできます。 デモ版 こちら 。 詳細な説明は こちら 。 主な機能と利点: MT5ネッティングアカウントを含む、MT5> MT5、MT4> MT5、MT5> MT4のコピーをサポートします。 高いコピー速度(0.5秒未満)。 ベンダーモードと受信者モードは同じ製品内に実装されています。 チャートから直接リアルタイムでコピーを制御できる、簡単で直感的なインターフェイス。 接続が切断されたり、端末が再起動されたりしても、設定と位
Timeless Charts
Samuel Manoel De Souza
5 (4)
Timeless Charts is an advanced charting solution designed for professional traders seeking for custom charts / custom timeframes , including seconds charts / seconds timeframe, renko charts / renko bars, cluster charts / footprint charts and advanced tools present in most of the popular platforms. Unlike traditional offline charts or simplistic custom indicators, this solution constructs fully custom bars with true timestamp accuracy , down to miliseconds, allowing for a powerful and precise tr
Copy Cat More Trade Copier MT5 (コピーキャット MT5) は、今日の取引課題に対応して設計されたローカルトレードコピーシステムと完全なリスク管理・実行フレームワークです。プロップファームのチャレンジから個人ポートフォリオ管理まで、堅牢な実行、資本保護、柔軟な設定、高度な取引処理の組み合わせで、あらゆる状況に適応します。 コピーシステムはマスター(送信側)とスレーブ(受信側)の両方のモードで動作し、成行注文と指値注文、取引修正、部分決済、両建て決済操作のリアルタイム同期を行います。デモ口座とライブ口座、取引ログインまたは投資家ログインの両方に対応し、EA、ターミナル、またはVPSが再起動してもパーシスタント取引メモリシステムを通じて復旧を保証します。複数のマスターとスレーブをユニークIDで同時に管理でき、ブローカー間の違いはプレフィックス/サフィックス調整またはカスタムシンボルマッピングを通じて自動的に処理されます。 マニュアル/設定  | Copy Cat More MT4 | チャンネル  特別機能: 設定が簡単 — わずか30秒で完了(ビデオをご覧
Trade Manager DashPlus
Henry Lyubomir Wallace
5 (13)
DashPlus は、MetaTrader 5プラットフォーム上での取引効率と効果を向上させるために設計された高度なトレード管理ツールです。リスク計算、注文管理、高度なグリッドシステム、チャートベースのツール、パフォーマンス分析など、包括的な機能を提供します。 主な機能 1. リカバリーグリッド 逆境の市場環境下で取引を管理するための平均化および柔軟なグリッドシステムを実装します。 取引回復のための戦略的なエントリーおよびエグジットポイントを可能にします。 2. スタックグリッド 強い市場の動きの中でポジションを追加することで、有利な取引での潜在的なリターンを最大化するように設計されています。 トレンド市場で利益を得られるよう、勝ち取引を拡大します。 3. 損益(P&L)ライン チャート上に直接、潜在的な利益と損失のシナリオを視覚的に表示します。 設定を調整し、P&Lラインをドラッグして、実行前にさまざまな取引結果を評価します。 4. バスケットモード 同じシンボルでの複数ポジションの管理を簡素化し、それらを単一の集約ポジションにまとめます。 平均価格に基づいて、ストップロスやテイクプ
Custom Alerts AIO:マルチマーケット監視を一括で実現 — 設定不要ですぐに使えるインテリジェントツール 概要 Custom Alerts AIO は、追加のインジケーター設定が不要で、インストール後すぐに利用できる高機能マーケットスキャナーです。FX Power、FX Volume、FX Dynamic、FX Levels、IX Power を内部にすべて統合し、主要なすべての資産クラス(為替、金属、指数、暗号資産)を一括監視できます。MetaTrader の仕様により、株式は個別のシンボルとして追加可能ですが、一般的には利用頻度は低めです。 1. なぜ Custom Alerts AIO を選ぶべきか 追加ライセンス不要 • 必要なすべての Stein Investments インジケーターが内蔵されており、すぐに使用可能です。 • チャートに表示されるグラフィックは省略されており、アラート生成に特化した構成です。 市場を広範囲にカバー • 為替、金属、暗号資産、株価指数に対応(株式は手動追加可能)。 • シンボル名を入力する必要はなく、プロパティで資産クラス
MetaTrader 5 用トレーディングパネル — チャートとキーボードから行うプロフェッショナルなワンクリック取引 アクティブトレーダーのために設計された高機能 Trading Panel。標準の MetaTrader 操作よりも、はるかに速く、直感的に、そして効率的に取引を実行できます。 本パネルは、ポジション管理、未決注文管理、利益コントロール、執行スピードをひとつのプロフェッショナルなワークスペースに集約した実践的なソリューションです。 これは単なる補助ツールではありません。MetaTrader 5 のための本格的な trading cockpit です。チャートから直接操作し、キーボードで素早くコマンドを実行し、自動計算や視覚的なガイドを活用することで、手動トレードをより速く、より明確に、より快適にします。 このパネルを使えば、チャート上からワンクリックで注文を実行でき、標準の MetaTrader コントロールと比べて最大 30 倍速く取引操作を行うことができます。 MT4 バージョン | 完全説明 + DEMO + PDF | 購入方法 | インストール方法 | ログ
TelegramからMT5へ: 究極のシグナルコピーソリューション Telegram to MT5 を使えば、取引がシンプルになります。DLL を必要とせず、Telegram のチャンネルやチャットから MetaTrader 5 プラットフォームに取引シグナルを直接コピーできる最新ツールです。この強力なソリューションは、正確なシグナル実行、豊富なカスタマイズオプション、時間の節約、そして効率性の向上を実現します。 [ Instructions and DEMO ] 主な特徴 直接的なTelegram API統合 電話番号とセキュアコードで認証します。 ユーザーフレンドリーな EXE ブリッジを通じてチャット ID を簡単に管理できます。 複数のチャネル/チャットを追加、削除、更新して、同時に信号をコピーします。 高度なフィルターによる信号解析 例外的な単語 (例: 「レポート」、「結果」) を含む不要な信号をスキップします。 柔軟な SL および TP 形式 (価格、ピップ、ポイント) をサポートします。 価格ではなくポイントを指定するシグナルのエントリ ポイントを自動的に計算します。
あなたがメンバーである任意のチャネルから(プライベートおよび制限されたものを含む)シグナルを直接あなたのMT5にコピーします。  このツールは、トレードを管理し監視するために必要な多くの機能を提供しながら、ユーザーを考慮して設計されています。 この製品は使いやすく、視覚的に魅力的なグラフィカルインターフェースで提供されています。設定をカスタマイズして、数分で製品を使用を開始できます! ユーザーガイド + デモ  | MT4版 | Discord版 デモを試してみたい場合は、ユーザーガイドにアクセスしてください。 Telegram To MT5 受信機は、ストラテジーテスターで動作しません! Telegram To MT5の特徴 複数のチャネルから一度にシグナルをコピー プライベートおよび制限されたチャネルからシグナルをコピー BotトークンまたはChat IDは必要ありません   (必要に応じて使用することができます) リスク%または固定ロットを使用して取引 特定のシンボルを除外 すべてのシグナルをコピーするか、コピーするシグナルをカスタマイズするかを選択 すべてのシグナルを認
Anchor: The EA Manager Run your full EA portfolio without conflicts, without stacked risk, and without watching every chart yourself. Anchor coordinates up to 64 Expert Advisors on a single account so only one trades at a time. Attach Anchor to any chart. Type your EA names and magic numbers in one line. Anchor handles the rest. Built for portfolios. Built for discipline. Built for prop firms. The Problem Running multiple EAs on the same account creates risk. Two gold EAs can open opposite posit
Ultimate Extractor - Professional Trading Analytics for MT5 *****this is the local HTML version of Ultimate Extractor. !!!!!it is not compatible with Cloud!!!! For the online version please reach out to me directly****** Ultimate Extractor transforms your MetaTrader 5 trading history into actionable insights with comprehensive analytics, interactive charts, and real-time performance tracking. What It Does Automatically analyzes your MT5 trading history across all Expert Advisors and generates
Seconds Chart - MetaTrader 5で秒足チャートを作成するユニークなツールです。 Seconds Chart を使用すると、秒単位のタイムフレームでチャートを構築でき、標準的な分足や時間足チャートでは得られない柔軟性と分析精度を実現します。例えば、 S15 は15秒足を表します。カスタムシンボルをサポートしているインジケーターやEAをすべて使用できます。標準的なチャートと同様に便利に操作できます。 標準的なツールとは異なり、 Seconds Chart は超短期のタイムフレームでも高い精度と遅延なく作業できるように設計されています。 Seconds Chartの利点 1秒から900秒 までのタイムフレームをサポート。 組み込みのティックデータベースにより、ヒストリカルデータを 瞬時にロード 。 リアルタイムでデータが更新され、 遅延やラグなし 。 複数の秒足チャートを同時に作成可能。 Seconds Chartが最適な用途 スキャルピング や高頻度取引。 正確なエントリーとエグジット。 短期タイムフレームでの取引戦略のテスト。 タイムフレームの設定 デフォルトの設
HINN MAGIC ENTRY – the ultimate tool for entry and position management! Place orders by selecting a level directly on the chart! full description   ::  demo-version  :: 60-sec-video-description Key features: - Market, limit, and pending orders - Automatic lot size calculation - Automatic spread and commission accounting - Unlimited partitial take-profits  - Breakeven and trailing stop-loss and take-profit  functions - Invalidation leves - Intuitive, adaptive, and customizable interface - Works
The core idea: using the user interface, you configure the parameters the chart must meet before entering a position (or positions), choose which entry models to use, and set the rules for when trading and planning should end. Lazy Trader  handles the rest: it  takes over all the routine chart watching and execution! full description  :: 3 key videos [1] ->  [2]   ->  [3] What can it do? - Understands Larry Williams market structure - Understands swing market structure by Michael Huddleston
Cerberus Equity Watcher
Samuel Bandi Roccatello
5 (3)
Cerberus the Equity Watcher はリスク管理ツールであり、アカウントの資産を常に監視し、不完全な EA や裁量的なトレーダーの場合は感情的な行動によって引き起こされる大きなドローダウンを回避します。これは、バグを含む可能性のある EA や、予想外の市況でうまく機能しない可能性のある EA に依存するシステマティック トレーダーにとって非常に役立ちます。 Cerberus では、最小エクイティ値と (オプションで) 最大値を設定できます。これらのいずれかに達すると、すべてのポジションがフラットになり、すべての未決注文がクローズされ、すべての EA が「強制終了」されます。すべての位置を平坦化すると、ユーザーの携帯電話に通知が送信され、画面に明確なメッセージが表示されます。 「平坦化」の後、Cerberus は株式価値を監視し続け、再初期化されるまでそれ以上の取引の試みを停止し続けます。 Cerberus によって実行されるすべての操作は、画面に明確に表示され、Expert advisor タブに報告され、通知がユーザーに送信されます。ユーザーのミスを避けるために、
The product will copy all telegram signal to MT5 ( which you are member) , also it can work as remote copier.  Easy to set up, copy order instant, can work with almost signal formats, image signal,  s upport to translate other language to English Work with all type of channel or group, even channel have "Restrict Saving Content", work with  multi channel, multi MT5 Work as remote copier: with signal have ticket number, it will copy exactly via ticket number. Support to backtest signal. How to s
Poc Breakout Signal: The Ultimate Institutional Order Flow & Price Action System Elevate your trading with Poc Breakout, a comprehensive technical analysis tool designed to bridge the gap between retail trading and institutional market understanding. This all-in-one system combines powerful Buy/Sell signals, advanced Volume Profile analysis, real-time Order Flow (Depth of Market), and critical macroeconomic data to give you a clear, unambiguous edge in the markets. Poc Breakout Signal decodes c
MT5 to Telegram Signal Provider は、Telegramのチャット、チャンネル、またはグループに 指定された シグナルを送信することができる、完全にカスタマイズ可能な簡単なユーティリティです。これにより、あなたのアカウントは シグナルプロバイダー になります。 競合する製品とは異なり、DLLのインポートは使用していません。 [ デモ ] [ マニュアル ] [ MT4版 ] [ Discord版 ] [ Telegramチャンネル ]  New: [ Telegram To MT5 ] セットアップ ステップバイステップの ユーザーガイド が利用可能です。 Telegram APIの知識は必要ありません。必要な全ては開発者から提供されます。 主な特長 購読者に送信する注文の詳細をカスタマイズする機能 例えば、Bronze、Silver、Goldといった階層型のサブスクリプションモデルを作成できます。Goldサブスクリプションでは、すべてのシグナルが提供されます。 id、シンボル、またはコメントによって注文をフィルターできます 注文が実行されたチャート
Trade Assistant 38 in 1
Makarii Gubaydullin
4.91 (23)
多機能ツール:ロット計算、グリッド注文、R/R比率、トレードマネージャー、サプライ&デマンドゾーン、プライスアクションなど デモ版   |   ユーザーマニュアル トレードアシスタント   はストラテジーテスターでは動作しません :   こちらからデモ版をダウンロード  して ユーティリティ をテストできます。 ご質問、改善のご提案、バグ発見の場合は ご連絡ください MT4版が必要な場合は こちら から入手できます トレード   プロセス を簡素化、高速化、自動化。   ダッシュボード で標準端末の機能を拡張。 トレードパネルは  あらゆる取引商品で動作:外国為替、株式、インデックス、暗号通貨など。 1. 新規トレードの実行 :ロット / リスク / R/R計算 :手動トレードのためのリスク管理 ロット計算機(リスクサイズに基づく取引量計算) リスク計算機(ロットサイズに基づくリスク額) リスクリワード   比率 グリッド注文:  + 動的間隔オプション、スプリットロットオプション 注文のアクティベーショントリガー、+ バイストップリミット / セルストップリミット 仮想SL、仮想
作者のその他のプロダクト
。。。。。。。。。。。。。。。。。。。。。。。。。。。。。。。。。。。。。。。。。。。 This indicator is based on Bollinger Bands indicator. It helps user clearly know the Band is expand or contract. The method of use is the same as the traditional Brin channel index. Users can use different color areas to distribute forest channel indicators in expansion or contraction stage. -------------------------------------------------------------------------------------------
FREE
Reverse TradeCopier for Followers can copy trades from an account that is running   Reverse TradeCopier for Source . Features: Copies trades from one source (master) account to multiple following (slave) accounts. Allow investor (read only) password for source (master) account. There are no complicated settings and input parameters, everything is easy. Works with different brokers. Works with different quotes symbols (EURUSD_FX, eurusd_m, etc.). Can copy orders from 4-digit quotes platform to 5-
FREE
If you want something as below: Sell FOREX trading signal. Manage multiple accounts. Follow the trading from somebody. "TradeCopier_follow" and   "TradeCopier_source"   can help you! Features: Copying from one source (master) account to multiple follower (slave) accounts. Allow investor (read only) password for the source (master) account. There are no complicated settings and input parameters, everything is easy. Works with different Brokers. Works with different symbols (EURUSD_FX, eurusd_m, e
FREE
The Synchronized Charts script allows comparing bars of different symbols or different periods of the same symbol. Attach the script to a chart and move bars or change the scale, all opened chart will move synchronously with the current one. The bars on different charts aligned to the border according to their open time. Please be sure the relevant history datas have been downloaded before synchronize charts. 。。。。。。。。。。。。。。。。。。。。。。。。。。。。。。。。。。。。。。。。。。。。。。。。。。
This product is used to check the foreign exchange market history datas. Good quality historical datas is important for traders to perform market analysis or back testing. But the quality of historical datas provided by various foreign exchange brokers is uneven. Sometimes we notice missing k-line sequences, but sometimes it is not easy to detect them. This product helps users locate these missing locations.If there are many gaps in a given period of time on a chart, you need to be careful about
Some trading strategies are suitable for the quiet market with less volatility, while others are suitable for the volatile and violent market. Either way, traders should have a clear measure of how hot or cold the market is. This product is convenient for traders to compare the degree of cold heat of different trading varieties, or the trading heat of the same trading variety in different time periods. You can put it on different charts to get the intuition. It's easy to see which is more hot an
This indicator is used to indicate the difference between the highest and lowest prices of the K line, as well as the difference between the closing price and the opening price, so that traders can visually see the length of the K line. The number above is the difference between High and Low, and the number below is the difference between Close and Open. This indicator provides filtering function, and users can only select K lines that meet the criteria, such as positive line or negative lin
Some traders don't like expose Take Profit/Stop Loss level in their positions, this Expert Advisor can help them. Put it to chart and set Take Profit/Stop Loss pips (0 means ignore), it watch the price of the symbol on chart and close the position if price reach Hidden TP/SL level. It hide user's TP/SL price in effect. Welcome to contact me. 。。。。。。。。。。。。。。。。。。。。。。。。。。。。。
This script allows traders to easily close positions if their profit/loss reaches or exceeds a value specified in pips. The script allows users to easily close positions if their profit/loss reaches or exceeds a value specified in pips. Please set slippage value first. Sometimes some positions do not close due to high volatility of the market. Please set larger slippage or restart the script. ...................................................................................................
Script to Delete Pending Orders Sometimes you placed many Pending Orders and then you want delete certain kind of these orders, this script can help you! Usage: Download and drag and drop this script to the chart. Check "Allow AutoTrading" in "Common" tab and set input parameters in "Inputs" tab. Input Parameters: TypeOfPending: which type Order you would delete. mySymbol: which Symbol you would delete. The input format of the Symbol is such as "EURUSD" or "eurusd".
The script allows to easily watch the date and time of several cities selected by the user from more than 30 important cities all over the world. It also shows GMT, Server time and Local time. The cities on the screen are automatically sorted by the date and time. You can save your setting on the Inputs tab and use them in future. Notice: Daylight saving time is not considered.
Some trading strategies are suitable for the quiet market with less volatility, while others are suitable for the volatile and violent market. Either way, traders should have a clear measure of how hot or cold the market is. This product is convenient for traders to compare the degree of cold heat of different trading varieties, or the trading heat of the same trading variety in different time periods. You can put it on different charts to get the intuition. It's easy to see which is more hot an
Painting Deals on active chart. It allows analyzing trade history on an account to which you have an investor (read only) password. Type of the arrow displayed indicated the deal type: Right Arrow means In and In/Out deals Arrow Left Left means Out deals. Blue arrows are for Buy deals and Red arrows are for Sell deals. The indicator displays deals in the real time mode, it also displays their Stop Loss and Take Profit levels. Put the mouse over the arrows to see the details of deals including op
The script shows statistics of trades for the specified period. For example, if you want to know the details of trades of the ATC2010 Winner ( bobsley ): Login with his account using the investor (read-only) password (MetaTrader5); Open the chart of his trading symbol (EURUSD); Run this script on the chart; Specify 2010.10.1 in "date from", and the diagram will be shown.
The Synchronized Charts script allows comparing bars of different symbols or different periods of the same symbol. Attach the script to a chart and move bars or change the scale, all opened charts will move synchronously with the current one. The bars on different charts aligned to the border according to their open time. Please be sure the relevant history datas have been downloaded before synchronize charts.
This script allows traders to easily close positions if their profit/loss reaches or exceeds a value specified in pips. The script allows users to easily close positions if their profit/loss reaches or exceeds a value specified in pips. Please set slippage value first. Sometimes some positions do not close due to high volatility of the market. Please set larger slippage or restart the script. ............................................................................................
This script notifies a user about different events by playing sounds, sending emails and text messages to a mobile device. The following events are supported: New deals (in/in out/out). Expiration of Pending orders. The terminal disconnected. The terminal or the script closed. Please set a notification type for each event separately. If you need notifications via Email, please make sure that the settings on the Email tab are correct. If you need to receive notifications on a mobile device, pleas
This script alerts a user via sounds and alert box at the end of a countdown. It is like an alarm clock. There are 2 ways to start counting down: Set a value of remaining minutes. Example: if you need an alert after 1 hour, set it to 60. Set countdown end time. If you like to use a custom sound for the alert, copy your sound files to "terminal_path\Sounds" folder and set the exact file name in the input parameters. The sound file must be in *.wav format.
This product is used to check the foreign exchange market history datas. Good quality historical datas is important for traders to perform market analysis or back testing. But the quality of historical datas provided by various foreign exchange brokers is uneven. Sometimes we notice missing k-line sequences, but sometimes it is not easy to detect them. This product helps users locate these missing locations.If there are many gaps in a given period of time on a chart, you need to be careful about
This is a trend indicator, as you can see here. When the white line is above the red, it means a bull market. Conversely, the white line below the red line is a bear market. This index is suitable for long - term trading and is suitable for most trading varieties. --------------------------------------------------------------------------------------------
This indicator let user clearly see Buy/Sell signals. When a bar is closed and conditions meet, arrow signal will come up at Close Price, up is Buy and down is Sell. It works on all Timeframes. And you can set sound alert when signals come up.
This indicator is used to compare the relative strength of the trade on the chart against the other several selected symbols. By comparing the price movement of each traded variety based on the same base day, several trend lines of different directions can be seen, reflecting the strong and weak relationship between the several different traded varieties, so that we can have a clearer understanding of the market trend. For example, you can apply this indicator on a EurUSD chart and compare it w
.................................. This script is intended to help users to get information about ticks and spreads (e.g. ticks count, minimum/maximum/average spread). It can export reports in the CSV format with this information. Traders can see spread statistics in real time in the chart window It is useful for comparing spreads of different brokers. --------------------------------------------------------------------------
This is visualization tool based on the Depth of Market. It works with the symbols that have the Depth of Market available. It's a visual indicator that shows the volume of each Bid/Ask price and ratio of total volume of Bids/Asks. Note: check if your broker supports DOM before purchasing. 。。。。。。。。。。。。。。。。。。。。。。。。。。。。。。。。。。。。。。。。。。。。。。。。。。。 。。。。。。。。。。。。。。。。。。。。。。。。。。。。。。。。。。。。。。。。。。。。。。。。。。。
This indicator is used to compare the relative strength of the trade on the chart against the other two selected symbols. By comparing the price movement of each traded variety based on the same base day, three trend lines of different directions can be seen, reflecting the strong and weak relationship between the three different traded varieties, so that we can have a clearer understanding of the market trend. For example, you can apply this indicator on a EurUSD chart and compare it with curre
Most time the market is in a small oscillation amplitude. The Trade Area indicator helps users to recognize that time. There are 5 lines in this indicator: Area_high, Area_middle, Area_Low, SL_high and SL_low. Recommendations: When price is between Area_high and Area_Low, it's time to trade. Buy at Area_Low level and sell at Area_high level. The SL_high and SL_low lines are the levels for Stop Loss. Change the Deviations parameter to adjust SL_high and SL_low.
This indicator is used to indicate the difference between the highest and lowest prices of the K line, as well as the difference between the closing price and the opening price, so that traders can visually see the length of the K line. The number above is the difference between High and Low, and the number below is the difference between Close and Open. This indicator provides filtering function, and users can only select K lines that meet the criteria, such as positive line or negative line.
This script allows you to compare quotes and spreads from different trading servers or brokers to identify a server/broker that offers the best bid/ask price and the tightest spread. It can be compared with up to six different servers or brokers at a time, and it is easy to find the best quote provider by score. Usage: Open up to 6 MetaTrader client terminals, login to different servers/brokers, and then start the script on each terminal's chart.
This is a multi-currency paired trading system.I won't go into the details of how it works, but what the user needs to care about is how it actually works. It is highly recommended that you download the product and test it thoroughly, including back testing with the historical data and foward testing in the simulated account. As this EA trades multiple currency pairs, relevant historical data will be automatically downloaded at the first time of its historical review, with data volume around 6GB
It's a self-learning indicator. You need to set a starting time and download the relevant historical data for it to learn. Learn as few rules as possible and give the maximum freedom to the indicators. Therefore, the principle of choosing the best outcome during the learning period does not guarantee that every transaction is profitable. In general, the longer the study, the more reliable the results. In the strategy tester, you need to set the time parameter before the test starts so that the i
フィルタ:
レビューなし
レビューに返信