Flow Pressure Histogram

  • インディケータ
  • Joas Da Silva Veiga
    Joas Da Silva Veiga
    こんにちは、私はブラジル出身です。自分のニーズとデイトレードの研究に基づいて、MT5 用のツールやインジケーターを一人で開発しています。MQL5 ではまだ新しく、私自身が使用し開発したツールやインジケーターを公開しています。無料のものも有料のものもあります。もし私の有料ツールやインジケーターを購入していただき、活動を支援していただければとても嬉しく、今後さらに多くの無料ツールを公開できるようになります。ご覧いただきありがとうございます。
  • バージョン: 1.0
  • アクティベーション: 20

Flow Pressure Histogram, Market Flow Indicator, Probability Indicator, Trend Detection, Ranging Detection, Multi-Filter Indicator, Volatility Thermometer, Pattern Recognition, Breakout Alert, Momentum Indicator, Market Pressure, Buy Sell Pressure, Signal Indicator, MT5 Indicator, Forex Indicator


Flow Pressure Histogram

The Multi-Layer Market Flow Indicator for MT5

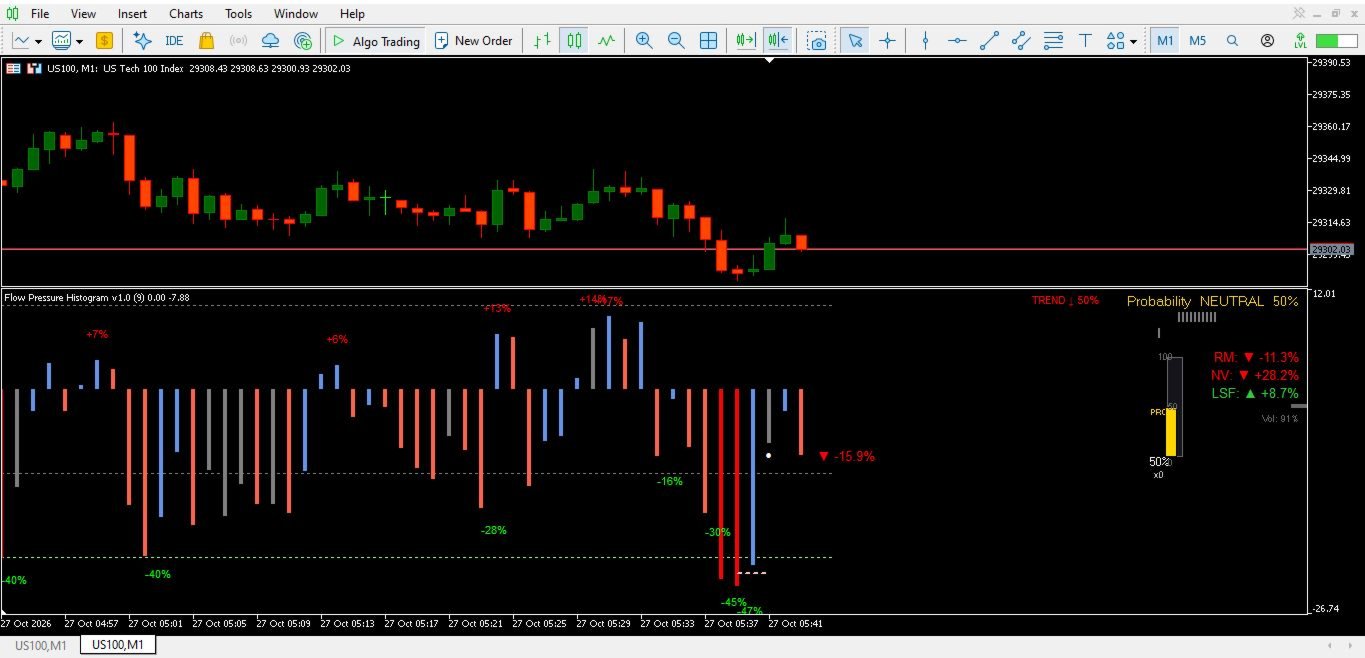
Flow Pressure Histogram is an advanced technical indicator that visualizes real-time buying and selling pressure as a color-coded histogram, enhanced with probability scoring, trend/ranging detection, volatility measurement, and automated pattern recognition. Unlike traditional oscillators that only show momentum direction, this indicator delivers a complete market context in a single sub-window.

Whether you trade forex, indices, or commodities, Flow Pressure Histogram helps you identify when pressure is building, when the market is ranging, and when high-probability setups are forming — without cluttering your main chart.

What Makes This Indicator Different

Most indicators tell you what is happening. Flow Pressure Histogram tells you how strong, in what context, and with what probability.

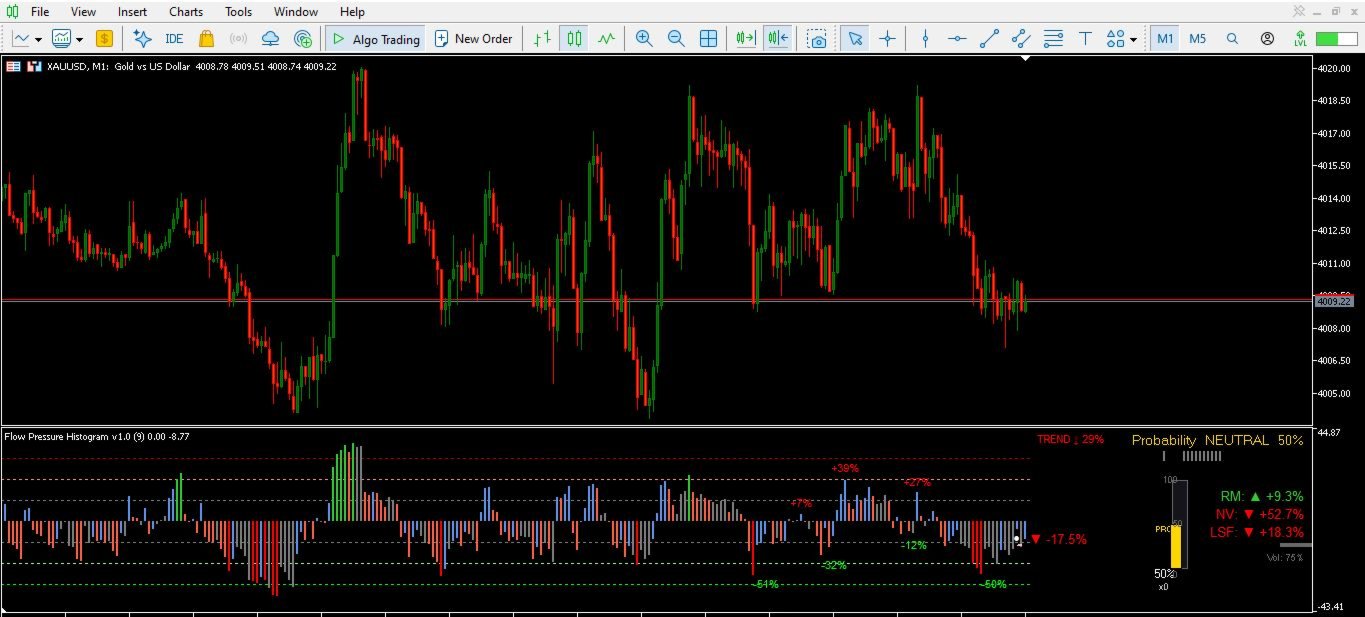
  • Dual-layer histogram: Green bars above zero indicate bullish pressure; red bars below zero indicate bearish pressure. Bar height reflects intensity, not just direction.

  • Context-aware coloring: Bars change color based on overbought/oversold conditions, sequence breaks, and ranging detection — so you instantly see when momentum is weakening or reversing.

  • Probability engine: A 0–100% score combines momentum strength, accumulation, volume, price confirmation, and trend alignment into a single actionable reading.

  • Trend + Ranging classification: The indicator distinguishes between trending markets (Trend ↑ / Trend ↓) and sideways conditions (Ranging ↑ / Ranging ↓), preventing you from applying trend strategies in choppy markets.

Core Features

1. Market Pressure Histogram

The histogram displays the net pressure between buyers and sellers. Positive values (above zero) indicate bullish pressure; negative values (below zero) indicate bearish pressure. Bar height represents the intensity of that pressure.

Color coding highlights:

  • Blue/Lime: Bullish pressure (Lime = overbought + rising)

  • Red/Tomato: Bearish pressure (Red = oversold + falling)

  • Gray: Ranging / low-conviction conditions

  • Tomato (reversal): Sequence breaks and momentum shifts

2. Probability Score (0–100%)

A sophisticated scoring engine combines multiple factors to estimate the likelihood of directional continuation:

  • Momentum strength relative to the zero line

  • Consecutive bar accumulation

  • Volume confirmation

  • Price alignment with EMA

  • Trend integration

  • Ranging penalty (reduces score during sideways markets)

The score is displayed as a percentage with a visual progress bar. Values above 50% lean bullish; below 50% lean bearish. A dead zone around 50% (±5%) indicates neutrality.

3. Trend & Ranging Detection

The indicator analyzes historical bar data across two windows (short and long) to classify market conditions:

  • Trend ↑ / Trend ↓: Directional momentum with sufficient strength

  • Ranging ↑ / Ranging ↓: Sideways market with slight bias

  • Neutral: No clear direction

A "70% Rule" bonus activates when a high percentage of recent bars align in one direction with sufficient strength, increasing trend confidence.

4. Volatility Thermometer

A visual thermometer measures current volatility relative to the average range. The thermometer animates smoothly, with color reflecting probability direction (green for bullish, red for bearish, gold for neutral). Duration counters show how many bars the current condition has persisted.

5. Real Movement (RM), Net Value (NV), and Last Strength Force (LSF)

Three proprietary metrics provide additional market context:

  • RM (Real Movement): The percentage change in the core oscillator from the previous bar, showing immediate momentum shift

  • NV (Net Value): The accumulated absolute movement within the current bar, representing effort exerted

  • LSF (Last Strength Force): The percentage change of the last closed bar, indicating closing strength

These metrics are displayed in a corner panel with directional arrows and color coding.

6. Pattern Recognition (9 Patterns)

The indicator automatically detects and marks high-probability reversal and continuation patterns:

Pattern Type Description
Accordion (Sanfona) Sell Alternating positive/negative bars with decreasing amplitude
Back and Forth (Vai e Volta) Sell +, -, -, +, - sequence with a middle peak
Slingshot (Estilingue) Sell Strong positive, two negatives, higher positive, then negative
Bite (Mordida) Buy Positive 7–12, negative, positive, positive breakout
+3 Bars Buy Three declining negative bars followed by a strong positive
Snake (Cobra) Buy Extended negative sequence followed by strong reversal
Pullback 30 Sell Drop from above 30 to below 12
Recovery -30 Buy Rise from below -30 to above -12
Bite and Fall/Rise Armed Neutral zone → extreme → return to neutral

Each pattern triggers visual dots on the chart and optional alerts (popup, sound, push notification).

7. Breakout ±20 Detection

When the histogram exits the neutral zone (±10), reaches ±20, and returns to neutral on the next bar, the indicator marks the breakout with a colored dot and generates an alert.

8. Percentage Alerts

Configurable alerts trigger when the histogram percentage crosses predefined levels (default: 50%, 60%, 70%, 80%, 90%, 100%) in either direction. Hysteresis prevents alert spam.

9. Level Lines

Horizontal reference lines at ±10, ±20, and ±30 help you visually assess pressure intensity.

10. Ranging Band (Optional)

When ranging is detected, the indicator can draw ceiling and floor lines showing the boundaries of the consolidation zone.

Abbreviations Explained

Abbreviation Full Name Meaning
RM Real Movement Percentage change of the core oscillator from the previous bar. Shows immediate momentum shift.
NV Net Value Accumulated absolute movement within the current bar. Represents effort exerted by the market.
LSF Last Strength Force Percentage change of the last closed bar. Indicates closing strength.
FPH Flow Pressure Histogram The indicator's short name, used in alerts and object prefixes.

How to Use

Reading the Histogram

  • Above zero + rising bars: Bullish pressure increasing

  • Above zero + falling bars: Bullish pressure weakening (potential reversal)

  • Below zero + falling bars: Bearish pressure increasing

  • Below zero + rising bars: Bearish pressure weakening (potential reversal)

  • Gray bars: Ranging / low conviction — avoid trend-following entries

Interpreting Probability

  • > 70%: Strong bullish probability

  • 50–70%: Moderate bullish bias

  • 30–50%: Moderate bearish bias

  • < 30%: Strong bearish probability

  • Around 50%: Neutral / wait

Combining Trend and Probability

  • Trend ↑ + Probability > 65%: High-confidence long setup

  • Trend ↓ + Probability < 35%: High-confidence short setup

  • Ranging + Probability near 50%: Stay out or use range strategies

  • Trend + low probability: Momentum may be exhausting — caution

Pattern Signals

Pattern dots appear on the histogram bars. A green dot below a bar indicates a buy pattern; a red dot above a bar indicates a sell pattern. Combine with probability and trend for confirmation.

Input Parameters (Summary)

Group Key Parameters Description
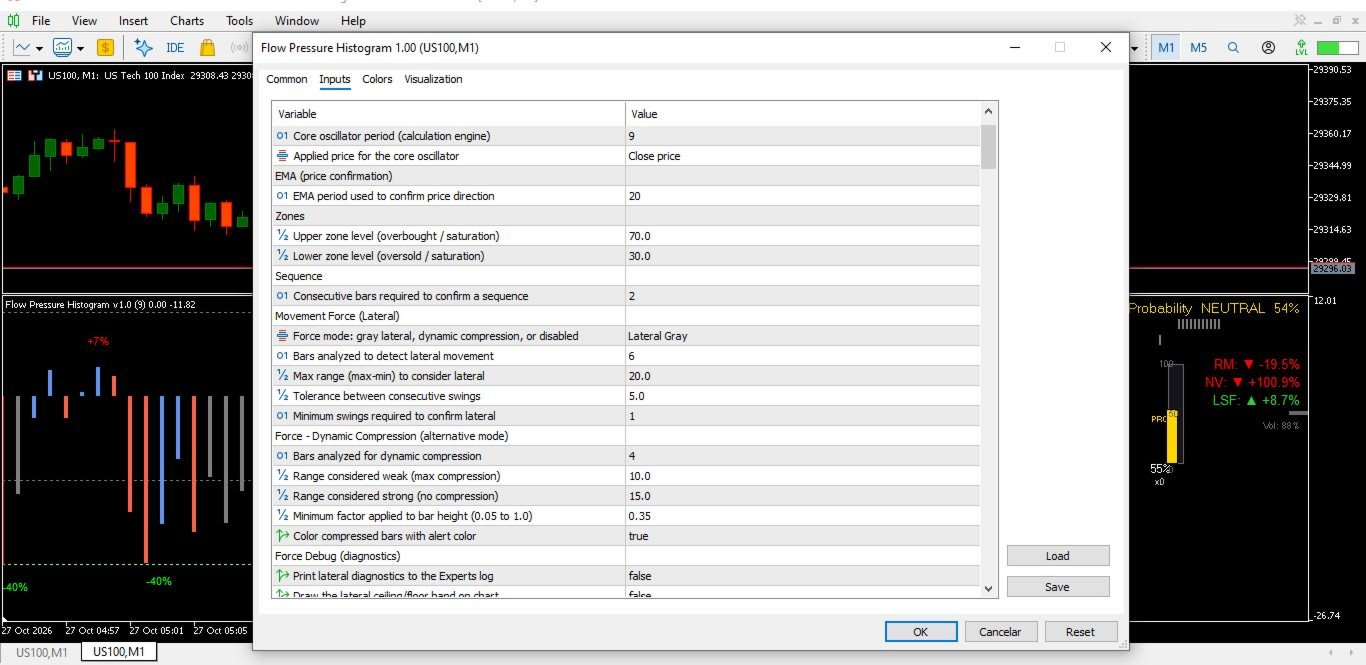
Language Interface Language English (default) or Portuguese
Pulse Period, Applied Price Core oscillator settings
EMA Period Price confirmation EMA
Zones Overbought, Oversold Saturation levels
Movement Force Lateral mode, window, range, tolerance, min swings Ranging detection settings
Force Applied to Probability Use, max reduction, range thresholds Probability damping in weak markets
Force Applied to Trend Use, range thresholds, min factor Trend force damping in weak markets
Break Line Show, color, width, style, offset Sequence break visualization
Dot Show, color, size, code, offset Sequence confirmation visualization
Percentages Show, tops/bottoms, font size, lateral bars Percentage labels
Real Movement (RM) Show, arrow, percentage, static, reference RM panel settings
Net Value (NV) Show, arrow, percentage, history bars NV panel settings
LSF Percentage LSF panel settings
Volatility Show, range period, medium/strong levels, smoothing, persistence Thermometer settings
Thermometer Height, width, position, offset, animation speed, duration, arrow Visual settings
Probability Show, dead zone, bar, segments, margin, color, throttle Probability panel settings
Trend and Ranging Show, period, update, strong levels, colors, integration, threshold Trend/ranging settings
70% Rule Active, limit, min strong bars, bonus Trend confidence rule
Trend Advanced Recency weight, slope, two windows, multiplier Advanced trend settings
Vol Show, period, alert limit, bar width/height/offset, animation, font Lateral vol bar settings
Level Lines Show, style, width, extra bars Level line settings
Patterns Enable, alerts, sound, notification, dot settings Pattern detection settings
Breakout 20 Enable, neutral zone, levels, dot settings Breakout detection settings
Percentage Alerts Enable, start, step, max, hysteresis, alerts Percentage alert settings
Layout Right offset, margins, line step Panel positioning
Performance Max init bars, throttle intervals Optimization settings
Debug Log, trend, vol Diagnostic settings

Recommended Settings

Trading Style Timeframe Probability Threshold Trend Filter Pattern Alerts
Scalping M1–M5 > 65% / < 35% Trend ↑/↓ only Enabled
Intraday M15–H1 > 60% / < 40% Trend or Ranging Enabled
Swing H4–D1 > 55% / < 45% Trend only Disabled

Compatibility

  • Platform: MetaTrader 5

  • Type: Technical Indicator (sub-window)

  • Instruments: Forex, indices, commodities, crypto (any symbol with volume data)

  • Timeframes: All timeframes

  • Account Types: Hedging and Netting

  • Languages: English (default), Portuguese

Important Notes

  • This indicator is a technical analysis tool, not a trading system. It provides context and probability assessment, not guaranteed signals.

  • Probability scores and pattern detection are based on historical data and do not guarantee future results.

  • Always combine with proper risk management and market structure analysis.

  • The indicator does not repaint closed bars. Real-time values on the current bar may change until the bar closes.

  • Alerts are optional and must be configured according to your preferences.

Support

For questions, feature requests, or bug reports, please use the MQL5 Market messaging system. We aim to respond within 24 hours on business days.

Flow Pressure Histogram v1.0 — See the pressure. Read the context. Trade with clarity.
おすすめのプロダクト
JT360 DNA Mini PnL Pointer V1.04 Public Компактно. Наглядно. Всегда перед глазами. JT360 DNA Mini PnL Pointer — это лёгкий индикатор для MetaTrader 5, который отображает суммарную текущую прибыль или убыток по всем открытым позициям текущего символа графика. Компактная индикация непосредственно на графике объединяет PnL относительно первоначального риска в формате R, тонкую мини-полоску и настраиваемую цветовую матрицу. Фирменные цвета JT360 — бирюзовый и пурпурный — выделяют крайние значения и
FREE
Follow The Line MT5
Oliver Gideon Amofa Appiah
4.6 (35)
This indicator obeys the popular maxim that: "THE TREND IS YOUR FRIEND" It paints a GREEN line for BUY and also paints a RED line for SELL. (you can change the colors). It gives alarms and alerts of all kinds. IT DOES NOT REPAINT and can be used for all currency pairs and timeframes. Yes, as easy and simple as that. Even a newbie can use it to make great and reliable trades. NB: For best results, get my other premium indicators for more powerful and reliable signals. Get them here: https://www.m
FREE
The Penta-O is a 6-point retracement harmonacci pattern which usually precedes big market movements. Penta-O patterns can expand and repaint quite a bit. To make things easier this indicator implements a twist: it waits for a donchian breakout in the right direction before signaling the trade. The end result is an otherwise repainting indicator with a very reliable trading signal. The donchian breakout period is entered as an input. [ Installation Guide | Update Guide | Troubleshooting | FAQ | A
FREE
Indicator and Expert Adviser  EA Available in the comments section of this product. Download with Indicator must have indicator installed for EA to work. Mt5 indicator alerts for bollinger band and envelope extremes occurring at the same time. Buy signal alerts occur when A bullish candle has formed below both the lower bollinger band and the lower envelope  Bar must open and close below both these indicators. Sell signal occur when A bear bar is formed above the upper bollinger band and upper
FREE
The indicator identifies when a divergence occurs between price and an indicator or oscillator. It identifies both regular and hidden divergences. Combined with your own rules and techniques, this indicator will allow you to create (or enhance) your own powerful system. For higher probability setups I can recommend you to use my Supply Demand indicator and trade only if the divergence occurs inside a zone. Supply zone for bearish div and demand zone for bullish div. The optimal scenario is if it
FREE
Donchian Channel DC is the indicator of Donchian Channels, that plots maximum and minimum values of a specific period, besides mean value line. It´s possible to configure simple period for analysis and the indicator will plot all three values. You can trade with this indicator as trend or reversal, according to each strategy. Do not let to test others indicators as soon as others expert advisors.
FibRetrace Zones 直近スイングのフィボナッチ・リトレースメント・ゾーン FibRetrace Zones は FibRetrace EA の無料ビジュアル補助インジケーターです。フィボナッチ・リトレースメント水準を描画し、直近スイングの押し目・戻りゾーンを強調表示するため、取引前にエントリー位置を確認できます。 ゾーンは方向別に色分けされます。強気セットアップは緑、弱気セットアップは赤。あらゆる銘柄・時間足で動作します。 主な機能 ルックバック調整可能な自動スイング検出 古典的フィボナッチ水準(23.6%、38.2%、50%、61.8%、78.6%)、個別に切替可能 色設定可能な押し目ゾーンの強調表示 方向による色分け:緑 = 強気、赤 = 弱気 バー確定で確定表示。形成中バーのリアルタイム更新はオプション 使い方 任意のチャートに適用します。価格が色付きゾーンまで押した位置が、FibRetrace がエントリーを探す場所です。フィボナッチラインを使って手動で指値注文を置くこともできます。 自動化する FibRetrace EA はこの同じゾーンを自動で取引します。1銘
FREE
「Haven Key Levels PDH PDL」   インジケーターは、トレーダーがチャート上の主要なレベルを視覚化するのに役立ちます。次のレベルを自動的にマークします: DO (Daily Open)   — 日足の始値。 NYM (New York Midnight)   — ニューヨーク時間の深夜0時のレベル。 PDH (Previous Day High)   — 前日の高値。 PDL (Previous Day Low)   — 前日の安値。 WO (Weekly Open)   — 週足の始値。 MO (Monthly Open)   — 月足の始値。 PWH (Previous Week High)   — 前週の高値。 PWL (Previous Week Low)   — 前週の安値。 CMH (Current Month High)   — 当月の高値。 CML (Current Month Low)   — 当月の安値。 PMH (Previous Month High)   — 前月の高値。 PML (Previous Month Low)   — 前月の
FREE
Short Description Draws rolling Time-Price-Opportunity (TPO) and footprint volume profiles for the Asia, London, and New York sessions with POC/VAH/VAL levels, delta volume bias, order flow overlays, liquidity heatmaps, developing rolling lines, Naked POC (NPOC) tracking, Initial Balance breakouts, multi-session confluence zones, and automatic broker GMT-offset detection. Full Description Plots separate market-profile and volume-profile style histograms for the three major trading sessions (Asi
FREE
Easy Correlations Indicator The Easy Correlations Indicator is designed to help traders analyze the relationship between two correlated instruments. By monitoring the distance between their Relative Strength Index (RSI) values, the indicator highlights situations where one instrument has moved significantly further than the other. This creates potential trading opportunities: Sell the stronger instrument (overstretched RSI) Buy the weaker instrument (lagging RSI) Because the positions are opened
FREE
MA Cross Marker helps traders visualize market direction with two customizable moving averages and clear crossover signals. It can display MA lines from one selected timeframe on the current chart and mark bullish or bearish crosses automatically. Designed for traders who want a lightweight, easy-to-read MA crossover tool. Key Features Display two customizable Moving Averages Automatic Buy/Sell signals on MA crossover Single timeframe MA selection (including higher timeframe display) Clean and
FREE
Are you tired of drawing trendlines every time you're analyzing charts? Or perhaps you would like more consistency in your technical analysis. Then this is for you. This indicator will draw trend lines automatically when dropped on a chart. How it works Works similar to standard deviation channel found on mt4 and mt5. It has 2 parameters: 1. Starting Bar 2. Number of bars for calculation The   starting bar   is the bar which drawing of the trend lines will begin, while the   number of bars for c
FREE
Goldcrest Indicator — Free Gold Trading Signals for MetaTrader 5 Engineered for Gold. Built for Precision. Goldcrest Indicator is a free, powerful, and easy-to-use MetaTrader 5 indicator designed to help traders identify potential trading opportunities in the gold market (XAUUSD). Built using the proprietary Goldcrest signal-detection framework, the indicator monitors market conditions and displays clear BUY and SELL signals with entry prices and initial SL references directly on your chart , he
FREE
Important Lines
Terence Gronowski
4.88 (24)
This indicator displays Pivot-Lines, preday high and low, preday close and the minimum and maximum of the previous hour. You just have to put this single indicator to the chart to have all these important lines, no need to setup many single indicators. Why certain lines are important Preday high and low : These are watched by traders who trade in a daily chart. Very often, if price climbs over or falls under a preday low/high there is an acceleration in buying/selling. It is a breakout out of a
FREE
About the indicator: DALA Forecast is a universal tool for predicting the dynamics of time series of any nature. For prediction, modified methods of nonlinear dynamics analysis are used, on the basis of which a predictive model is built using machine learning methods.  To get the trial version of the indicator, you can contact me in private messages. How to use the indicator: Apply the indicator to your chosen financial instrument or indicator with the settings you need. The prediction will be
FREE
ToolBot Probabilistic Analysis - FREE   An effective indicator for your negotiations The toolbot indicator brings the calculation of candles and a probabilistic analysis so that you have more security on your own. Also test our  FREE tops and bottoms indicator: :   https://www.mql5.com/pt/market/product/52385#description Also test our  FREE (RSI, ATR, ADX, OBV) indicator:   https://www.mql5.com/pt/market/product/53448#description Try our EA ToolBot for free:   https://www.mql5.com/market/prod
FREE
High Low Open Close
Alexandre Borela
4.98 (46)
このプロジェクトが好きなら、5つ星レビューを残してください。 このインジケータは、指定されたためのオープン、ハイ、ロー、クローズ価格を描画します 特定のタイムゾーンの期間と調整が可能です。 これらは、多くの機関や専門家によって見られた重要なレベルです トレーダーは、彼らがより多くのかもしれない場所を知るために有用であり、 アクティブ。 利用可能な期間は次のとおりです。 前の日。 前週。 前の月。 前の四半期。 前年。 または: 現在の日。 現在の週。 現在の月。 現在の四半期。 現年。
FREE
The indicator detects and displays М. Gartley's Butterfly pattern. The pattern is plotted by the extreme values of the ZigZag indicator (included in the resources, no need to install). After detecting the pattern, the indicator notifies of that by the pop-up window, a mobile notification and an email. The pattern and wave parameters are displayed on the screenshots. The default parameters are used for demonstration purposes only in order to increase the amount of detected patterns. Parameters z
現在および前回の日・週・月の始値をラベル付きのラインで描画します。多くのデイトレーダーがバイアスや反応ポイントとして使うレベルです。 主な機能 確定足で計算され、値はリペイントしません あらゆるシンボルと時間足で動作 すべての期間、レベル、色は入力パラメータで変更可能 最大バー数の設定によりリソース消費が軽量 インジケーターを削除するとオブジェクトは自動的に削除されます 入力パラメータ ライン: 日の始値を表示、週の始値を表示、月の始値を表示、それぞれの表示期間数、日の色、週の色、月の色。 表示: 計算する最大バー数。 注意 これは分析ツールです。トレードは行いません。 ご自身の戦略に合わせたカスタマイズや、フィルターとアラートを追加した上位版が必要ですか?MQL5でプライベートメッセージをお送りください。見積もりをご返信します。
FREE
Menora (All In One) Indicator. This is the advanced and premium indicator for the Magic Trend, a free indicator.  It has 3 output signals driven by different market conditions. This indicator has a double function of working as an indicator and utility at the same time. Specifications  1]  3 output signals a) Slow Moving Average with color change - The MA has a non-repaint color change, which makes it perfect for entry signals. b) Fast Moving Average (the original Magic Trend line) - Gives a
FREE
製品概要 KMB Smart Pattern Analyzer PRO は、ユーザーが指定したチャート範囲内で市場パターンを検出し、技術的な一致度に基づいてランキングする高度なテクニカル分析インジケーターです。 複数の分析エンジンを1つのプロフェッショナルなツールに統合しています。 ローソク足パターン分析 クラシックチャートパターン認識 ハーモニック構造検出 市場構造 / SMC分析 チャート全体にランダムなシグナルを表示するのではなく、ユーザーが指定した市場エリアに集中し、最も強いパターン候補、方向性、ブレイクアウトレベル、無効化レベル、予測ターゲットゾーンを構造的に分析します。 主な機能 最も一致度の高い Top 3パターン を検出・ランキング 対応分析: ローソク足パターン クラシックチャートパターン ハーモニックパターン Market Structure / SMC ユーザー指定範囲の分析 以下を表示: パターンタイプ 市場方向 Score Momentum Breakoutレベル T1 / T2 / T3ターゲット Invalidationレベル Structure情報 選択
FREE
TrendVision AI
Murtadha Majid Jeyad Al-Khuzaie
TrendVision AI – Smart Trend Channels & Price Forecasting for MetaTrader 5 Discover market structure and explore potential future price direction with TrendVision AI, an advanced technical indicator for MetaTrader 5 that combines automatic trendline analysis with a machine-learning-based price forecasting model. How Does TrendVision AI Work? TrendVision AI analyzes historical candlestick data within a configurable lookback window. It automatically draws two trendlines directly on the chart:
FREE
This indicator consist of Standard BBMA Standard signal Sign on chart added EMA50 Behavior Tracking: The chart background changes color based on the EMA50 (default is black) and shifts to white when a breakout of the Bollinger Bands occurs. Three Engulfing Color Change: Automatically adjusts colors to help you easily determine market zones. default yellow/white High-Low Line Sign: Highlights the potential trading range and key price levels for better visual  MHV
FREE
Donchian Channel is an indicator created by Richard Donchian. It is formed by taking the highest high and the lowest low of the last specified period in candles. The area between high and low is the channel for the chosen period. Its configuration is simple. It is possible to have the average between the upper and lower lines, plus you have alerts when price hits one side. If you have any questions or find any bugs, please contact me. Enjoy!
FREE
無限からの通貨の強さを測定するためのこの革新的な指標は、長い間取引されているダフ屋やトレーダーにとって不可欠な助手です。 通貨の強さ/弱さを分析するためのシステムは、世界の主要なトレーダーによって市場で長い間知られており、使用されてきました。 任意の裁定取引は、この分析なしでは完全ではありません。 私たちの指標は、互いに関連して基本通貨の強さを簡単に決定します。 これは、インスタント分析を可能にし、最強のエントリポイントを検索し、すべてまたは現在の通貨ペアの折れ線グラフが表示されます。 インジケータは直感的で、すぐに見つけて任意のペアに切り替えることができ、地下室とメインチャートの両方に配置できるモバイルパネルがあります。 通貨の強さの変化の通知のタイマーモードは、トレーダーに電話で通知を受け取る機会を与えます。  通貨パワーメーターインフィニティ指標を使用するためのいくつかの戦略: 1. 通貨の強さの線形表示のチャートを使用して、交差点を新興トレンドの信号として検索します 2. トレンド反転信号が表示された後、強い通貨の方向に頭皮 3. 通貨の強さの発散分析を使用して、現在の
FREE
Deviation Trend Profile Overview Deviation Trend Profile is a MetaTrader 5 chart indicator that combines three visual layers in a single chart window: a moving average with momentum-based coloring, deviation bands calculated from volatility, and a horizontal distribution profile drawn to the right of the current price. The indicator is an analytical tool. It does not open, modify or close trades, and it is not a complete trading system. It is designed to help the user observe trend direction, mo
FREE
SMC Indicator Plus
Jose Dolores Vergara Dietrich
View the main Smart Money Concepts areas of interest directly on your chart and make decisions with greater clarity, agility, and context. The SMC Indicator identifies areas that may act as potential price reaction or reversal points, helping traders plan the entire trade: entry, stop-loss placement, trade management, and profit-taking. With these areas mapped out, you can look for better-positioned entries, define potentially tighter technical stops, assess the risk-to-reward ratio more effecti
FREE
如果产品有任何问题或者您需要在此产品上添加功能,请联系我 Contact/message me if you encounter any issue using the product or need extra feature to add on the base version. Floating Highest Lowest MT5 provides you an intuitive and user-friendly method to monitor the floating highest (profit) and lowest (loss) that all your trades together ever arrive. For example, I opened 3 orders, which arrived at $4.71 floating profit when trade following trend. Later when the trend is against me, these 3 orders arrive $30 in loss, and a
FREE
Renko subwindow
Alexandre Vincent Traber
Overview Renko SubWindowは、メインチャートに影響を与えずに、独立したインジケーターウィ ンドウ内にカラーローソク足でレンコブロックチャートを描画します。ブロックサイズは ポイントで固定するか、ATRを使ってボラティリティに応じて動的に調整できます。 How it works 現在の銘柄/時間足の終値からレンコブロックを再構築します。 価格が前のブロックの終値から設定したブロックサイズを超えると新しいブロックが形成 されます。 ブロックは色付きローソク足として表示され、陽線・陰線の色が区別 されます。 新しいバー形成時、または時間足/履歴変更時のみ再計算し、軽量で 安定した動作を保ちます。 Inputs Renko_BrickPoints: 固定ブロックサイズ(ポイント);0の場合はATRを使用 Renko_ATR _Period: BrickPointsが0の場合のATR期間 Renko _MaxBricks: ウィンドウに表示する最大ブロック数 Recommended setup 任意の銘柄・時間足で使用可能。主要 Forexペアではブロックサイズ50-15
FREE
TradeQL
Abdiel Aviles Jimenez
The TradeQL Indicator is a customizable tool that highlights specific trading patterns on candlestick charts. Users can define patterns through TradeQL queries, which the indicator then applies to the chart, visually representing matches and captured groups. Ideal for identifying complex trade setups in real-time. TradeQL queries are specified using the TradeQL Language. See https://github.com/abdielou/tradeql for more details. This language is expressed as a regular expression. The language al
FREE
このプロダクトを購入した人は以下も購入しています
Trend Sniper X
Sarvarbek Abduvoxobov
4.86 (42)
Trend Sniper X は、トレードの方向性と潜在的な反転ポイントを明確かつ正確に特定するのに役立つ、MetaTrader 5 用のマルチタイムフレーム・トレンドフォロー指標です。 MT4用: https://www.mql5.com/en/market/product/193245 価格情報: 現在の価格はプロモーション価格であり、今後のアップデートや新機能のリリースに伴い変更される場合があります。 ボーナス特典: このインジケーター用の無料自動売買アシスタントEAを入手するには、購入後に an 著者(開発者)へメッセージをお送りください。 Code2Profit チャンネル マルチタイムフレーム分析で相場をマスターしよう! Trend Sniper X で勝率を最大化する方法:重要なルールとセッションのコツ 技術仕様 プラットフォーム MetaTrader 5 インジケータータイプ マルチタイムフレーム・トレンドインジケーター 操作タイムフレーム あらゆるチャートタイムフレームに対応。個別に選択可能な上位タイムフレーム (M1–MN1) を搭載 主要銘柄 FX、ゴールド (X
新たな王者が登場 - インジケーター + 注文管理表示(TP1 + TP2 + TP3)+ オプションのTelegramシグナル送信機能付き(無料) (完全なトレード&シグナルシステム) ゴールド向け最高のEA: Gold Slayer このインジケーターには、高度な戦略、カスタマイズ可能な注文管理システム、そしてエンベロープ拡張を組み合わせた平均回帰システムが搭載されています。さらに、RSIなど複数のインテリジェントな確認フィルターによって、高確率の反転エントリーをBUY・SELLシグナルとして検出します。 単にトレードを学ぶだけでなく、複数ポジションを効果的に管理し、過去に利益を出しているオープンポジションで損失トレードをカバーする方法も学べます。 M5向けに構築・最適化されており、流動性が高くシグナルの精度が安定しているBTCUSDとXAUUSDで優れたパフォーマンスを発揮します。 このインジケーターは、ATRを基に自動計算されたエントリー、ストップロス、テイクプロフィットレベルを備えた明確なLong・Shortシグナルを提供するため、リスク管理が最初から組み込まれています。 マ
Smart Trend Trading System — MetaTrader 5 ご購入後、MQL5で私にメッセージをお送りいただくと、Smart Universal Expert Advisorを無料で受け取れるほか、オンライン講座、PDFマニュアル、非公開グループへのアクセスもご利用いただけます。 STTSは、トレンドの方向、エントリー・決済シグナル、反転ゾーン、重要な価格水準をチャート上にまとめて表示します。システムを参考に手動で取引することも、別の対応EAを接続し、ご自身で選んだ設定に基づいて自動売買することもできます。 ひとつのシステム、4つのトレードアプローチ STTSのトレードアプローチは、大きく4つのカテゴリーに分かれています。 • スキャルピング — 短期的なシグナルや相場の動きを捉えます。 • トレンドトレード — 方向性を評価し、トレンド内の機会を探します。 • 反転トレード — 反転の可能性があるゾーンや方向の変化を見つけます。 • 出来高トレード — 出来高に基づく情報を使い、市場の活発さを評価します。 エントリー・決済の矢印、トレンド情報、サポート・
あなたのトレード優位性を視界に入れよう! M5 Sniper は MeanFX による新しいインジケーターです。 正確なトレードシグナル と 適応型TP/SLレベル を組み合わせることで、結果として可能な限り最高の統計的トレードを実現します! 5回購入されるごとに価格が上昇し、次の価格は69$です 購入後に私にメッセージを送っていただければ、ヒント/ガイドとボーナスEAをお受け取りいただけます 何が他と違うのでしょうか? Gold XAUUSDにおける 実証済みの統計的パフォーマンス ( ほぼすべてのアセットで機能します 。一貫した結果が得られないまま何でも扱おうとするのではなく、1つの時間足をマスターすることに重点を置いています) 1日あたり1~8回のトレード を各シンボルで実行し、高い勝率と、すべての統計的優位性をこちら側に持つことができます チャート上には 確認済みの BUYおよびSELLシグナルのみを表示 適応型TPおよびSLレベル を各トレードごとにインジケーターが生成 平均Winrate 75%+ 平均 Signal Ratio 最低1.1+ アラーム と通知を 携帯電話
SuperScalp Pro
Van Minh Nguyen
4.54 (37)
SuperScalp Pro - Professional Multi-Layer Confluence Scalping System SuperScalp Proは、複数の高度な確認フィルターを追加することで、従来のSupertrendを強化したスキャルピング向けインジケーターです。誤ったシグナルを大幅に減らしながら、成功する可能性がより高いBuy/Sellの取引機会を見つけるのに役立ちます。 BuyとSellの矢印がチャート上に明確に表示され、ATRに基づくStop LossとTake Profitのレベルもリアルタイムで自動計算されます。 ご購入後、MQL5で私にメッセージを送っていただくと、SuperScalp Pro Auto Trader EAを無料で受け取れるほか、ユーザーガイドとプライベートグループへのアクセスもご利用いただけます。 推奨設定ファイルをダウンロード: [Set File] 詳細なドキュメントは製品ブログでご覧いただけます: [User Guide] 最新情報を受け取るには公式チャンネルにご参加ください: [Official Channel] Sup
SMC Intraday Formula
VividMind Digital Solutions
5 (26)
まず正直に言いましょう。 どんなインジケーターも、それ単体であなたを利益化させることはできません。もしそう言う人がいるなら、それは夢を売っているだけです。完璧な売買シグナル(矢印)を表示するインジケーターは、いくらでも“完璧に見せる”ことができます。正しい過去の区間を拡大して、勝ちトレードだけを切り取ればいいだけです。私たちはそれをしません。 SMC Intraday Formula はツールです。 市場構造を読み取り、最も高い確率の価格ゾーンを特定し、今この瞬間のスマートマネーの痕跡をシンプルな言葉で正確に示します。最終判断はあなたが行います。トレードを実行するのもあなたです。しかし今は「希望」ではなく「精度」でエントリーできます。 私たちはこのインジケーターを、ゴールド(XAUUSD)および主要FX通貨ペアで約3年間、日々のスキャルピングに使用してきました。M1、M5、M15、M30の主要ツールです。これは未来を予測しようとするのではなく、今まさに形成されている高確率セットアップを示し、その理由を説明します。 他のすべてのインジケーターと何が違うのか? ほとんどのトレーディングイ
伝説が帰ってきました:Entry Points Pro 10。 MQL5 Marketのトップ3に3年間入り続けた伝説的インジケーターの再始動です。 2つのバージョンで合計600件以上のレビュー、毎日数千人のトレーダーが実際のトレードに使用し、デモのダウンロードは28,000件以上   MT4+MT5 。 私はこの5年間に寄せられたレビューをすべて読み、約束を並べる代わりに、その答えをバージョン10に組み込みました。1999年から相場に携わり、 誠実さ、自らの評判、そして顧客を大切にする 作者による製品です。 Entry Points Proのエントリーシグナルは、リペイント(再描画)を一切行いません。 そして今回初めて、これは作者の言葉ではなく検証可能な事実になりました。確定シグナルはローソク足の終値確定後にのみ表示され、自動テストで リペイントはゼロ と確認されています(EURUSD、XAUUSD、BTCUSDで2,486,568回の不変条件チェック、違反0件)。検証方法は公開されており、ストラテジーテスターでご自身で再現できます。 ご購入後は、ここMQL5で私にプライベートメッセ
Auto Optimized SpeedAngle は、継続的なウォークフォワード最適化(WFO:Walk-Forward Optimization)によりカーブフィッティング(過剰最適化)を排除した、機関投資家レベルのモメンタムベクトルシステムです。市場レジームの変化時に効果が低下する静的な入力に依存せず、アウトオブサンプル(OOS)検証を用いてパラメーターを動的に再キャリブレーションすることで、表示されるシグナルが単なる過去の偶然ではなく、確実な統計的優位性に基づいていることを保証します。 主な機関投資家向けフレームワーク ウォークフォワード最適化エンジン: ルックバック期間やしきい値の数千に及ぶ組み合わせを継続的にスキャンし、データをインサンプルとアウトオブサンプルに厳格に分離します。未検証のデータ環境において数学的優位性が証明された場合にのみ、新しいパラメーター設定を採用します。 定量的目的関数: 単なる純利益の追求ではなく、機関投資家レベルの安定性指標をターゲットとします。システム品質ナンバー(SQN)、期待値(1トレードあたりの平均Rマルチプル)、またはネットRの最適化を選
ARIPoint
Temirlan Kdyrkhan
1 (4)
ARIPoint is a powerful trading companion designed to generate high-probability entry signals with dynamic TP/SL/DP levels based on volatility. Built-in performance tracking shows win/loss stats, PP1/PP2 hits, and success rates all updated live. Key Features: Buy/Sell signals with adaptive volatility bands Real-time TP/SL/DP levels based on ATR Built-in MA Filter with optional ATR/StdDev volatility Performance stats panel (Success, Profit/Loss, PP1/PP2) Alerts via popup, sound, push, or email Cu
Gann Made Easy   は、ミスター・ギャンの理論を使用した取引の最良の原則に基づいた、プロフェッショナルで使いやすい外国為替取引システムです。 W・D・ガン。このインジケーターは、ストップロスとテイクプロフィットレベルを含む正確な買いと売りのシグナルを提供します。 PUSH通知を利用して外出先でも取引可能です。 ご購入後、取引方法の説明と優れた追加インジケーターを無料で入手するには、私にご連絡ください! おそらく、ギャンの取引手法についてはすでに何度も聞いたことがあるでしょう。通常、ギャンの理論は初心者のトレーダーだけでなく、すでにある程度の取引経験がある人にとっても非常に複雑なものです。なぜなら、ギャンの取引手法は理論的にはそれほど簡単に適用できるものではないからです。私はその知識を磨き、最良の原則を私の外国為替インジケーターに組み込むために数年を費やしました。 このインジケーターは非常に簡単に適用できます。必要なのは、それをチャートに添付し、簡単な取引推奨事項に従うだけです。このインジケーターは常に市場分析の仕事を行い、取引の機会を探します。適切なエントリーポイントを検
M1 SNIPER は使いやすいトレーディングインジケーターシステムです。M1時間足向けに設計された矢印インジケーターです。M1時間足でのスキャルピングのためのスタンドアロンシステムとして、また既存のトレーディングシステムの一部としても使用できます。このトレーディングシステムはM1時間足での取引に特化して設計されていますが、他の時間足でも使用できます。元々、この手法はXAUUSDとBTCUSDの取引用に設計しましたが、他の市場においても役立つと考えています。 インジケーターのシグナルは、トレンドの方向と逆方向に取引できます。インジケーターのシグナルを利用して両方向に取引するのに役立つ特別な取引テクニックをご紹介します。この手法は、特別な動的なサポートとレジスタンスの価格帯を利用することに基づいています。 ご購入後、M1 SNIPER矢印インジケーターをすぐにダウンロードできます。さらに、M1 SNIPERツールのすべてのユーザーに、以下のスクリーンショットに表示されているApollo Dynamic SRインジケーターを無料で提供しています。この2つのインジケーターを組み合わせることで
Adaptive Price Action Engine インジケーターを購入すると、EAが無料に マルチタイムフレーム対応・自己最適化トレンド&ローソク足パターン分析 市場環境は常に変化しており、すべてのPrice Actionパターンが、あらゆる市場環境で同じ価値を持つわけではありません。 Adaptive Price Action Engine は、変化する市場環境への適応を目的として、 トレンド構造、マルチタイムフレーム分析、ローソク足パターン、統計的最適化 を1つの分析フレームワークに統合しています。 2つのアダプティブモード Dual Alpha Trend Mode 低い時間足と高い時間足のAlpha Trendパラメータを自動的に探索し、直近の市場動向に合わせてトレンド判定を適応させます。 Candlestick + Alpha Mode Alpha Trendによる市場レジーム判定と、 22種類の強気・弱気ローソク足パターン を組み合わせます。すべてのパターンを同じように扱うのではなく、さまざまなパターンの組み合わせを統計的に評価し、選択された市場環境において過去
Power Candles V3 - 自己最適化型強弱インジケーター Power Candles V3は 、通貨や銘柄の強さを、適用されたすべてのチャート上で実行可能なトレードプランに変換します。単にローソク足を色分けするだけでなく、バックグラウンドでリアルタイムの自動最適化を実行し、目の前の銘柄に対して最適なストップロス、テイクプロフィット、およびシグナルの閾値を提示します。ワンクリックで実取引に適用でき、エントリーポイント、ストップロス、テイクプロフィットのラインが正確な価格位置にチャート上に表示され、方向性を示すアラートがリアルタイムで発動します。 このツールは、Stein Investmentsのエコシステムの一部です。  18種類以上のツールをすべて閲覧し、AIを活用したセットアップの推奨事項を入手し、  https://stein.investments でコミュニティに参加しましょう クローズしたバーごとに3,000回以上のトレードシミュレーション。9つの強さの状態。2つの戦略を並行してテスト。勝率の高い設定をワンクリックで適用。 なぜこれが必要なのか ほとんどの強
次回アップデート — バージョン 2.52 近日公開!【新機能】 市場分析とトレードワークフローを強化する、4つの主要な新機能にご期待ください 皆様のトレードニーズに応える4つの新機能により、市場分析を次のレベルへと引き上げます。新機能をご紹介します: 1. TRADE OVERVIEW DASHBOARD 2. CONFLUENCE AT ZONE 3. STRONG & WEAK HIGH/LOW 4. OTE 1. TRADE OVERVIEW DASHBOARD 市場全体の状況をより簡単に把握できるダッシュボードです。トレード判断をサポートするガイダンスを提供し、市場分析とトレード計画を体系的に行えるよう支援します。すべてを1つの画面で確認できます。 マルチタイムフレーム市場概要(Multi-Timeframe Market Overview) 市場の方向性と価格構造をより明確に把握 市場状況をすばやく確認 体系的な市場分析とエントリー計画のためのガイダンス 2. CONFLUENCE AT ZONE 価格が重要なゾーンに入るとき…いくつのサポート要因が一致しているかを確認で
Boba Analysis Suite
Trade Ready Solutions LLC
5 (2)
Boba Analysis Suite Boba Analysis Suite は、MetaTrader 5 向けの分析インジケーターです。市場構造、重要な価格帯、相場全体の状況を、一つのチャート画面にまとめて表示します。 トレーダーおよびトレーディング指導者としての実務経験をもとに開発され、市場の方向性の評価、重要な価格水準の特定、複数の時間足を組み合わせた分析など、体系的な分析プロセスを支援します。 相場の背景を踏まえた分析 個々のシグナルの意味は、相場の状況によって変わります。Boba Analysis Suite は、現在のチャート状況をより大きな市場構造と関連付け、あらかじめ定めたルールに沿って取引アイデアを検討するための分析を支援します。 主な分析機能: トレンドと市場構造: 市場の方向性と、その背景にある構造を評価します。 重要な価格帯と価格水準: さらに分析すべき重要な領域を視覚的に表示します。 複数の時間足: 異なる時間足の情報を組み合わせ、相場全体の状況を評価します。 視覚的な分析プロセス: 分析情報をチャート上で直接確認できます。 自主的な取引判断を支援 Boba
FiboSniper Pro – Multi-Filter Fibonacci System with Auto SL/TP and Control Panel FiboSniper Proは、動的なFibonacci Envelopesと複数の確認フィルターを組み合わせ、選別されたBuyおよびSellシグナルを生成するテクニカルインジケーターです。FibonacciレベルはMoving AverageとATRを基に計算され、その後ADX、EMA、RSI、ATR、Volume、Time、Candle構造によってフィルタリングされます。インジケーターは、ATRに基づく自動Stop LossおよびTake Profitレベルをチャート上に直接表示し、さらに迅速な調整が可能なインタラクティブControl Panelを提供します。 ご購入後、MQL5で私にメッセージを送っていただくと、Auto Trader Xを無料で受け取れるほか、このインジケーターの取引シグナルを自動化する方法についての説明もご利用いただけます。 User GuideとSet Files: [Click here] 完全
トレンドキャッチャーインジケーター トレンドキャッチャーインジケーターは、開発者独自の適応型トレンド分析指標を組み合わせることで、市場価格の動きを分析します。短期的なノイズを除去し、根底にあるモメンタムの強さ、ボラティリティの拡大、価格構造の挙動に焦点を当てることで、真の市場方向性を特定します。また、移動平均線、RSI、ボラティリティフィルターなどの平滑化およびトレンドフィルタリング機能を備えたカスタマイズ指標も使用します。 実際の運用状況のモニタリングやその他の製品については、こちらをご覧ください: https://www.mql5.com/en/users/mechanic/seller ご注意ください。私はTelegramでEAや設定を販売していません。詐欺です。すべての設定はブログで無料で公開しています。 重要!ご購入後すぐにご連絡ください。手順とボーナスをお送りします!
Quantum TrendPulse を ご紹介します。これは、   SuperTrend   、   RSI   、および Stochastic のパワーを 1 つの包括的なインジケーターに組み合わせて、取引の可能性を最大限に引き出す究極の取引ツールです。精度と効率を求めるトレーダー向けに設計されたこのインジケーターは、市場のトレンド、勢いの変化、最適なエントリー ポイントとエグジット ポイントを自信を持って特定するのに役立ちます。 主な特徴: SuperTrend 統合: 現在の市場動向に簡単に追従し、収益性の波に乗ることができます。 RSI精度: 買われすぎと売られすぎのレベルを検出し、市場の反転のタイミングに最適で、SuperTrendのフィルターとして使用されます。 確率的精度: 確率的振動を活用して、変動の激しい市場で隠れたチャンスを見つけます。SuperTrend のフィルターとして使用されます。 マルチタイムフレーム分析:   M5 から H1 または H4 まで、さまざまなタイムフレームで市場を常に把握します。 カスタマイズ可能なアラート: カスタム取引条件が満たされ
Neuro Poseidon is a new indicator by Daria Rezueva. It combines precise trading signals with adaptive TP/SL levels - creating best possible trades as a result! Message me and get  Neuro Poseidon Assistant  as a gift to automize your trading process! What makes it stand out? 1. Proven profitability on all assets and timeframes 2. Only confirmed BUY and SELL signals present on the chart 3. Adaptive TP & SL levels generated by the software for each trade 4. Easy to understand - suitable for al
Azimuth Pro
Ottaviano De Cicco
5 (7)
Azimuth Pro V2:MT5向けシンセティック・フラクタル構造分析と確認済みエントリー 概要 Azimuth Pro は Merkava Labs によるマルチレベルスイング構造インジケーターです。4つのネストされたスイングレイヤー、スイングアンカーVWAP、ABCパターン検出、3タイムフレーム構造フィルタリング、そして確定バーでの確認済みエントリー — 1つのチャートで、ミクロスイングからマクロサイクルまでを網羅するワークフロー。 これはブラインドシグナル製品ではありません。ロケーション、コンテキスト、タイミングを重視するトレーダーのための構造ファーストワークフローです。 ハロウィンプロモーション — 35%オフ 相場が不気味に揺れても、あなたの優位性は鋭いまま。このオファーが霧の中に消える前に、35%オフで手に入れよう。 Azimuth Proが現在259 USD(通常399 USD)。 1. V2での変更点 シンセティック・マルチタイムフレームエンジン 上位タイムフレーム分析をMeridian Proと同じ独自のシンセティックアーキテクチャで一から再構築。より
ご紹介     Quantum Breakout PRO は 、ブレイクアウト ゾーンの取引方法を変革する画期的な MQL5 インジケーターです。 13年以上の取引経験を持つ経験豊富なトレーダーのチームによって開発されました。     クォンタム ブレイクアウト プロ   は、革新的でダイナミックなブレイクアウト ゾーン戦略により、あなたのトレーディングの旅を新たな高みに押し上げるように設計されています。 クォンタム ブレイクアウト インジケーターは、5 つの利益ターゲット ゾーンを備えたブレイクアウト ゾーン上のシグナル矢印と、ブレイクアウト ボックスに基づいたストップロスの提案を提供します。 初心者トレーダーにもプロのトレーダーにも適しています。 量子EAチャネル:       ここをクリック 重要!購入後、インストールマニュアルを受け取るためにプライベートメッセージを送ってください。 推奨事項: 時間枠: M15 通貨ペア: GBPJPY、EURJPY、USDJPY、NZDUSD、XAUUSD アカウントの種類: ECN、Raw、またはスプレッドが非常に低い R
多通貨対応の通貨強弱・モメンタム・インジケーター MT5 Dynamic Forex28 Navigator は、長年ご好評いただいているインジケーターの発展版で、3 つの機能を 1 つに統合したものです: Advanced Currency Strength28 Indicator (700 件のレビュー) Advanced Currency IMPULSE with ALERT (530 件のレビュー) CS28 Combo Signals(最近のボーナス) この 2 つの前身インジケーターは MQL5 Market で合計 1,200 件を超えるレビューを獲得しており、2016 年から MT4 コミュニティで定番となっています。Dynamic Forex28 Navigator MT5 は、実績ある同じロジックを引き継いでいます。 MetaTrader 5 向けに完全に再構築 – MT5 ネイティブのマルチシンボル・アーキテクチャを最大限に活かす設計です。 ユーザーマニュアル: https://www.mql5.com/en/blogs/post/758844 MT4 版をお探し
「Scalper Vault」は、デイトレードで安定した成果を目指すトレーダーのために設計された、強力かつ充実した機能を備えたトレーディングシステムです。 この高精度なインジケーターは、それ単体で完結するトレーディングシステムとして機能し、FXやバイナリーオプションのトレーダーに、機関投資家レベルの分析を提供します。 ご購入後、ぜひご連絡ください。 トレードのヒントに加え、豪華なボーナスをプレゼントいたします! 「Scalper Vault」を活用すれば、勘に頼った判断や複雑な手動分析は不要です。使いやすいトレード手法に集中し、純粋に「エントリー・決済」という実行フェーズに専念できます。 高精度なトレンドフォロー・シグナル:中核となるアルゴリズムが市場構造を分析し、主要なトレンド方向に沿った高確率なシグナルを提示します。これにより、誤ったエントリーを大幅に削減できます。 精度の高い天井・底の検知:市場の勢いが尽きたポイントをスキャンし、反転の可能性が高いゾーンを特定します。 ギャン(Gann)理論に基づく売買ゾーン:数学的な「ギャン・レベル」を自動的にチャート上に描画します。機関投資
Volatility Master for MetaTrader is a real-time dashboard tool that scans up to  50 symbols  to identify high-volatility , trending markets instantly. With bullish/bearish signals, customizable alerts, and a user-friendly interface, it helps you avoid range-bound conditions and focus on high-probability trades. Clarity leads to confidence. Trade confidently and protect your capital effectively with this powerful dashboard. We don't offer free or bonus indicators in exchange of reviews from you.
SR Liquidity は、市場の流動性が集中し、価格が最も強く反応する「隠れたゾーン」を可視化するために設計されたトレーディング指標です。こうした流動性の高いエリアは強力なサポート(支持)およびレジスタンス(抵抗)レベルとして機能し、市場が反転する可能性が最も高いポイントを明確に示してくれます。 単なる一般的なサポートラインやレジスタンスラインを描画するのではなく、「SR Liquidity」は実際の価格変動を分析し、売りと買いの圧力が集中するゾーンを特定します。これらは、市場の真の動きを牽引する「流動性のプール(溜まり場)」そのものです。それらをチャート上に直接可視化することで、価格が実際に反応する前に、その動きを予測することが可能になります。つまり、このインジケーターは価格の方向性が変わる可能性を予測するのです。生のプライスアクションを、市場の重要な水準(転換点となり得るポイント)を示す、明確で実用的なロードマップへと変換してくれます。 このインジケーターは、FX、株価指数、貴金属、仮想通貨など、あらゆる銘柄や時間足で使用可能です。 ご購入後、取引手順や無料の優れた追加インジケ
OrderFluxは、MetaTrader 5用のオーダーフローFootprintインジケーターです。各ローソク足の内部で何が起きているのかを視覚的に分析できます。1本のローソク足を展開し、価格レベルごとの取引量を表示するとともに、買い手と売り手の成行注文による積極的な取引を区別します。TickデータからリアルタイムでFootprintチャートを構築し、Delta、Imbalance、Absorption、Volume Profile、Market Profile(TPO)、VWAP、Cumulative Delta(CVD)、DOMタブ、経済カレンダーを、見やすく整理された1つのインターフェースに統合します。 通常のチャートが表示するのは、始値、高値、安値、終値だけです。これらは値動きの結果であり、その原因ではありません。OrderFluxは、オーダーフロー取引の中心的な疑問に答えます。実際に値動きを主導したのは誰なのか、探っていた価格で方向性が決まったのか。ローソク足の形状だけで推測するのではなく、実際に成立した取引量に基づいて、サポート、レジスタンス、反転、ブレイクアウトを分析で
Crystal Heikin Ashi Signals—Professional Trend & Signal Detection Indicator Advanced Heikin Ashi Visualization with Intelligent Signal System for Manual & Automated Trading Final Price: $149 ---------> Price goes up $10 after every 10 sales . Limited slots available — act fast . Overview User Guide PDF Crystal Heikin Ashi Signals is a professional-grade MetaTrader 5 indicator that combines pure Heikin Ashi candle visualization with an advanced momentum-shift detection system. Designed for both m
現在33%オフ 初心者にもエキスパートトレーダーにも最適なソリューション このインジケーターは独自の機能と新しい公式を多数内蔵しており、ユニークで高品質かつ手頃な取引ツールです。このアップデートでは、2つの時間枠ゾーンを表示できるようになります。より長いTFだけでなく、チャートTFとより長いTF(ネストゾーンを表示)の両方を表示できます。すべてのSupply Demandトレーダーの皆さんのお気に召すはずです。:) 重要情報の公開 Advanced Supply Demandの可能性を最大化するには、 https://www.mql5.com/ja/blogs/post/720245 にアクセスしてください。   エントリーまたはターゲットの正確なトリガーポイントを正確に特定できれば取引がどのように改善されるか想像してみてください。新しい基盤となるアルゴリズムに基づいて構築されているため、買い手と売り手の間の潜在的な不均衡をさらに簡単に特定できます。これは、最も強い需要と供給のゾーンと、過去のパフォーマンス(古いゾーンを表示)がグラフィカルに表現されるためです。これらの機能は、最適な
Precision Spike Detector
Francisco Mandomo Simbine
5 (2)
Precision Spike Detector V3 – Institutional-Grade AI Trading System Attention: The price increases by US$50 for every 10 purchases.  Final price: US$599 Precision Spike Detector V3   is a   state-of-the-art, institutional-grade market analysis system   for   MetaTrader 5 , designed to detect   high-probability market movements   in synthetic indices such as   Boom, Crash, GainX, and PainX . After purchase, send me a private message to receive the optimized configuration files,  the installation
Matreshka
Dimitr Trifonov
5 (2)
Matreshka self-testing and self-optimizing indicator: 1. Is an interpretation of the Elliott Wave Analysis Theory. 2. Based on the principle of the indicator type ZigZag, and the waves are based on the principle of interpretation of the theory of DeMark. 3. Filters waves in length and height. 4. Draws up to six levels of ZigZag at the same time, tracking waves of different orders. 5. Marks Pulsed and Recoil Waves. 6. Draws arrows to open positions 7. Draws three channels. 8. Notes support and re
作者のその他のプロダクト
トレンド,トレンド分析,トレンドフォロー,シグナル,アラート,トレードパネル,ダッシュボード,マーケットコンテキスト,スキャルピング,デイトレード,短期取引,スイングトレード,再描画なし,遅延なし,リスク管理,リスクリワード,サポート,レジスタンス,需給ゾーン,買い圧力,売り圧力,FX,暗号資産 このパネルは、価格と出来高データを明確なトレンドシグナル、買い/売り圧力、そして客観的なトレード予測へと変換する高度な市場分析ツールであり、すべての情報をチャート上の1つのパネルに集約します。 本インジケーターは、市場行動の動的分析、リスク管理、そして自動トレードプロジェクションを組み合わせ、Gamma Zero、出来高、トレンド、Delta Risk、累積リスクなどの指標をリアルタイムで表示します。 さらに、重要なデータ(買い/売りのピークや累積リスク)を自動保存するインテリジェントなデータ保持機能を備えており、時間足の変更やターミナル再起動後もデータの継続性を維持します。 サウンド、プッシュ通知、メールによるアラート設定や、さまざまな資産タイプへの自動適応機能により、このパネルは意思
FREE
トレーディングパネル,手動取引,注文管理,リスク管理,トレードマネージャー,ワンクリック取引,ストップロス,テイクプロフィット,部分決済,スキャルピング 重要 JoPanel Prime を正しく動作させるには、MetaTrader 5 の「Algo Trading」を有効にする必要があります。この設定が有効になっていない場合、パネルは動作しません。 JoPanel Prime は、MetaTrader 5 用に開発されたプロフェッショナルな裁量取引パネルです。注文の実行とポジション管理をより迅速かつ効率的に行えるよう設計されており、MT5 標準の取引画面を、チャート上で直接操作できるモダンなトレードパネルに置き換えます。 主な機能 • ワンクリックで Buy / Sell の成行注文を実行 • チャート上でプレビュー表示付きの指値・逆指値注文(Shift:Buy、Alt:Sell) • ホットキー(X:すべて決済、I:ポジション反転、M:パネルの最小化) • Take Profit と Stop Loss を個別に設定可能 • 指値・逆指値注文で OCO(One-Cance
FREE
clock,  Server Time, Local Time, MT5 Clock, Clock Indicator, Digital Clock DualClockPro - Local and Server Clock for MetaTrader 5 DualClockPro is a visual clock indicator for MetaTrader 5 that displays local computer time and trading server time directly on the chart. It also supports displaying the corresponding dates, helping traders monitor time differences between their local environment and the broker's server. The panel has a compact design and customizable settings, allowing users to ada
FREE
オーダーチケット, 取引パネル, リスク管理, 手動取引, トレーリングストップ, 注文管理, 高速約定 — JoOrderTrade Pro — MetaTrader 5 用実行パネル JoOrderTrade Pro は、MetaTrader 5 用の包括的なグラフィカルパネルであり、手動注文執行と高度なリスク管理を実現します。プラットフォーム標準の取引ウィンドウを、クリーンで応答性が高く、パフォーマンスに最適化されたインターフェースに置き換え、取引中の精度とコントロールを向上させます。 本製品は自動売買ロボットではありません。すべてのエントリーおよび決済の判断はトレーダー自身が行います。パネルは注文執行およびポジション保護管理のみを自動化します。 このパネルは Netting 口座および Hedge 口座に対応し、設定可能なインターフェース、カスタマイズ可能なホットキー、高度な取引管理ツールを備えています。 主な機能 高速注文執行 ワンクリックでの Market Buy および Market Sell。 チャート上から直接 Pending Order を配置。 Shift で買
RSI カラー キャンドル , 色付きローソク足 , RSI ビジュアル指標 機能について RSI Trend Color は、RSI の数値をローソク足チャート上の色に変換するインテリジェントな視覚インジケーターです。自動的にローソク足を次の色で表示します: 青 :RSI が売られすぎゾーン オレンジ :RSI が買われすぎゾーン 白 :RSI が中立ゾーン 追加機能: RSI が重要なレベルに到達した際の音声および視覚アラート 押し戻し(プルバック)アラート シンプルでカスタマイズ可能な設定 対象ユーザー 視覚的に市場を分析したいトレーダー RSI を実践的に学びたい初心者 分析スピードを向上させたい上級トレーダー MetaTrader 5 を使用するすべてのトレーダー 使用方法 MetaTrader 5 にインジケーターをインストール チャートに自動表示 設定を調整: RSI 期間(デフォルト:4) アラートの有効・無効切替 チャートの色を確認: 青色:買いの可能性 オレンジ色:売りの可能性 プロのヒント:   RSI Zone Memory Reative   と併用すると精
FREE
top finder, bottom finder, market structure, price action, trend reversal, trend continuation, support resistance, swing high, swing low, frequency analysis, price projection, breakout detection, pullback trading, swing trading, market turning points EXPERIMENTAL VERSION – UNDER ACTIVE DEVELOPMENT Smart Top Bottom Finder is a market structure and frequency analysis indicator designed to identify potential tops and bottoms based on recurring price movement patterns. The indicator does not rely
FREE
トレンド,トレンド指標,モメンタム,オシレーター,ヒストグラム,トレンド強度,マーケットフロー,トレンド確認,強気,弱気,テクニカル分析 Trend Flow Oscillatorは、市場のフローとモメンタムを分析するためのインジケーターであり、価格の動きの強さと方向性を明確かつシンプルに、そして迅速に視覚的に把握できるよう設計されています。 特にM5タイムフレームで効果的であり、この時間足ではフローの変化がより頻繁に発生します。 機能 買いと売りの圧力の変化および継続を識別 価格変動の加速と減速を表示 トレンド方向へのエントリーの確認をサポート フローを独立したヒストグラムで表示し、視認性を向上 方向性モメンタムオシレーターとして機能 対象ユーザー 裁量トレーダー スキャルパーおよびデイトレーダー(特にM5) 自動シグナルではなくフローの確認を重視するトレーダー トレンドおよび押し目・戻りを狙うトレーダー シンプルで明確なインジケーターを好むユーザー 使用方法 推奨タイムフレーム:M5 ヒストグラムの解釈: プラスのバーは買い圧力の増加を示す マイナスのバーは売り圧力の増加を示す
FREE
Order Ticket, Trading Panel, Risk Management, Manual Trading, Order Management, Fast Execution,  execution panel for MetaTrader 5 Simple Panel MT5 Simple Panel is a lightweight trading panel for MetaTrader 5 that lets you execute market orders and manage open positions directly from your chart. Designed for simplicity and convenience, the panel provides BUY, SELL, and CLOSE buttons in a compact interface, helping you access essential trading actions without navigating through multiple trading w
FREE
Trend Zone Force
Joas Da Silva Veiga
5 (1)
トレンド, プルバック, トレンドインジケーター, ボラティリティ, atr, 移動平均, ema, モメンタム, オシレーター, オーダーフロー, デルタ, トレンドトレード, スキャルピング このインジケーターは、トレンド分析、プルバックの特定、および市場コンテキストの客観的な判断のために開発されました。移動平均線とボラティリティを組み合わせて動的ゾーンを形成し、価格の方向性を明確に把握できるようにします。 主な目的は、トレーダーが市場の支配的なトレンドに沿って取引できるようにし、低確率のエントリーを減らし、スキャルピング、デイトレード、スイングトレードにおける意思決定の質を向上させることです。 主な機能 移動平均線に基づくトレンド方向の判定 ボラティリティに基づく動的プルバックゾーン 市場の圧力(買いまたは売り)の判断 優勢なトレンド方向に沿った取引のフィルタリング シンプルで見やすく、理解しやすいビジュアル構造 使用方法 価格が買いゾーン(緑のライン)の上にある場合、市場は買い優勢と考えられます。この場合、特に価格が買いゾーン付近まで戻ったときに、エントリーの参考エリアとし
トレンド インジケーター, モメンタム インジケーター, フロー インジケーター, 動的 バンド, MT5 インジケーター, スキャルピング, デイトレード, スイング トレード, パーセント 距離, ノン リペイント, リアルタイム アラート, マルチ タイムフレーム, モメンタム ヒストグラム, EMA トレンド, トレンド 強度 TrendBands Momentum Ultra は、トレーダーが市場の方向性、値動きの強さ、そして価格がトレンドからどれだけ離れているかを視覚的に把握するために設計されたトレンドおよびフロー系インジケーターです。 このインジケーターは、内部で2本の指数移動平均線を使用しています。中央のラインである Gamma Zero はトレンドの基準を示します。ポジティブボリュームとネガティブボリュームのバンドは、価格のモメンタムに応じて動的に拡大・縮小します。Dist は現在の価格と Gamma Zero の間の距離をパーセンテージで表示し、市場の強さを客観的に把握できます。 機能 主要なトレンドの特定、値動きの強さの測定、押し目や継続の可能性があるゾーンの可
トレンド指標, 市場フロー, モメンタム指標, プライスアクション, FXインジケーター, 売買シグナル, トレンド反転, ボラティリティ, テクニカル分析, MT5インジケーター, スキャルピング, 市場の強さ, 取引シグナル, アルゴリズム取引, 価格チャネル Quantum Pulse Force は、MetaTrader 5 向けに開発されたテクニカル指標であり、価格の動きの加速を分析し、トレンドおよびレンジ(横ばい)局面を識別し、複数の定量フィルターに基づいて重要な市場ポイントを強調します。 従来の方向のみを示す指標とは異なり、本指標は動きの強さとその変化を測定することに重点を置いており、リアルタイムで市場の挙動をより正確に把握することが可能です。 フローパーセンテージ(Flow Percentage) 本指標の中核は、2本の移動平均線の差のパーセンテージ変化です。 この計算により、移動平均間の距離が拡大しているか縮小しているかを判断し、動きの加速または減速を示します。 解釈: 正の値は上方向への加速を示す 負の値は下方向への加速を示す ゼロ付近の値は勢いの低下またはレンジ
mt5インジケーター, モメンタム指標, トレンド指標, スキャルピング, 売買シグナル, テクニカル分析, オシレーター, サポートレジスタンス, プライスアクション, ブレイクアウト, 為替戦略, スイングトレード, パターン認識, 市場の勢い, トレードシグナル MasterForce Pattern Panelとは MasterForce Pattern Panelは、MetaTrader 5向けの高度なツールで、マーケットの生データを売買可能なパターンシグナルへと変換します。 このツールは、価格の動きを構成する4つの重要な要素を監視します。 PFRE(Power Flow Real Estate)は、買い圧力と売り圧力の差をティック単位で測定します。正の値は買い優勢、負の値は売り優勢を示します。 Flowは市場の動きの加速を表し、トレンドが強まっているのか弱まっているのかを判断します。 RSIは最近の価格変動に対して高い感度を持ち、買われ過ぎ・売られ過ぎの状態を検出します。 統合Scoreは主要データをまとめ、-100から+100の値で現在の市場状態を示します。 このツール
Market Analysis, Market Structure, Price Action, Trend Analysis, Bullish, Bearish, Range Market, Directional Bias, Market Dashboard, Trading Dashboard, Trend Detection, Market Scanner, Market Context, Breakout Analysis, Consolidation Analysis, Trend Filter, Technical Analysis, Real Time Analysis This indicator analyzes price behavior in real time and classifies market conditions into Bullish , Bearish , Range , and Neutral scenarios. Price is continuously evaluated relative to a dynamic referen
FREE
RSI Indicator, RSI Signals, Buy Sell Signals, Trend Indicator, Momentum Indicator, Overbought Oversold, Reversal Indicator, Trading Signals, Forex Indicator, MT5 Indicator, Double Top, Double Bottom, Trend Filter, Technical Analysis, Trading Alerts RSI Zone Memory Reactive – RSI Signals and Market Structure An RSI indicator for identifying momentum shifts, repeated RSI extremes, and potential reversal areas in MetaTrader 5. Overview RSI Zone Memory Reactive is a technical analysis indicator fo
Time and Sales, Time and Sales Indicator, Tape Reading, Pressure Book, Buy Sell Pressure, Tick Analysis, Market Pressure, Tick Data, Price Movement Analysis, Tick Strength, Momentum Analysis, Buy Sell Movement, Movement Sequences, Real-Time Tick Monitor, Trading Dashboard, Points Analysis, Customizable Alerts, MT5 Indicator Pressure Book - Tick Analysis and Buy/Sell Pressure Indicator for MT5 Pressure Book is a MetaTrader 5 indicator designed to monitor tick-based price movements and display es
Precision Histogram Trend MT5 is a customizable trend histogram indicator for MetaTrader 5, designed to display positive and negative histogram values and visualize changes in momentum direction. Precision Histogram Trend MT5 Precision Histogram Trend MT5 is a customizable histogram indicator for MetaTrader 5 that displays positive and negative values around a central zero line. Its color-coded bars provide a visual representation of changes in histogram direction and magnitude. The indicator
reversal, entry, signal, momentum, non-repaint, precision, alerts, filtered-signals Apex Signal Pro Overview Apex Signal Pro is a technical indicator designed to identify potential reversal points on any chart. It combines momentum analysis with multiple confirmation filters to reduce noise and highlight relevant price reversal conditions. The indicator supports different symbols and timeframes. Confirmed signals are displayed as fixed chart markers, while developing conditions can be indicated
Trend and momentum signals with VWAP-based price analysis, clear entry, stop loss and take profit projections, and configurable alerts for scalping and day trading. Trend Pulse Signal Pro Trend Pulse Signal Pro is a technical indicator for MetaTrader 5 that generates buy and sell signals using a multi-factor model. It is designed for traders seeking a structured approach to signal analysis, with projected entry, stop, and target levels displayed directly on the chart. The indicator does not us
フィルタ:
レビューなし
レビューに返信