Flow Pressure Histogram
- Indicadores
-
Joas Da Silva Veiga
 Olá, eu sou do Brasil. Desenvolvo sozinho minhas próprias ferramentas e indicadores para MT5, baseados nas minhas necessidades e nos meus estudos de day trade. Sou novo aqui no MQL5 e disponibilizo ferramentas e indicadores que eu mesmo uso e desenvolvi, alguns gratuitos e outros pagos. Se você
- Versão: 1.0
- Ativações: 20
Flow Pressure Histogram, Market Flow Indicator, Probability Indicator, Trend Detection, Ranging Detection, Multi-Filter Indicator, Volatility Thermometer, Pattern Recognition, Breakout Alert, Momentum Indicator, Market Pressure, Buy Sell Pressure, Signal Indicator, MT5 Indicator, Forex Indicator
The Multi-Layer Market Flow Indicator for MT5
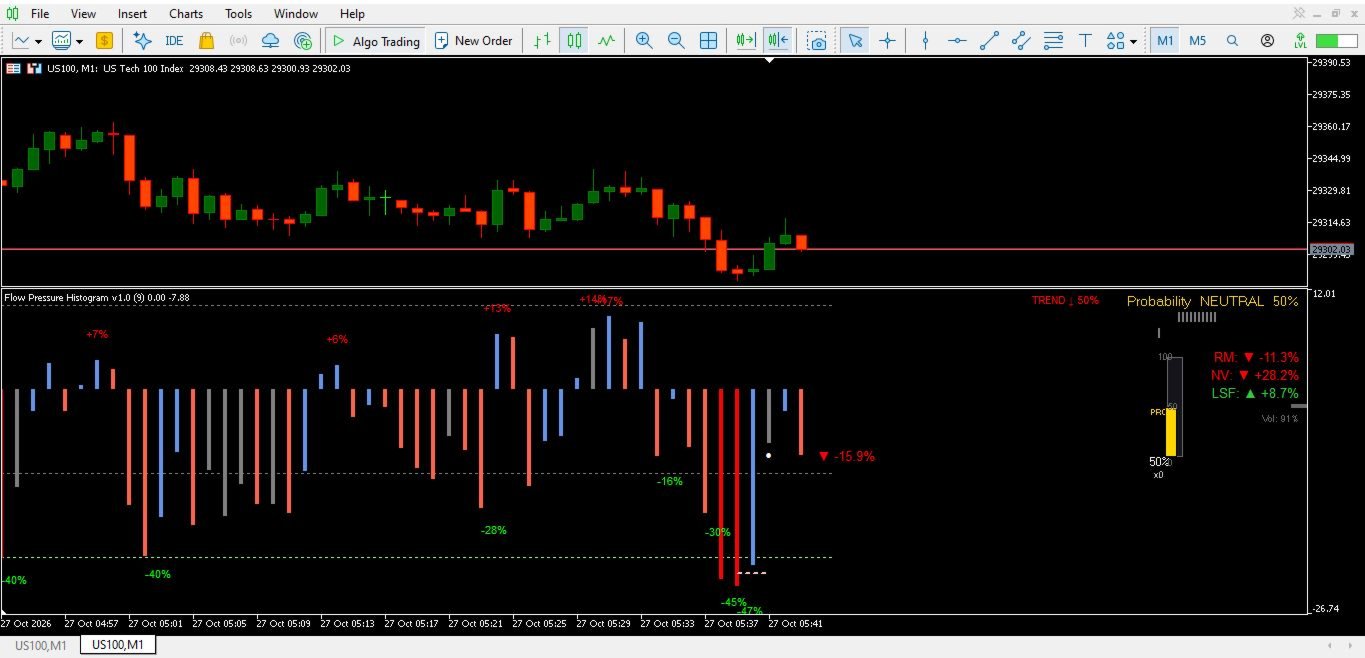
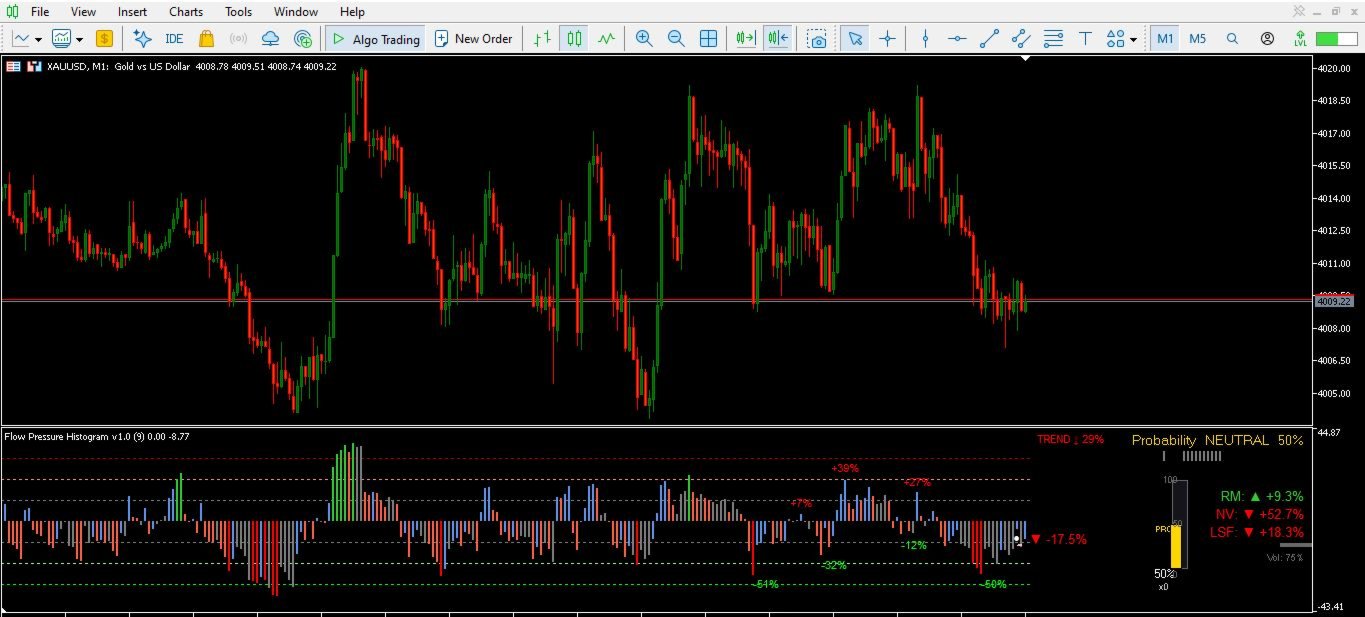
Flow Pressure Histogram is an advanced technical indicator that visualizes real-time buying and selling pressure as a color-coded histogram, enhanced with probability scoring, trend/ranging detection, volatility measurement, and automated pattern recognition. Unlike traditional oscillators that only show momentum direction, this indicator delivers a complete market context in a single sub-window.
Whether you trade forex, indices, or commodities, Flow Pressure Histogram helps you identify when pressure is building, when the market is ranging, and when high-probability setups are forming — without cluttering your main chart.
What Makes This Indicator Different
Most indicators tell you what is happening. Flow Pressure Histogram tells you how strong, in what context, and with what probability.
-
Dual-layer histogram: Green bars above zero indicate bullish pressure; red bars below zero indicate bearish pressure. Bar height reflects intensity, not just direction.
-
Context-aware coloring: Bars change color based on overbought/oversold conditions, sequence breaks, and ranging detection — so you instantly see when momentum is weakening or reversing.
-
Probability engine: A 0–100% score combines momentum strength, accumulation, volume, price confirmation, and trend alignment into a single actionable reading.
-
Trend + Ranging classification: The indicator distinguishes between trending markets (Trend ↑ / Trend ↓) and sideways conditions (Ranging ↑ / Ranging ↓), preventing you from applying trend strategies in choppy markets.
Core Features
1. Market Pressure Histogram
The histogram displays the net pressure between buyers and sellers. Positive values (above zero) indicate bullish pressure; negative values (below zero) indicate bearish pressure. Bar height represents the intensity of that pressure.
Color coding highlights:
-
Blue/Lime: Bullish pressure (Lime = overbought + rising)
-
Red/Tomato: Bearish pressure (Red = oversold + falling)
-
Gray: Ranging / low-conviction conditions
-
Tomato (reversal): Sequence breaks and momentum shifts
2. Probability Score (0–100%)
A sophisticated scoring engine combines multiple factors to estimate the likelihood of directional continuation:
-
Momentum strength relative to the zero line
-
Consecutive bar accumulation
-
Volume confirmation
-
Price alignment with EMA
-
Trend integration
-
Ranging penalty (reduces score during sideways markets)
The score is displayed as a percentage with a visual progress bar. Values above 50% lean bullish; below 50% lean bearish. A dead zone around 50% (±5%) indicates neutrality.
3. Trend & Ranging Detection
The indicator analyzes historical bar data across two windows (short and long) to classify market conditions:
-
Trend ↑ / Trend ↓: Directional momentum with sufficient strength
-
Ranging ↑ / Ranging ↓: Sideways market with slight bias
-
Neutral: No clear direction
A "70% Rule" bonus activates when a high percentage of recent bars align in one direction with sufficient strength, increasing trend confidence.
4. Volatility Thermometer
A visual thermometer measures current volatility relative to the average range. The thermometer animates smoothly, with color reflecting probability direction (green for bullish, red for bearish, gold for neutral). Duration counters show how many bars the current condition has persisted.
5. Real Movement (RM), Net Value (NV), and Last Strength Force (LSF)
Three proprietary metrics provide additional market context:
-
RM (Real Movement): The percentage change in the core oscillator from the previous bar, showing immediate momentum shift
-
NV (Net Value): The accumulated absolute movement within the current bar, representing effort exerted
-
LSF (Last Strength Force): The percentage change of the last closed bar, indicating closing strength
These metrics are displayed in a corner panel with directional arrows and color coding.
6. Pattern Recognition (9 Patterns)
The indicator automatically detects and marks high-probability reversal and continuation patterns:
| Pattern | Type | Description |
|---|---|---|
| Accordion (Sanfona) | Sell | Alternating positive/negative bars with decreasing amplitude |
| Back and Forth (Vai e Volta) | Sell | +, -, -, +, - sequence with a middle peak |
| Slingshot (Estilingue) | Sell | Strong positive, two negatives, higher positive, then negative |
| Bite (Mordida) | Buy | Positive 7–12, negative, positive, positive breakout |
| +3 Bars | Buy | Three declining negative bars followed by a strong positive |
| Snake (Cobra) | Buy | Extended negative sequence followed by strong reversal |
| Pullback 30 | Sell | Drop from above 30 to below 12 |
| Recovery -30 | Buy | Rise from below -30 to above -12 |
| Bite and Fall/Rise | Armed | Neutral zone → extreme → return to neutral |
Each pattern triggers visual dots on the chart and optional alerts (popup, sound, push notification).
7. Breakout ±20 Detection
When the histogram exits the neutral zone (±10), reaches ±20, and returns to neutral on the next bar, the indicator marks the breakout with a colored dot and generates an alert.
8. Percentage Alerts
Configurable alerts trigger when the histogram percentage crosses predefined levels (default: 50%, 60%, 70%, 80%, 90%, 100%) in either direction. Hysteresis prevents alert spam.
9. Level Lines
Horizontal reference lines at ±10, ±20, and ±30 help you visually assess pressure intensity.
10. Ranging Band (Optional)
When ranging is detected, the indicator can draw ceiling and floor lines showing the boundaries of the consolidation zone.
Abbreviations Explained
| Abbreviation | Full Name | Meaning |
|---|---|---|
| RM | Real Movement | Percentage change of the core oscillator from the previous bar. Shows immediate momentum shift. |
| NV | Net Value | Accumulated absolute movement within the current bar. Represents effort exerted by the market. |
| LSF | Last Strength Force | Percentage change of the last closed bar. Indicates closing strength. |
| FPH | Flow Pressure Histogram | The indicator's short name, used in alerts and object prefixes. |
How to Use
Reading the Histogram
-
Above zero + rising bars: Bullish pressure increasing
-
Above zero + falling bars: Bullish pressure weakening (potential reversal)
-
Below zero + falling bars: Bearish pressure increasing
-
Below zero + rising bars: Bearish pressure weakening (potential reversal)
-
Gray bars: Ranging / low conviction — avoid trend-following entries
Interpreting Probability
-
> 70%: Strong bullish probability
-
50–70%: Moderate bullish bias
-
30–50%: Moderate bearish bias
-
< 30%: Strong bearish probability
-
Around 50%: Neutral / wait
Combining Trend and Probability
-
Trend ↑ + Probability > 65%: High-confidence long setup
-
Trend ↓ + Probability < 35%: High-confidence short setup
-
Ranging + Probability near 50%: Stay out or use range strategies
-
Trend + low probability: Momentum may be exhausting — caution
Pattern Signals
Pattern dots appear on the histogram bars. A green dot below a bar indicates a buy pattern; a red dot above a bar indicates a sell pattern. Combine with probability and trend for confirmation.
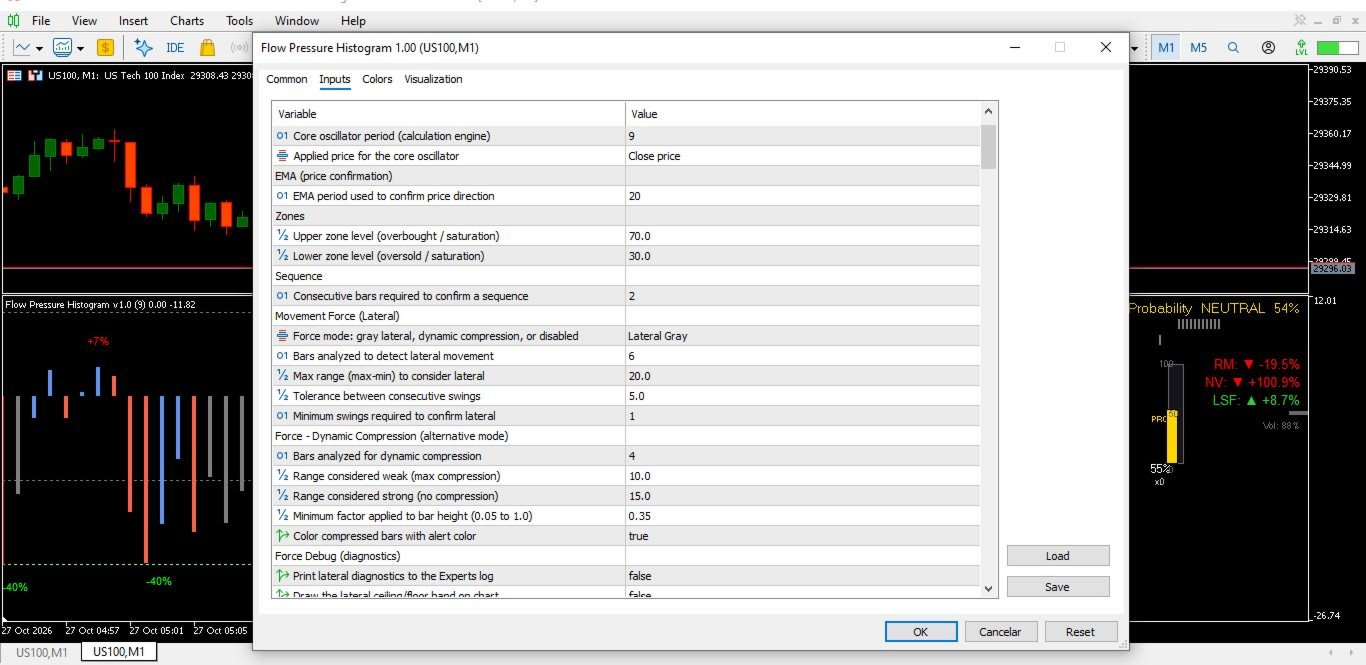
Input Parameters (Summary)
| Group | Key Parameters | Description |
|---|---|---|
| Language | Interface Language | English (default) or Portuguese |
| Pulse | Period, Applied Price | Core oscillator settings |
| EMA | Period | Price confirmation EMA |
| Zones | Overbought, Oversold | Saturation levels |
| Movement Force | Lateral mode, window, range, tolerance, min swings | Ranging detection settings |
| Force Applied to Probability | Use, max reduction, range thresholds | Probability damping in weak markets |
| Force Applied to Trend | Use, range thresholds, min factor | Trend force damping in weak markets |
| Break Line | Show, color, width, style, offset | Sequence break visualization |
| Dot | Show, color, size, code, offset | Sequence confirmation visualization |
| Percentages | Show, tops/bottoms, font size, lateral bars | Percentage labels |
| Real Movement (RM) | Show, arrow, percentage, static, reference | RM panel settings |
| Net Value (NV) | Show, arrow, percentage, history bars | NV panel settings |
| LSF | Percentage | LSF panel settings |
| Volatility | Show, range period, medium/strong levels, smoothing, persistence | Thermometer settings |
| Thermometer | Height, width, position, offset, animation speed, duration, arrow | Visual settings |
| Probability | Show, dead zone, bar, segments, margin, color, throttle | Probability panel settings |
| Trend and Ranging | Show, period, update, strong levels, colors, integration, threshold | Trend/ranging settings |
| 70% Rule | Active, limit, min strong bars, bonus | Trend confidence rule |
| Trend Advanced | Recency weight, slope, two windows, multiplier | Advanced trend settings |
| Vol | Show, period, alert limit, bar width/height/offset, animation, font | Lateral vol bar settings |
| Level Lines | Show, style, width, extra bars | Level line settings |
| Patterns | Enable, alerts, sound, notification, dot settings | Pattern detection settings |
| Breakout 20 | Enable, neutral zone, levels, dot settings | Breakout detection settings |
| Percentage Alerts | Enable, start, step, max, hysteresis, alerts | Percentage alert settings |
| Layout | Right offset, margins, line step | Panel positioning |
| Performance | Max init bars, throttle intervals | Optimization settings |
| Debug | Log, trend, vol | Diagnostic settings |
Recommended Settings
| Trading Style | Timeframe | Probability Threshold | Trend Filter | Pattern Alerts |
|---|---|---|---|---|
| Scalping | M1–M5 | > 65% / < 35% | Trend ↑/↓ only | Enabled |
| Intraday | M15–H1 | > 60% / < 40% | Trend or Ranging | Enabled |
| Swing | H4–D1 | > 55% / < 45% | Trend only | Disabled |
Compatibility
-
Platform: MetaTrader 5
-
Type: Technical Indicator (sub-window)
-
Instruments: Forex, indices, commodities, crypto (any symbol with volume data)
-
Timeframes: All timeframes
-
Account Types: Hedging and Netting
-
Languages: English (default), Portuguese
Important Notes
-
This indicator is a technical analysis tool, not a trading system. It provides context and probability assessment, not guaranteed signals.
-
Probability scores and pattern detection are based on historical data and do not guarantee future results.
-
Always combine with proper risk management and market structure analysis.
-
The indicator does not repaint closed bars. Real-time values on the current bar may change until the bar closes.
-
Alerts are optional and must be configured according to your preferences.
Support
For questions, feature requests, or bug reports, please use the MQL5 Market messaging system. We aim to respond within 24 hours on business days.
Flow Pressure Histogram v1.0 — See the pressure. Read the context. Trade with clarity.