Flow Pressure Histogram

  • Indicatori
  • Joas Da Silva Veiga
    Joas Da Silva Veiga
    Ciao, sono del Brasile. Sviluppo in modo indipendente i miei strumenti e indicatori per MT5, basati sulle mie esigenze e sui miei studi di day trading. Sono nuovo qui su MQL5 e condivido strumenti e indicatori che utilizzo e sviluppo personalmente, alcuni gratuiti e altri a pagamento. Se puoi
  • Versione: 1.0
  • Attivazioni: 20

Flow Pressure Histogram, Market Flow Indicator, Probability Indicator, Trend Detection, Ranging Detection, Multi-Filter Indicator, Volatility Thermometer, Pattern Recognition, Breakout Alert, Momentum Indicator, Market Pressure, Buy Sell Pressure, Signal Indicator, MT5 Indicator, Forex Indicator


Flow Pressure Histogram

The Multi-Layer Market Flow Indicator for MT5

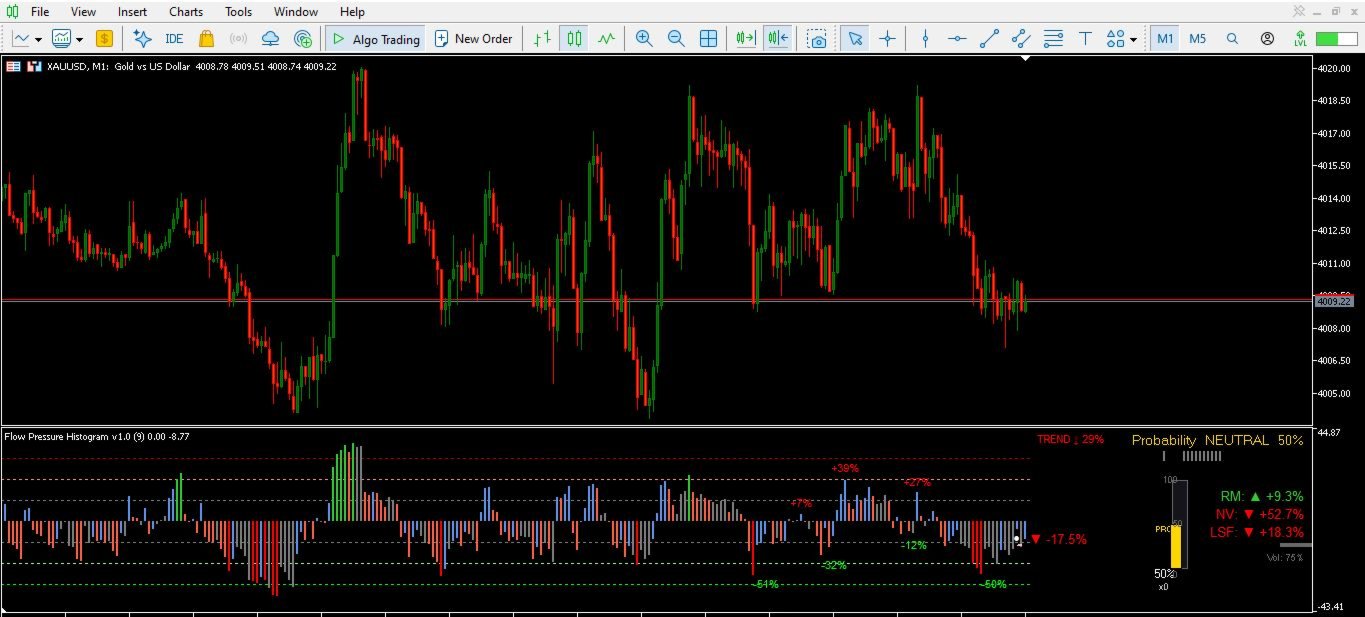
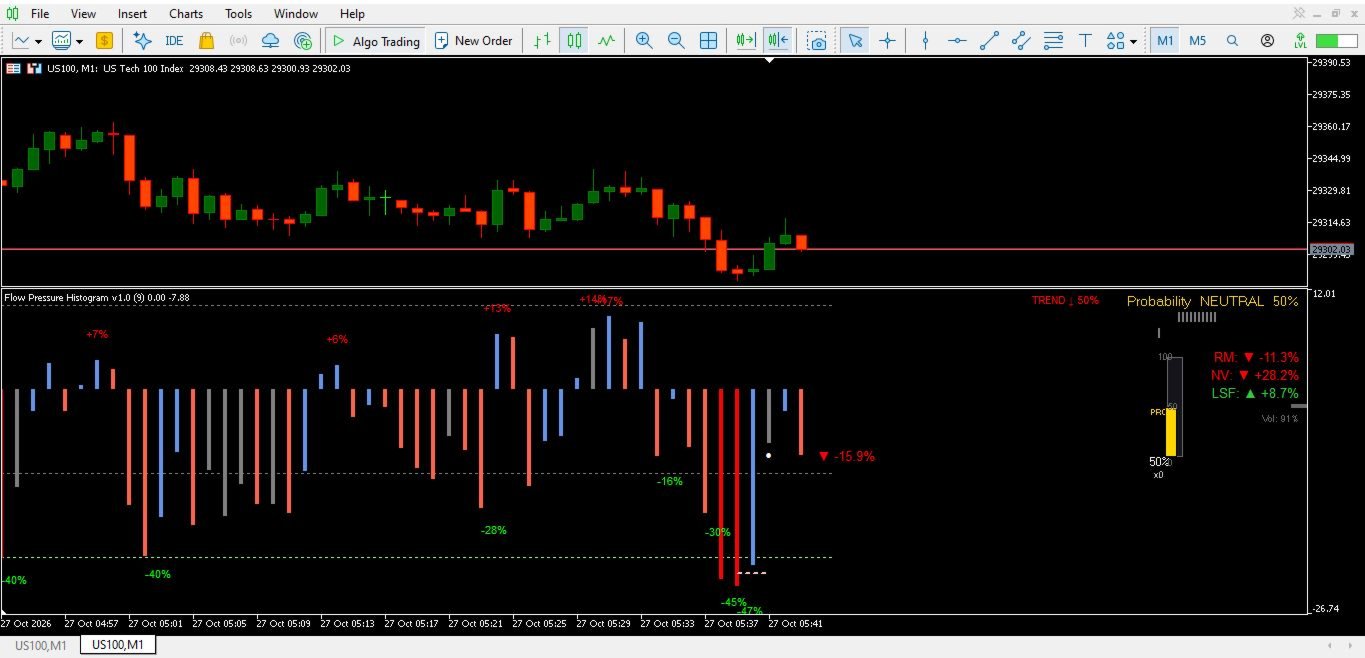
Flow Pressure Histogram is an advanced technical indicator that visualizes real-time buying and selling pressure as a color-coded histogram, enhanced with probability scoring, trend/ranging detection, volatility measurement, and automated pattern recognition. Unlike traditional oscillators that only show momentum direction, this indicator delivers a complete market context in a single sub-window.

Whether you trade forex, indices, or commodities, Flow Pressure Histogram helps you identify when pressure is building, when the market is ranging, and when high-probability setups are forming — without cluttering your main chart.

What Makes This Indicator Different

Most indicators tell you what is happening. Flow Pressure Histogram tells you how strong, in what context, and with what probability.

  • Dual-layer histogram: Green bars above zero indicate bullish pressure; red bars below zero indicate bearish pressure. Bar height reflects intensity, not just direction.

  • Context-aware coloring: Bars change color based on overbought/oversold conditions, sequence breaks, and ranging detection — so you instantly see when momentum is weakening or reversing.

  • Probability engine: A 0–100% score combines momentum strength, accumulation, volume, price confirmation, and trend alignment into a single actionable reading.

  • Trend + Ranging classification: The indicator distinguishes between trending markets (Trend ↑ / Trend ↓) and sideways conditions (Ranging ↑ / Ranging ↓), preventing you from applying trend strategies in choppy markets.

Core Features

1. Market Pressure Histogram

The histogram displays the net pressure between buyers and sellers. Positive values (above zero) indicate bullish pressure; negative values (below zero) indicate bearish pressure. Bar height represents the intensity of that pressure.

Color coding highlights:

  • Blue/Lime: Bullish pressure (Lime = overbought + rising)

  • Red/Tomato: Bearish pressure (Red = oversold + falling)

  • Gray: Ranging / low-conviction conditions

  • Tomato (reversal): Sequence breaks and momentum shifts

2. Probability Score (0–100%)

A sophisticated scoring engine combines multiple factors to estimate the likelihood of directional continuation:

  • Momentum strength relative to the zero line

  • Consecutive bar accumulation

  • Volume confirmation

  • Price alignment with EMA

  • Trend integration

  • Ranging penalty (reduces score during sideways markets)

The score is displayed as a percentage with a visual progress bar. Values above 50% lean bullish; below 50% lean bearish. A dead zone around 50% (±5%) indicates neutrality.

3. Trend & Ranging Detection

The indicator analyzes historical bar data across two windows (short and long) to classify market conditions:

  • Trend ↑ / Trend ↓: Directional momentum with sufficient strength

  • Ranging ↑ / Ranging ↓: Sideways market with slight bias

  • Neutral: No clear direction

A "70% Rule" bonus activates when a high percentage of recent bars align in one direction with sufficient strength, increasing trend confidence.

4. Volatility Thermometer

A visual thermometer measures current volatility relative to the average range. The thermometer animates smoothly, with color reflecting probability direction (green for bullish, red for bearish, gold for neutral). Duration counters show how many bars the current condition has persisted.

5. Real Movement (RM), Net Value (NV), and Last Strength Force (LSF)

Three proprietary metrics provide additional market context:

  • RM (Real Movement): The percentage change in the core oscillator from the previous bar, showing immediate momentum shift

  • NV (Net Value): The accumulated absolute movement within the current bar, representing effort exerted

  • LSF (Last Strength Force): The percentage change of the last closed bar, indicating closing strength

These metrics are displayed in a corner panel with directional arrows and color coding.

6. Pattern Recognition (9 Patterns)

The indicator automatically detects and marks high-probability reversal and continuation patterns:

Pattern Type Description
Accordion (Sanfona) Sell Alternating positive/negative bars with decreasing amplitude
Back and Forth (Vai e Volta) Sell +, -, -, +, - sequence with a middle peak
Slingshot (Estilingue) Sell Strong positive, two negatives, higher positive, then negative
Bite (Mordida) Buy Positive 7–12, negative, positive, positive breakout
+3 Bars Buy Three declining negative bars followed by a strong positive
Snake (Cobra) Buy Extended negative sequence followed by strong reversal
Pullback 30 Sell Drop from above 30 to below 12
Recovery -30 Buy Rise from below -30 to above -12
Bite and Fall/Rise Armed Neutral zone → extreme → return to neutral

Each pattern triggers visual dots on the chart and optional alerts (popup, sound, push notification).

7. Breakout ±20 Detection

When the histogram exits the neutral zone (±10), reaches ±20, and returns to neutral on the next bar, the indicator marks the breakout with a colored dot and generates an alert.

8. Percentage Alerts

Configurable alerts trigger when the histogram percentage crosses predefined levels (default: 50%, 60%, 70%, 80%, 90%, 100%) in either direction. Hysteresis prevents alert spam.

9. Level Lines

Horizontal reference lines at ±10, ±20, and ±30 help you visually assess pressure intensity.

10. Ranging Band (Optional)

When ranging is detected, the indicator can draw ceiling and floor lines showing the boundaries of the consolidation zone.

Abbreviations Explained

Abbreviation Full Name Meaning
RM Real Movement Percentage change of the core oscillator from the previous bar. Shows immediate momentum shift.
NV Net Value Accumulated absolute movement within the current bar. Represents effort exerted by the market.
LSF Last Strength Force Percentage change of the last closed bar. Indicates closing strength.
FPH Flow Pressure Histogram The indicator's short name, used in alerts and object prefixes.

How to Use

Reading the Histogram

  • Above zero + rising bars: Bullish pressure increasing

  • Above zero + falling bars: Bullish pressure weakening (potential reversal)

  • Below zero + falling bars: Bearish pressure increasing

  • Below zero + rising bars: Bearish pressure weakening (potential reversal)

  • Gray bars: Ranging / low conviction — avoid trend-following entries

Interpreting Probability

  • > 70%: Strong bullish probability

  • 50–70%: Moderate bullish bias

  • 30–50%: Moderate bearish bias

  • < 30%: Strong bearish probability

  • Around 50%: Neutral / wait

Combining Trend and Probability

  • Trend ↑ + Probability > 65%: High-confidence long setup

  • Trend ↓ + Probability < 35%: High-confidence short setup

  • Ranging + Probability near 50%: Stay out or use range strategies

  • Trend + low probability: Momentum may be exhausting — caution

Pattern Signals

Pattern dots appear on the histogram bars. A green dot below a bar indicates a buy pattern; a red dot above a bar indicates a sell pattern. Combine with probability and trend for confirmation.

Input Parameters (Summary)

Group Key Parameters Description
Language Interface Language English (default) or Portuguese
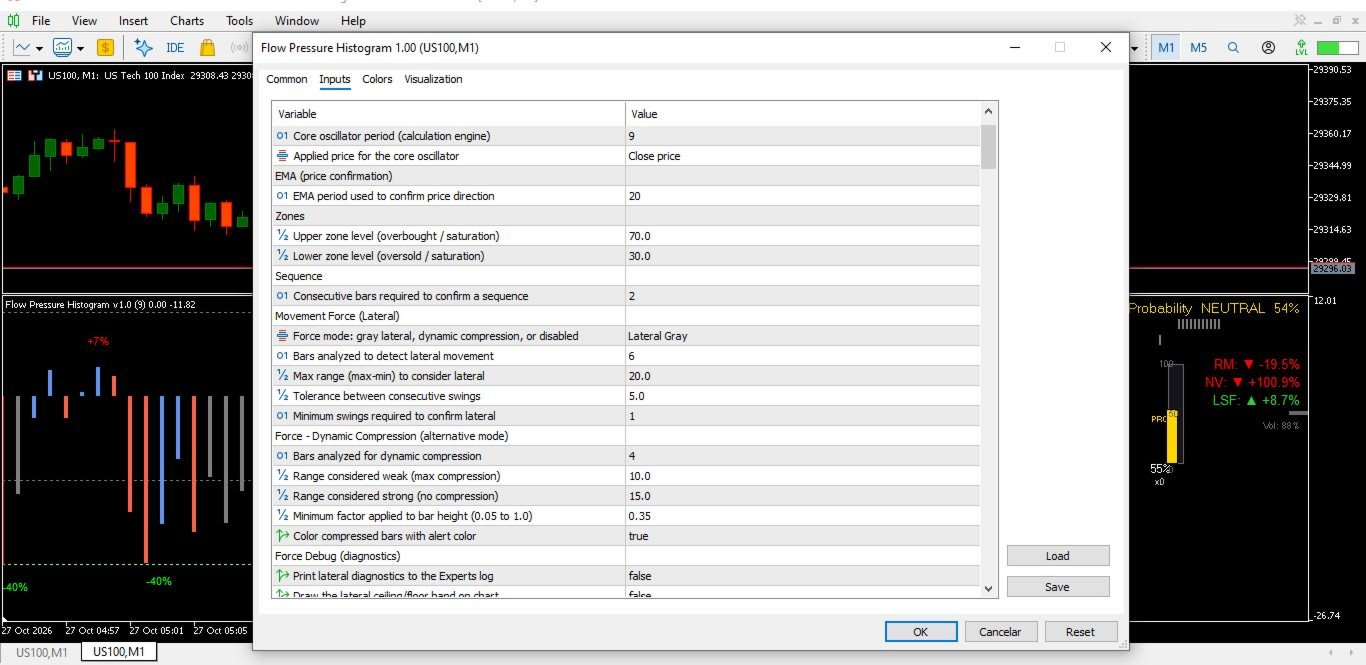
Pulse Period, Applied Price Core oscillator settings
EMA Period Price confirmation EMA
Zones Overbought, Oversold Saturation levels
Movement Force Lateral mode, window, range, tolerance, min swings Ranging detection settings
Force Applied to Probability Use, max reduction, range thresholds Probability damping in weak markets
Force Applied to Trend Use, range thresholds, min factor Trend force damping in weak markets
Break Line Show, color, width, style, offset Sequence break visualization
Dot Show, color, size, code, offset Sequence confirmation visualization
Percentages Show, tops/bottoms, font size, lateral bars Percentage labels
Real Movement (RM) Show, arrow, percentage, static, reference RM panel settings
Net Value (NV) Show, arrow, percentage, history bars NV panel settings
LSF Percentage LSF panel settings
Volatility Show, range period, medium/strong levels, smoothing, persistence Thermometer settings
Thermometer Height, width, position, offset, animation speed, duration, arrow Visual settings
Probability Show, dead zone, bar, segments, margin, color, throttle Probability panel settings
Trend and Ranging Show, period, update, strong levels, colors, integration, threshold Trend/ranging settings
70% Rule Active, limit, min strong bars, bonus Trend confidence rule
Trend Advanced Recency weight, slope, two windows, multiplier Advanced trend settings
Vol Show, period, alert limit, bar width/height/offset, animation, font Lateral vol bar settings
Level Lines Show, style, width, extra bars Level line settings
Patterns Enable, alerts, sound, notification, dot settings Pattern detection settings
Breakout 20 Enable, neutral zone, levels, dot settings Breakout detection settings
Percentage Alerts Enable, start, step, max, hysteresis, alerts Percentage alert settings
Layout Right offset, margins, line step Panel positioning
Performance Max init bars, throttle intervals Optimization settings
Debug Log, trend, vol Diagnostic settings

Recommended Settings

Trading Style Timeframe Probability Threshold Trend Filter Pattern Alerts
Scalping M1–M5 > 65% / < 35% Trend ↑/↓ only Enabled
Intraday M15–H1 > 60% / < 40% Trend or Ranging Enabled
Swing H4–D1 > 55% / < 45% Trend only Disabled

Compatibility

  • Platform: MetaTrader 5

  • Type: Technical Indicator (sub-window)

  • Instruments: Forex, indices, commodities, crypto (any symbol with volume data)

  • Timeframes: All timeframes

  • Account Types: Hedging and Netting

  • Languages: English (default), Portuguese

Important Notes

  • This indicator is a technical analysis tool, not a trading system. It provides context and probability assessment, not guaranteed signals.

  • Probability scores and pattern detection are based on historical data and do not guarantee future results.

  • Always combine with proper risk management and market structure analysis.

  • The indicator does not repaint closed bars. Real-time values on the current bar may change until the bar closes.

  • Alerts are optional and must be configured according to your preferences.

Support

For questions, feature requests, or bug reports, please use the MQL5 Market messaging system. We aim to respond within 24 hours on business days.

Flow Pressure Histogram v1.0 — See the pressure. Read the context. Trade with clarity.
Prodotti consigliati
JT360 DNA Mini PnL Pointer V1.04 Public Compatto. Chiaro. Sempre sott’occhio. JT360 DNA Mini PnL Pointer è un indicatore leggero per MetaTrader 5 che mostra il profitto o la perdita flottante aggregata di tutte le posizioni aperte sul simbolo del grafico corrente. La sua visualizzazione compatta sul grafico combina il PnL basato sul rischio, espresso in R, una sottile mini-barra e una matrice di colori personalizzabile. I colori distintivi JT360, turchese e magenta, evidenziano i valori estremi
FREE
Follow The Line MT5
Oliver Gideon Amofa Appiah
4.6 (35)
This indicator obeys the popular maxim that: "THE TREND IS YOUR FRIEND" It paints a GREEN line for BUY and also paints a RED line for SELL. (you can change the colors). It gives alarms and alerts of all kinds. IT DOES NOT REPAINT and can be used for all currency pairs and timeframes. Yes, as easy and simple as that. Even a newbie can use it to make great and reliable trades. NB: For best results, get my other premium indicators for more powerful and reliable signals. Get them here: https://www.m
FREE
PZ Penta O MT5
PZ TRADING SLU
3.8 (5)
The Penta-O is a 6-point retracement harmonacci pattern which usually precedes big market movements. Penta-O patterns can expand and repaint quite a bit. To make things easier this indicator implements a twist: it waits for a donchian breakout in the right direction before signaling the trade. The end result is an otherwise repainting indicator with a very reliable trading signal. The donchian breakout period is entered as an input. [ Installation Guide | Update Guide | Troubleshooting | FAQ | A
FREE
Indicator and Expert Adviser  EA Available in the comments section of this product. Download with Indicator must have indicator installed for EA to work. Mt5 indicator alerts for bollinger band and envelope extremes occurring at the same time. Buy signal alerts occur when A bullish candle has formed below both the lower bollinger band and the lower envelope  Bar must open and close below both these indicators. Sell signal occur when A bear bar is formed above the upper bollinger band and upper
FREE
The indicator identifies when a divergence occurs between price and an indicator or oscillator. It identifies both regular and hidden divergences. Combined with your own rules and techniques, this indicator will allow you to create (or enhance) your own powerful system. For higher probability setups I can recommend you to use my Supply Demand indicator and trade only if the divergence occurs inside a zone. Supply zone for bearish div and demand zone for bullish div. The optimal scenario is if it
FREE
Donchian Channel DC is the indicator of Donchian Channels, that plots maximum and minimum values of a specific period, besides mean value line. It´s possible to configure simple period for analysis and the indicator will plot all three values. You can trade with this indicator as trend or reversal, according to each strategy. Do not let to test others indicators as soon as others expert advisors.
FibRetrace Zones Zone di ritracciamento di Fibonacci dell'ultimo swing FibRetrace Zones è il complemento visivo gratuito dell'Expert Advisor FibRetrace. Disegna i livelli di ritracciamento di Fibonacci ed evidenzia la zona di pullback dell'ultimo swing, così vedete dove si allineano gli ingressi prima di operare. La zona è colorata in base alla direzione: verde per i setup rialzisti, rosso per quelli ribassisti. Funziona su qualsiasi simbolo e qualsiasi timeframe. CARATTERISTICHE PRINCIPALI Rile
FREE
Haven Key Levels PDH PDL
Maksim Tarutin
4.92 (12)
L'indicatore   "Haven Key Levels PDH PDL"   aiuta i trader a visualizzare i livelli chiave sul grafico. Marca automaticamente i seguenti livelli: DO (Daily Open)   — Livello di apertura giornaliera. NYM (New York Midnight)   — Livello di mezzanotte di New York. PDH (Previous Day High)   — Massimo del giorno precedente. PDL (Previous Day Low)   — Minimo del giorno precedente. WO (Weekly Open)   — Livello di apertura settimanale. MO (Monthly Open)   — Livello di apertura mensile. PWH (Previous We
FREE
Session Profiles
Basharat Umar Khan
Short Description Draws rolling Time-Price-Opportunity (TPO) and footprint volume profiles for the Asia, London, and New York sessions with POC/VAH/VAL levels, delta volume bias, order flow overlays, liquidity heatmaps, developing rolling lines, Naked POC (NPOC) tracking, Initial Balance breakouts, multi-session confluence zones, and automatic broker GMT-offset detection. Full Description Plots separate market-profile and volume-profile style histograms for the three major trading sessions (Asi
FREE
Easy Correlations Indicator The Easy Correlations Indicator is designed to help traders analyze the relationship between two correlated instruments. By monitoring the distance between their Relative Strength Index (RSI) values, the indicator highlights situations where one instrument has moved significantly further than the other. This creates potential trading opportunities: Sell the stronger instrument (overstretched RSI) Buy the weaker instrument (lagging RSI) Because the positions are opened
FREE
MA Cross Signals
Quang Vinh Nguyen
5 (1)
MA Cross Marker helps traders visualize market direction with two customizable moving averages and clear crossover signals. It can display MA lines from one selected timeframe on the current chart and mark bullish or bearish crosses automatically. Designed for traders who want a lightweight, easy-to-read MA crossover tool. Key Features Display two customizable Moving Averages Automatic Buy/Sell signals on MA crossover Single timeframe MA selection (including higher timeframe display) Clean and
FREE
Are you tired of drawing trendlines every time you're analyzing charts? Or perhaps you would like more consistency in your technical analysis. Then this is for you. This indicator will draw trend lines automatically when dropped on a chart. How it works Works similar to standard deviation channel found on mt4 and mt5. It has 2 parameters: 1. Starting Bar 2. Number of bars for calculation The   starting bar   is the bar which drawing of the trend lines will begin, while the   number of bars for c
FREE
Goldcrest Indicator — Free Gold Trading Signals for MetaTrader 5 Engineered for Gold. Built for Precision. Goldcrest Indicator is a free, powerful, and easy-to-use MetaTrader 5 indicator designed to help traders identify potential trading opportunities in the gold market (XAUUSD). Built using the proprietary Goldcrest signal-detection framework, the indicator monitors market conditions and displays clear BUY and SELL signals with entry prices and initial SL references directly on your chart , he
FREE
Important Lines
Terence Gronowski
4.88 (24)
This indicator displays Pivot-Lines, preday high and low, preday close and the minimum and maximum of the previous hour. You just have to put this single indicator to the chart to have all these important lines, no need to setup many single indicators. Why certain lines are important Preday high and low : These are watched by traders who trade in a daily chart. Very often, if price climbs over or falls under a preday low/high there is an acceleration in buying/selling. It is a breakout out of a
FREE
DALA Forecast
Grigorii Matsnev
About the indicator: DALA Forecast is a universal tool for predicting the dynamics of time series of any nature. For prediction, modified methods of nonlinear dynamics analysis are used, on the basis of which a predictive model is built using machine learning methods.  To get the trial version of the indicator, you can contact me in private messages. How to use the indicator: Apply the indicator to your chosen financial instrument or indicator with the settings you need. The prediction will be
FREE
ToolBot Probabilistic Analysis
Josue De Matos Silva
4 (1)
ToolBot Probabilistic Analysis - FREE   An effective indicator for your negotiations The toolbot indicator brings the calculation of candles and a probabilistic analysis so that you have more security on your own. Also test our  FREE tops and bottoms indicator: :   https://www.mql5.com/pt/market/product/52385#description Also test our  FREE (RSI, ATR, ADX, OBV) indicator:   https://www.mql5.com/pt/market/product/53448#description Try our EA ToolBot for free:   https://www.mql5.com/market/prod
FREE
High Low Open Close
Alexandre Borela
4.98 (46)
Se ti piace questo progetto, lascia una recensione a 5 stelle. Questo indicatore disegna i prezzi aperti, alti, bassi e di chiusura per i specificati periodo e può essere regolato per un determinato fuso orario. Questi sono livelli importanti guardati da molti istituzionali e professionali commercianti e può essere utile per voi per conoscere i luoghi dove potrebbero essere più attivo. I periodi disponibili sono: Giorno precedente. Settimana precedente. Mese precedente. Precedente trimestre. A
FREE
The indicator detects and displays М. Gartley's Butterfly pattern. The pattern is plotted by the extreme values of the ZigZag indicator (included in the resources, no need to install). After detecting the pattern, the indicator notifies of that by the pop-up window, a mobile notification and an email. The pattern and wave parameters are displayed on the screenshots. The default parameters are used for demonstration purposes only in order to increase the amount of detected patterns. Parameters z
Disegna i prezzi di apertura giornalieri, settimanali e mensili correnti e precedenti come linee etichettate, i livelli che molti trader intraday usano come punti di bias e di reazione. Caratteristiche principali Calcolato sulle barre chiuse, i valori non vengono ridisegnati Funziona su qualsiasi simbolo e timeframe Tutti i periodi, i livelli e i colori possono essere modificati negli input Leggero sulle risorse grazie all'impostazione del numero massimo di barre Gli oggetti vengono rimossi auto
FREE
Menora Indicator
Arnold Kurapa
4.5 (2)
Menora (All In One) Indicator. This is the advanced and premium indicator for the Magic Trend, a free indicator.  It has 3 output signals driven by different market conditions. This indicator has a double function of working as an indicator and utility at the same time. Specifications  1]  3 output signals a) Slow Moving Average with color change - The MA has a non-repaint color change, which makes it perfect for entry signals. b) Fast Moving Average (the original Magic Trend line) - Gives a
FREE
KMB Smart Pattern Analyzer PRO
Karwan Msto Mohammed Mohammed
Panoramica del prodotto KMB Smart Pattern Analyzer PRO è un indicatore avanzato di analisi tecnica progettato per rilevare e classificare pattern di mercato con un elevato livello di corrispondenza all'interno di un intervallo del grafico definito dall'utente. L'indicatore combina più motori di analisi in un unico strumento professionale: Analisi dei pattern candlestick Riconoscimento dei pattern grafici classici Rilevamento delle strutture armoniche Analisi della struttura di mercato / SMC Inve
FREE
TrendVision AI
Murtadha Majid Jeyad Al-Khuzaie
TrendVision AI – Smart Trend Channels & Price Forecasting for MetaTrader 5 Discover market structure and explore potential future price direction with TrendVision AI, an advanced technical indicator for MetaTrader 5 that combines automatic trendline analysis with a machine-learning-based price forecasting model. How Does TrendVision AI Work? TrendVision AI analyzes historical candlestick data within a configurable lookback window. It automatically draws two trendlines directly on the chart:
FREE
BBMA with EMA50
Teeraporn Satitman
This indicator consist of Standard BBMA Standard signal Sign on chart added EMA50 Behavior Tracking: The chart background changes color based on the EMA50 (default is black) and shifts to white when a breakout of the Bollinger Bands occurs. Three Engulfing Color Change: Automatically adjusts colors to help you easily determine market zones. default yellow/white High-Low Line Sign: Highlights the potential trading range and key price levels for better visual  MHV
FREE
LT Donchian Channel
Thiago Duarte
4.86 (7)
Donchian Channel is an indicator created by Richard Donchian. It is formed by taking the highest high and the lowest low of the last specified period in candles. The area between high and low is the channel for the chosen period. Its configuration is simple. It is possible to have the average between the upper and lower lines, plus you have alerts when price hits one side. If you have any questions or find any bugs, please contact me. Enjoy!
FREE
Cet indicateur innovant de mesure de la force des devises de INFINITY est une aide indispensable pour les scalpers et les commerçants qui négocient à long terme. Le système d'analyse De la force/faiblesse des devises est connu depuis longtemps et utilisé sur le marché par les principaux traders du monde. Tout commerce d'arbitrage n'est pas complet sans cette analyse. Notre indicateur détermine facilement la force des devises sous-jacentes les unes par rapport aux autres. Il affiche des graphiqu
FREE
Deviation Trend Profile Overview Deviation Trend Profile is a MetaTrader 5 chart indicator that combines three visual layers in a single chart window: a moving average with momentum-based coloring, deviation bands calculated from volatility, and a horizontal distribution profile drawn to the right of the current price. The indicator is an analytical tool. It does not open, modify or close trades, and it is not a complete trading system. It is designed to help the user observe trend direction, mo
FREE
SMC Indicator Plus
Jose Dolores Vergara Dietrich
View the main Smart Money Concepts areas of interest directly on your chart and make decisions with greater clarity, agility, and context. The SMC Indicator identifies areas that may act as potential price reaction or reversal points, helping traders plan the entire trade: entry, stop-loss placement, trade management, and profit-taking. With these areas mapped out, you can look for better-positioned entries, define potentially tighter technical stops, assess the risk-to-reward ratio more effecti
FREE
如果产品有任何问题或者您需要在此产品上添加功能,请联系我 Contact/message me if you encounter any issue using the product or need extra feature to add on the base version. Floating Highest Lowest MT5 provides you an intuitive and user-friendly method to monitor the floating highest (profit) and lowest (loss) that all your trades together ever arrive. For example, I opened 3 orders, which arrived at $4.71 floating profit when trade following trend. Later when the trend is against me, these 3 orders arrive $30 in loss, and a
FREE
Renko subwindow
Alexandre Vincent Traber
Overview Renko SubWindow traccia un grafico Renko con candele colorate in una finestra indicatore separata, senza influire sul grafico principale. La dimensione del mattone può essere fissa in punti o calcolata dinamicamente tramite ATR per mattoni adattivi basati sulla volatilità. How it works Ricostruisce i mattoni Renko dai prezzi di chiusura del simbolo/timeframe corrente. Un nuovo mattone si forma quando il prezzo supera la dimensione definita dalla chiusura del mattone precedente. I matton
FREE
TradeQL
Abdiel Aviles Jimenez
The TradeQL Indicator is a customizable tool that highlights specific trading patterns on candlestick charts. Users can define patterns through TradeQL queries, which the indicator then applies to the chart, visually representing matches and captured groups. Ideal for identifying complex trade setups in real-time. TradeQL queries are specified using the TradeQL Language. See https://github.com/abdielou/tradeql for more details. This language is expressed as a regular expression. The language al
FREE
Gli utenti di questo prodotto hanno anche acquistato
Trend Sniper X
Sarvarbek Abduvoxobov
4.86 (43)
Trend Sniper X è un indicatore trend-following multi-timeframe per MetaTrader 5 che aiuta i trader a identificare la direzione del trend e i potenziali punti di inversione con chiarezza e precisione. per MT4: https://www.mql5.com/en/market/product/193245 Informazioni sul prezzo: Il prezzo attuale è promozionale ed è soggetto a modifiche con il rilascio di futuri aggiornamenti e nuove funzionalità. Offerta Bonus: Per ricevere GRATIS l'Auto-Trade Assistant EA per questo indicatore, invia un messa
Un nuovo Re in città - Indicatore + Gestione ordini (TP1 + TP2 + TP3) + Invio opzionale di segnali Telegram INCLUSO (GRATIS) (SISTEMA COMPLETO DI TRADING e SEGNALI) Il nostro miglior EA per l’Oro: Gold Slayer Questo indicatore include una strategia avanzata, un sistema di trading con gestione ordini personalizzabile e un sistema mean reversion che combina estensioni di envelope, supportato da molteplici filtri intelligenti di conferma come RSI per individuare ingressi di inversione ad alta proba
Smart Trend Trading System — MetaTrader 5 Dopo l'acquisto, inviami un messaggio su MQL5 per ricevere GRATUITAMENTE Smart Universal Expert Advisor, insieme al corso online, al manuale PDF e all'accesso al gruppo privato. STTS riunisce la direzione del trend, i segnali di entrata e uscita, le zone di inversione e i livelli di prezzo importanti direttamente sul grafico. Segui il sistema manualmente oppure collega un EA compatibile separato per eseguire le operazioni automaticamente con le impostazi
M5 Sniper
MeanFX
5 (3)
Porta il tuo vantaggio nel trading sotto i riflettori! M5 Sniper è un nuovo indicatore di MeanFX. Combina segnali di trading precisi con livelli TP/SL adattivi , creando così le migliori operazioni statistiche possibili! Il prezzo aumenta ogni 5 acquisti, il prossimo prezzo è di 69$ Scrivimi dopo l'acquisto per ricevere consigli/guida e un EA bonus Cosa lo rende diverso? Performance statistica comprovata su Gold XAUUSD ( funziona su quasi ogni asset , concentrandosi sulla padronanza di un singol
SuperScalp Pro
Van Minh Nguyen
4.54 (37)
SuperScalp Pro - Professional Multi-Layer Confluence Scalping System SuperScalp Pro è un indicatore di scalping avanzato che potenzia il Supertrend classico con diversi filtri intelligenti di conferma. Aiuta a individuare opportunità di trading Buy/Sell con una maggiore probabilità di successo, riducendo significativamente i falsi segnali. Le frecce Buy e Sell vengono visualizzate chiaramente direttamente sul grafico, insieme ai livelli di Stop Loss e Take Profit basati sull’ATR, calcolati autom
SMC Intraday Formula
VividMind Digital Solutions
5 (26)
Cominciamo con la verità. Nessun indicatore da solo ti renderà profittevole. Se qualcuno ti dice il contrario, ti sta vendendo un sogno. Qualsiasi indicatore che mostra frecce perfette di acquisto/vendita può essere reso impeccabile — basta ingrandire la giusta sezione della storia e catturare solo i trade vincenti. Noi non lo facciamo.  SMC Intraday Formula è uno strumento. Legge la struttura del mercato per te, identifica le zone a più alta probabilità e ti mostra esattamente come appare la t
La leggenda ritorna: Entry Points Pro 10. Il rilancio del leggendario indicatore che per 3 anni è rimasto nella Top-3 del MQL5 Market. Oltre 600 recensioni su due versioni, migliaia di trader lo usano ogni giorno per operare, oltre 28.000 download della demo   MT4+MT5 . Ho letto ogni vostra recensione degli ultimi cinque anni — e invece di promesse ho inserito nella versione 10 le risposte. Dall'autore che opera sui mercati dal 1999 e tiene all'onestà, alla propria reputazione e ai propri client
Auto Optimized SpeedAngle è un sistema di vettorizzazione del momento di livello istituzionale che elimina l'overfitting ( curve-fitting ) attraverso l'ottimizzazione continua Walk-Forward (WFO). Invece di affidarsi a input statici che si degradano quando i regimi di mercato cambiano, l'indicatore recalibra dinamicamente i suoi parametri utilizzando la validazione Out-of-Sample (OOS), assicurando che i segnali visualizzati rappresentino reali vantaggi statistici anziché anomalie storiche. Quadro
ARIPoint
Temirlan Kdyrkhan
1 (4)
ARIPoint is a powerful trading companion designed to generate high-probability entry signals with dynamic TP/SL/DP levels based on volatility. Built-in performance tracking shows win/loss stats, PP1/PP2 hits, and success rates all updated live. Key Features: Buy/Sell signals with adaptive volatility bands Real-time TP/SL/DP levels based on ATR Built-in MA Filter with optional ATR/StdDev volatility Performance stats panel (Success, Profit/Loss, PP1/PP2) Alerts via popup, sound, push, or email Cu
Gann Made Easy è un sistema di trading Forex professionale e facile da usare che si basa sui migliori principi del trading utilizzando la teoria di mr. WD Gann. L'indicatore fornisce segnali ACQUISTA e VENDI accurati, inclusi i livelli di Stop Loss e Take Profit. Puoi fare trading anche in movimento utilizzando le notifiche PUSH. CONTATTAMI DOPO L'ACQUISTO PER RICEVERE GRATUITAMENTE LE ISTRUZIONI DI TRADING E OTTIMI INDICATORI EXTRA! Probabilmente hai già sentito parlare molte volte dei metodi d
M1 Sniper MT5
Oleg Rodin
5 (7)
M1 SNIPER   è un sistema di indicatori di trading facile da usare. Si tratta di un indicatore a freccia progettato per l'intervallo temporale M1. L'indicatore può essere utilizzato come sistema autonomo per lo scalping sull'intervallo temporale M1 e come parte del tuo sistema di trading esistente. Sebbene questo sistema di trading sia stato progettato specificamente per il trading sull'intervallo temporale M1, può comunque essere utilizzato anche con altri intervalli temporali. Inizialmente ho p
Adaptive Price Action Engine Acquista un indicatore, ricevi l'EA gratis Analisi Auto-Ottimizzata del Trend e dei Pattern Candlestick Multi-Timeframe I mercati cambiano continuamente e non tutti i pattern di Price Action hanno lo stesso valore in ogni condizione di mercato. Adaptive Price Action Engine è progettato per adattarsi alle condizioni di mercato in continua evoluzione, combinando struttura del trend, analisi Multi-Timeframe, pattern Candlestick e ottimizzazione statistica in un unico fr
Power Candles MT5
Daniel Stein
4.58 (12)
Power Candles V3 - Indicatore di forza ad ottimizzazione automatica Power Candles V3 trasforma la forza delle valute e degli strumenti in un piano di trading attuabile su ogni grafico a cui è collegato. Invece di limitarsi a colorare le candele, esegue un'auto-ottimizzazione in tempo reale in background e ti fornisce i migliori valori di Stop Loss, Take Profit e soglia di segnale per il simbolo che hai davanti. Basta un clic per adottarlo nel trading live: i raggi di ingresso, Stop Loss e Take P
Prossimo aggiornamento — Versione 2.52 in arrivo! [NOVITÀ] Preparati a 4 nuove funzionalità principali progettate per migliorare la tua analisi di mercato e il tuo flusso di lavoro nel trading Portiamo l’analisi di mercato a un livello superiore con 4 nuove funzionalità progettate per soddisfare le tue esigenze di trading. Ecco le novità: 1. TRADE OVERVIEW DASHBOARD 2. CONFLUENCE AT ZONE 3. STRONG & WEAK HIGH/LOW 4. OTE 1. TRADE OVERVIEW DASHBOARD Una dashboard che ti aiuta a comprendere più fa
Boba Analysis Suite
Trade Ready Solutions LLC
5 (2)
Boba Analysis Suite Boba Analysis Suite è un indicatore di analisi per MetaTrader 5. Riunisce la struttura del mercato, le zone di prezzo rilevanti e il contesto generale del mercato in un’unica visualizzazione del grafico. Sviluppato sulla base dell’esperienza pratica come trader e formatore di trading, supporta un processo di analisi strutturato: valutare la direzione del mercato, individuare livelli importanti e analizzare congiuntamente più intervalli temporali. Analisi nel contesto del merc
FiboSniper Pro
Van Minh Nguyen
5 (4)
FiboSniper Pro – Multi-Filter Fibonacci System with Auto SL/TP and Control Panel FiboSniper Pro è un indicatore tecnico che combina Fibonacci Envelopes dinamici con diversi filtri di conferma per generare segnali Buy e Sell selezionati. I livelli di Fibonacci vengono calcolati sulla base di Moving Average e ATR e successivamente filtrati tramite ADX, EMA, RSI, ATR, Volume, Time e struttura delle candele. L’indicatore visualizza direttamente sul grafico i livelli automatici di Stop Loss e Take Pr
Trend Catcher ind mt5
Ramil Minniakhmetov
5 (18)
INDICATORE TREND CATCHER L'indicatore Trend Catcher analizza i movimenti dei prezzi di mercato, utilizzando una combinazione di indicatori di analisi del trend proprietari dell'autore e personalizzati. Identifica la vera direzione del mercato filtrando il rumore a breve termine e concentrandosi sulla forza del momentum sottostante, sull'espansione della volatilità e sul comportamento della struttura dei prezzi. Utilizza inoltre una combinazione di indicatori personalizzati di smoothing e filtr
Quantum TrendPulse
Bogdan Ion Puscasu
5 (26)
Ecco   Quantum TrendPulse   , lo strumento di trading definitivo che combina la potenza di   SuperTrend   ,   RSI   e   Stocastico   in un unico indicatore completo per massimizzare il tuo potenziale di trading. Progettato per i trader che cercano precisione ed efficienza, questo indicatore ti aiuta a identificare con sicurezza le tendenze di mercato, i cambiamenti di momentum e i punti di entrata e uscita ottimali. Caratteristiche principali: Integrazione SuperTrend:   segui facilmente l'andame
Neuro Poseidon MT5
Daria Rezueva
4.75 (52)
Neuro Poseidon is a new indicator by Daria Rezueva. It combines precise trading signals with adaptive TP/SL levels - creating best possible trades as a result! Message me and get  Neuro Poseidon Assistant  as a gift to automize your trading process! What makes it stand out? 1. Proven profitability on all assets and timeframes 2. Only confirmed BUY and SELL signals present on the chart 3. Adaptive TP & SL levels generated by the software for each trade 4. Easy to understand - suitable for al
Azimuth Pro
Ottaviano De Cicco
5 (7)
Azimuth Pro V2: Synthetic Fractal Structure and Confirmed Entries for MT5 Overview Azimuth Pro is a multi-level swing structure indicator by Merkava Labs . Four nested swing layers, swing-anchored VWAP, ABC pattern detection, three-timeframe structural filtering, and closed-bar confirmed entries — one chart, one workflow from micro-swings to macro-cycles. This is not a blind signal product. It is a structure-first workflow for traders who care about location, context, and timing. Halloween P
Presentazione       Quantum Breakout PRO   , l'innovativo indicatore MQL5 che sta trasformando il modo in cui scambi le zone di breakout! Sviluppato da un team di trader esperti con un'esperienza di trading di oltre 13 anni,       Quantum Breakout PRO       è progettato per spingere il tuo viaggio di trading a nuovi livelli con la sua strategia innovativa e dinamica della zona di breakout. Quantum Breakout Indicator ti fornirà frecce di segnalazione sulle zone di breakout con 5 zone target di
Indicatore multi-valuta di forza e momentum MT5 Dynamic Forex28 Navigator è l'evoluzione dei nostri indicatori popolari da lungo tempo e unisce la potenza di tre strumenti in uno: Advanced Currency Strength28 Indicator (700 recensioni) Advanced Currency IMPULSE with ALERT (530 recensioni) CS28 Combo Signals (bonus attuale) I due indicatori precedenti hanno insieme più di 1.200 recensioni sul MQL5 Market e sono un punto di riferimento nella comunità MT4 dal 2016. Dynamic Forex28 Navigator MT5 por
Scalper Vault è un sistema di trading potente e completo, progettato per i trader che desiderano ottenere risultati costanti nel trading intraday. Questo indicatore ad alta precisione funge da sistema di trading autonomo, offrendo analisi di livello istituzionale sia per il mercato Forex che per le Opzioni Binarie. CONTATTAMI DOPO L'ACQUISTO PER RICEVERE I MIEI CONSIGLI DI TRADING E UN FANTASTICO BONUS! Eliminando le congetture e le complesse analisi manuali, Scalper Vault ti permette di concen
Volatility Master for MetaTrader is a real-time dashboard tool that scans up to  50 symbols  to identify high-volatility , trending markets instantly. With bullish/bearish signals, customizable alerts, and a user-friendly interface, it helps you avoid range-bound conditions and focus on high-probability trades. Clarity leads to confidence. Trade confidently and protect your capital effectively with this powerful dashboard. We don't offer free or bonus indicators in exchange of reviews from you.
SR Liquidity   è un indicatore di trading progettato per individuare le zone nascoste in cui si concentra la liquidità di mercato e dove il prezzo reagisce con maggiore intensità. Queste aree di liquidità agiscono come potenti livelli di supporto e resistenza, offrendo una mappa chiara dei punti in cui è più probabile che il mercato inverta la propria direzione. Invece di tracciare le classiche linee di supporto e resistenza, SR Liquidity analizza l'effettivo comportamento dei prezzi per individ
OrderFlux – Indicatore Orderflow Footprint Chart, Volume Profile e Market Profile per MetaTrader 5 OrderFlux è un indicatore Footprint di Order Flow per MetaTrader 5 che permette di osservare direttamente cosa accade all’interno di ogni candela. Mostra il volume scambiato a ogni livello di prezzo, distinguendo gli acquirenti aggressivi dai venditori aggressivi. A partire dai tick, costruisce in tempo reale un grafico Footprint completo con delta, squilibri, assorbimento, Volume Profile, Market P
Crystal Heikin Ashi Signals
Muhammad Jawad Shabir
5 (5)
Crystal Heikin Ashi Signals—Professional Trend & Signal Detection Indicator Advanced Heikin Ashi Visualization with Intelligent Signal System for Manual & Automated Trading Final Price: $149 ---------> Price goes up $10 after every 10 sales . Limited slots available — act fast . Overview User Guide PDF Crystal Heikin Ashi Signals is a professional-grade MetaTrader 5 indicator that combines pure Heikin Ashi candle visualization with an advanced momentum-shift detection system. Designed for both m
Advanced Supply Demand MT5
Bernhard Schweigert
4.53 (15)
La migliore soluzione per qualsiasi principiante o trader esperto! Questo indicatore è uno strumento di trading unico, di alta qualità e conveniente perché abbiamo incorporato una serie di funzionalità proprietarie e una nuova formula. Con questo aggiornamento, sarai in grado di mostrare fusi orari doppi. Non solo potrai mostrare una TF più alta, ma anche entrambe, la TF del grafico, PIÙ la TF più alta: SHOWING NESTED ZONES. Tutti i trader di domanda di offerta lo adoreranno. :) Informazioni imp
Precision Spike Detector
Francisco Mandomo Simbine
5 (2)
Precision Spike Detector V3 – Institutional-Grade AI Trading System Attention: The price increases by US$50 for every 10 purchases.  Final price: US$599 Precision Spike Detector V3   is a   state-of-the-art, institutional-grade market analysis system   for   MetaTrader 5 , designed to detect   high-probability market movements   in synthetic indices such as   Boom, Crash, GainX, and PainX . After purchase, send me a private message to receive the optimized configuration files,  the installation
Matreshka
Dimitr Trifonov
5 (2)
Matreshka self-testing and self-optimizing indicator: 1. Is an interpretation of the Elliott Wave Analysis Theory. 2. Based on the principle of the indicator type ZigZag, and the waves are based on the principle of interpretation of the theory of DeMark. 3. Filters waves in length and height. 4. Draws up to six levels of ZigZag at the same time, tracking waves of different orders. 5. Marks Pulsed and Recoil Waves. 6. Draws arrows to open positions 7. Draws three channels. 8. Notes support and re
Altri dall’autore
QuantumTrade Panel
Joas Da Silva Veiga
5 (2)
tendenza,analisi di tendenza,segnali,allarmi,pannello di trading,cruscotto,contesto di mercato,scalping,intraday,day trading,swing trading,no repaint,senzarepaint,gestione del rischio,rischio rendimento, supporto resistenza,zone domanda offerta,pressione acquisto vendita,forex,cripto,multi timeframe Il pannello è uno strumento avanzato di analisi del mercato che trasforma i dati di prezzo e volume in segnali chiari di tendenza, pressione di acquisto/vendita e proiezioni oggettive di trading, i
FREE
Trading Panel Prime
Joas Da Silva Veiga
Pannello di trading,Trading manuale,Gestione ordini,Gestione del rischio,Trade Manager,Assistente di trading,Stop Loss,Take Profit,Trailing Stop,Scalping Importante Per il corretto funzionamento di JoPanel Prime è obbligatorio abilitare l'opzione "Algo Trading" in MetaTrader 5. Se questa opzione non è attivata, il pannello non funzionerà. JoPanel Prime è un pannello professionale per il trading manuale sviluppato per MetaTrader 5. È stato progettato per eseguire gli ordini e gestire le posi
FREE
Dual Clock Pro
Joas Da Silva Veiga
clock,  Server Time, Local Time, MT5 Clock, Clock Indicator, Digital Clock DualClockPro - Local and Server Clock for MetaTrader 5 DualClockPro is a visual clock indicator for MetaTrader 5 that displays local computer time and trading server time directly on the chart. It also supports displaying the corresponding dates, helping traders monitor time differences between their local environment and the broker's server. The panel has a compact design and customizable settings, allowing users to ada
FREE
Order Ticket, Pannello di trading, Gestione del rischio, Trading manuale, Trailing Stop, Gestione ordini, Esecuzione veloce — JoOrderTrade Pro — pannello di esecuzione per MetaTrader 5 JoOrderTrade Pro è un pannello grafico completo per l'esecuzione manuale degli ordini e la gestione avanzata del rischio in MetaTrader 5. Sostituisce le finestre di trading native della piattaforma con un'interfaccia pulita, reattiva e ottimizzata per le prestazioni, offrendo maggiore precisione e controllo duran
RSI Trend Color
Joas Da Silva Veiga
Candele Colorate RSI , Colorazione RSI Cosa fa RSI Trend Color è un indicatore visivo intelligente che trasforma i valori RSI in colori direttamente sul grafico a candele: Blu : RSI in ipervenduto Arancione : RSI in ipercomprato Bianco : RSI neutrale Funzioni aggiuntive: Avvisi sonori e visivi Avvisi di pullback Impostazioni semplici e personalizzabili Per chi è adatto Trader visivi Principianti RSI Trader esperti Utenti MetaTrader 5 Come usarlo Installare su MetaTrader 5 Visualizzazione autom
FREE
top finder, bottom finder, market structure, price action, trend reversal, trend continuation, support resistance, swing high, swing low, frequency analysis, price projection, breakout detection, pullback trading, swing trading, market turning points EXPERIMENTAL VERSION – UNDER ACTIVE DEVELOPMENT Smart Top Bottom Finder is a market structure and frequency analysis indicator designed to identify potential tops and bottoms based on recurring price movement patterns. The indicator does not rely
FREE
trend,trend gostergesi,momentum,osilator,histogram,trend gucu,piyasa akisi,trend onayi,yukselis,dusus,teknik analiz Il Trend Flow Oscillator è un indicatore di flusso e momentum di mercato progettato per aiutare i trader a identificare la forza e la direzione dei movimenti di prezzo in modo chiaro, semplice e con una lettura visiva rapida. È particolarmente efficace nel timeframe M5, dove i cambiamenti di flusso si verificano più frequentemente. Funzionalità Identifica cambiamenti e continuità
FREE
Simple Panel MT5
Joas Da Silva Veiga
Order Ticket, Trading Panel, Risk Management, Manual Trading, Order Management, Fast Execution,  execution panel for MetaTrader 5 Simple Panel MT5 Simple Panel is a lightweight trading panel for MetaTrader 5 that lets you execute market orders and manage open positions directly from your chart. Designed for simplicity and convenience, the panel provides BUY, SELL, and CLOSE buttons in a compact interface, helping you access essential trading actions without navigating through multiple trading w
FREE
Trend Zone Force
Joas Da Silva Veiga
5 (1)
trend, pullback, indicatore di trend, volatilità, atr, media mobile, ema, momentum, oscillatore, flusso ordini, delta, trading di trend, scalping Questo indicatore è stato sviluppato per l’analisi del trend, l’identificazione dei pullback e la valutazione oggettiva del contesto di mercato. Combina medie mobili e volatilità per creare zone dinamiche e fornire un’interpretazione chiara della direzione del prezzo. L’obiettivo è aiutare il trader a operare in linea con il trend dominante del mercat
indicatore di tendenza, indicatore momentum, indicatore di flusso, bande dinamiche, indicatore MT5, scalping indicatore, day trading indicatore, swing trading, distanza percentuale, no repaint, avvisi tempo reale, multi timeframe, istogramma momentum, EMA tendenza, forza trend TrendBands Momentum Ultra è un indicatore di trend e flusso progettato per aiutare i trader a visualizzare la direzione del mercato, la forza del movimento e la distanza del prezzo rispetto al trend. L’indicatore utilizza
Quantum Pulse Force
Joas Da Silva Veiga
indicatore di tendenza, flusso di mercato, indicatore momentum, price action, indicatore forex, segnali acquisto vendita, inversione trend, volatilità, analisi tecnica, indicatore MT5, scalping, forza del mercato, segnali trading, trading algoritmico, canali di prezzo Quantum Pulse Force è un indicatore tecnico per MetaTrader 5 progettato per misurare l’accelerazione del flusso dei prezzi, identificare canali di accumulazione statistica e generare segnali di convergenza ad alta probabilità. L’i
indicatore mt5, indicatore momentum, indicatore di tendenza, strategia scalping, segnali di acquisto e vendita, analisi tecnica, oscillatore, supporto resistenza, price action, breakout trading, strategia forex, swing trading, riconoscimento pattern, momentum di mercato, segnali di trading Cos’è il MasterForce Pattern Panel Il MasterForce Pattern Panel è uno strumento avanzato per MetaTrader 5 che trasforma i dati grezzi di mercato in segnali operativi basati su pattern di acquisto e vendita.
Market Sentry
Joas Da Silva Veiga
Market Analysis, Market Structure, Price Action, Trend Analysis, Bullish, Bearish, Range Market, Directional Bias, Market Dashboard, Trading Dashboard, Trend Detection, Market Scanner, Market Context, Breakout Analysis, Consolidation Analysis, Trend Filter, Technical Analysis, Real Time Analysis This indicator analyzes price behavior in real time and classifies market conditions into Bullish , Bearish , Range , and Neutral scenarios. Price is continuously evaluated relative to a dynamic referen
FREE
RSI Indicator, RSI Signals, Buy Sell Signals, Trend Indicator, Momentum Indicator, Overbought Oversold, Reversal Indicator, Trading Signals, Forex Indicator, MT5 Indicator, Double Top, Double Bottom, Trend Filter, Technical Analysis, Trading Alerts RSI Zone Memory Reactive – RSI Signals and Market Structure An RSI indicator for identifying momentum shifts, repeated RSI extremes, and potential reversal areas in MetaTrader 5. Overview RSI Zone Memory Reactive is a technical analysis indicator fo
Price Pressure Book
Joas Da Silva Veiga
Time and Sales, Time and Sales Indicator, Tape Reading, Pressure Book, Buy Sell Pressure, Tick Analysis, Market Pressure, Tick Data, Price Movement Analysis, Tick Strength, Momentum Analysis, Buy Sell Movement, Movement Sequences, Real-Time Tick Monitor, Trading Dashboard, Points Analysis, Customizable Alerts, MT5 Indicator Pressure Book - Tick Analysis and Buy/Sell Pressure Indicator for MT5 Pressure Book is a MetaTrader 5 indicator designed to monitor tick-based price movements and display es
Precision Histogram Trend MT5 is a customizable trend histogram indicator for MetaTrader 5, designed to display positive and negative histogram values and visualize changes in momentum direction. Precision Histogram Trend MT5 Precision Histogram Trend MT5 is a customizable histogram indicator for MetaTrader 5 that displays positive and negative values around a central zero line. Its color-coded bars provide a visual representation of changes in histogram direction and magnitude. The indicator
Apex Signal Pro MT5
Joas Da Silva Veiga
reversal, entry, signal, momentum, non-repaint, precision, alerts, filtered-signals Apex Signal Pro Overview Apex Signal Pro is a technical indicator designed to identify potential reversal points on any chart. It combines momentum analysis with multiple confirmation filters to reduce noise and highlight relevant price reversal conditions. The indicator supports different symbols and timeframes. Confirmed signals are displayed as fixed chart markers, while developing conditions can be indicated
Trend and momentum signals with VWAP-based price analysis, clear entry, stop loss and take profit projections, and configurable alerts for scalping and day trading. Trend Pulse Signal Pro Trend Pulse Signal Pro is a technical indicator for MetaTrader 5 that generates buy and sell signals using a multi-factor model. It is designed for traders seeking a structured approach to signal analysis, with projected entry, stop, and target levels displayed directly on the chart. The indicator does not us
Filtro:
Nessuna recensione
Rispondi alla recensione