Multi Standard Error Channel

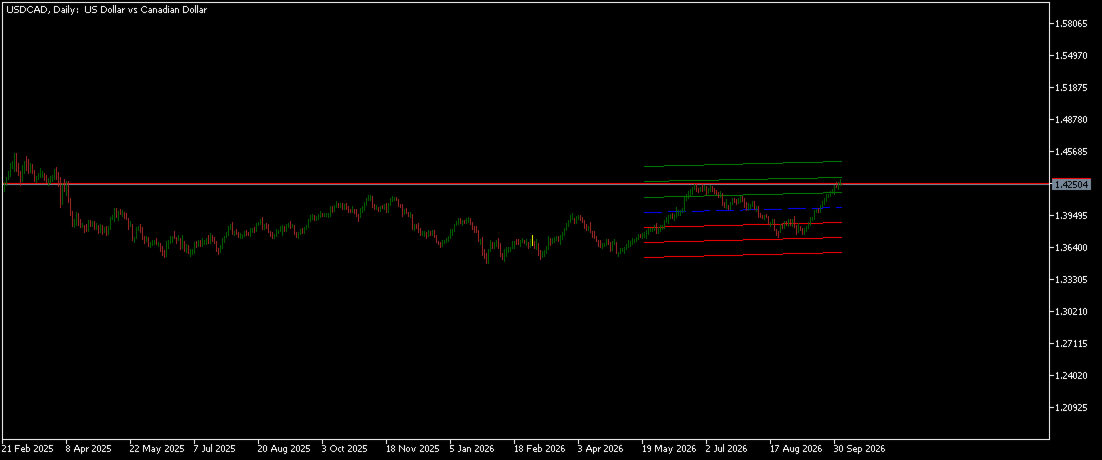
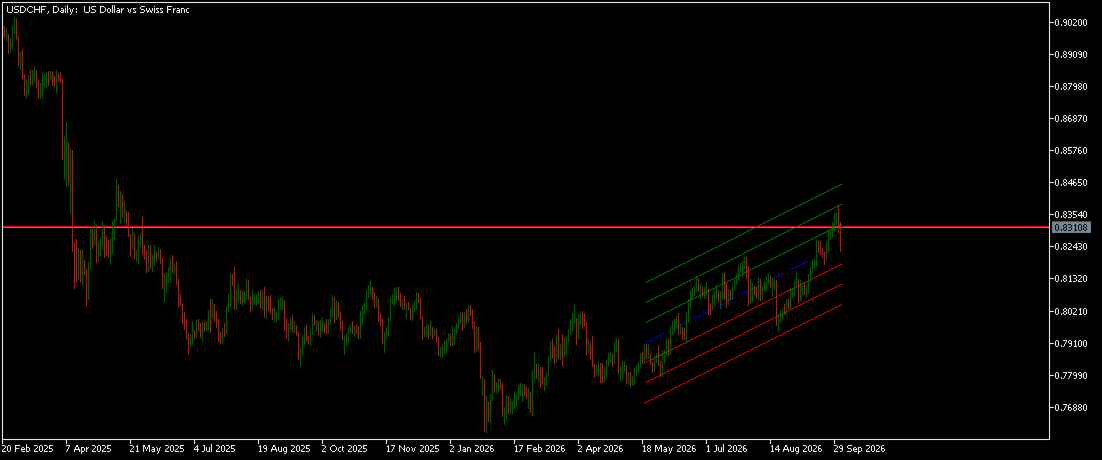
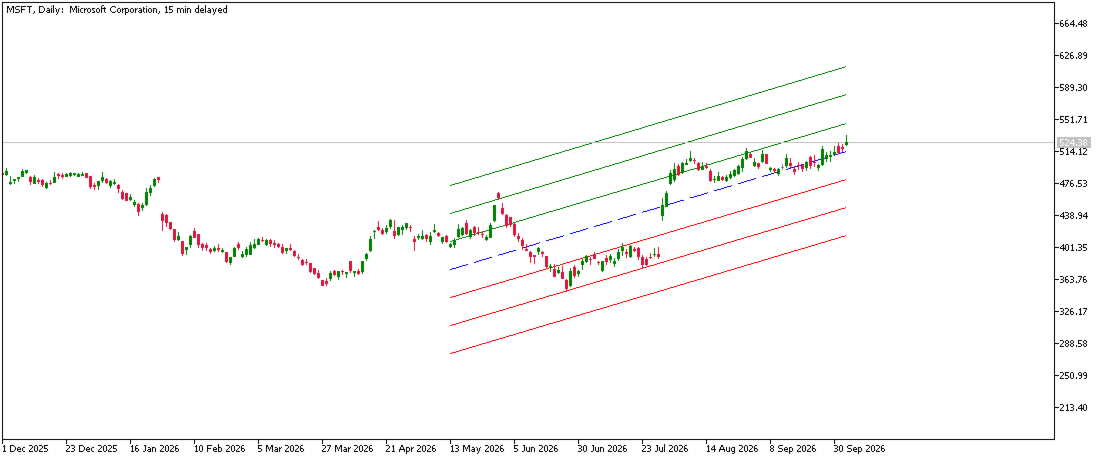
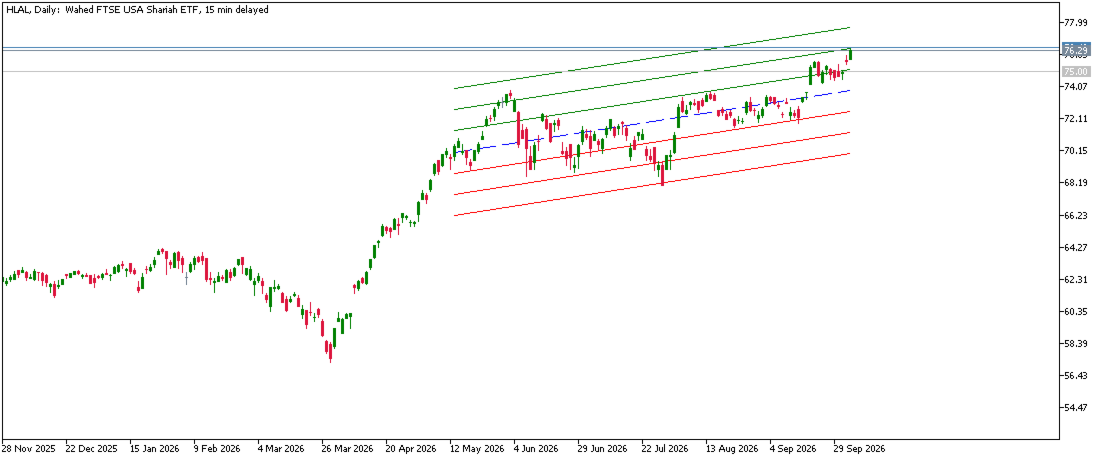
The “Multi Standard Error Channel” indicator was taken directly from the Thinkorswim® indicator of the same name (and translated into MQL5), except that “Multi” was added because it has been enhanced to incorporate three channels into the same indicator, allowing the user to analyze the price chart for different numbers of bars and standard deviations. The “Standard Error Channel” indicator, unlike the “Standard Dev Channel,” uses the average dispersion of prices around the fitted regression line; that is, it does not consider prices directly but instead uses the standard error.

The theory underlying this indicator, as was the case with the simple regression channel, has its origins in statistics and the concept of linear regression; however, unlike prices, here we consider the average dispersion of prices around the fitted regression line. Because of this mathematical principle, it can be observed that, although both consider the same concept of one, two, or three standard deviations, the standard error channel is much narrower than that of the simple deviation; for this reason, prices are more likely to reach the extremes of the channel.

Just as with subjective trend channels, the standard error channel indicates a strong trend when the price breaks out sharply from the channel; and just as with the simple regression channel, the theory underlying this channel assumes that the data are normally distributed—that is, that the data follow a normal probability distribution—which, as has already been noted, is incorrect when studying prices per se.
おすすめのプロダクト
Gold Position Size Calculator (XAUUSD) - a free risk-based lot size calculator built specifically for gold traders. Enter your account balance, risk percentage, entry price and stop-loss price. The calculator instantly shows the correct lot size, risk amount, stop distance, risk/reward ratio and potential profit - so every gold trade risks exactly what you allow, never more. Features: Built for Gold (XAUUSD), works on any forex pair Auto-detects contract size from the symbol specification (no ma
FREE
MA Flow No.2 See the Flow of Bulls & Bears at a Glance, and Keep the Rhythm of the Market in Your Hands Tired of staring at dozens of moving averages until your eyes blur? Unsure when to enter, or where to place your stop? MA Flow No.2 upgrades the humble moving average into a complete trend-trading system. No more scattered lines on your chart — instead, a living "river of bulls and bears". Up to 100 moving averages roll together in real time. On every single bar, you can see at a glance w
This indicators automatically draws the   support and resistances   levels (key levels) for you once you've dropped it on a chart. It reduces the hustle of drawing and redrawing these levels every time you analyse prices on a chart. With it, all you have to do is drop it on a chart, adjust the settings to your liking and let the indicator do the rest. But wait, it gets better; the indicator is absolutely free! For more information:  https://youtu.be/rTxbPOBu3nY For more free stuff visit:  https:
FREE
Trading Sessions by Mahefa R is an indicator for MetaTrader 5 that visually identifies the four main trading sessions: New York, London, Tokyo, and Sydney . Designed to provide a clean, intuitive, and professional market view, it highlights the most active periods of the Forex market using smart visualization of session ranges , session-specific candle colors , and daily separators . Main Features: Automatic detection of the 4 major sessions New York London Tokyo Sydney Each session is fully c
FREE
TrendAGI Indicator: free self-learning trend dots and arrows See the trend the way the TrendAGI Expert Advisor sees it. This free indicator draws the engine’s trend dots and its confirmed buy and sell arrows straight onto your chart. Blue dots under price in an uptrend, orange dots above in a downtrend. Arrows only when a trend flip is confirmed by the confidence score, to filter false starts. Closed bars only: signals never repaint. Alerts and push notifications. Any symbol, any timeframe. Buil
FREE
Market Profile 3 ForexArby com
Hussien Abdeltwab Hussien Ryad
4 (15)
Market Profile 3 MetaTrader 5 indicator  version 4.70— is a classic Market Profile implementation that can show the price density over time, outlining the most important price levels, value area, and control value of a given trading session. This indicator can be attached to timeframes between M1 and D1 and will show the Market Profile for daily, weekly, monthly, or even intraday sessions. Lower timeframes offer higher precision. Higher timeframes are recommended for better visibility. It is als
FREE
Ornstein–Uhlenbeck Z-Score Regime Suite Discover not only the deviation, but whether the movement still has enough strength to continue. Two movements can reach the same Z-Score while representing completely different conditions. One may be ready to return to the mean, while the other may be developing persistence and lasting far longer than expected. The suite applies the Ornstein–Uhlenbeck process to the normalized series, combining three essential dimensions: distance, persistence, and revers
TheRealPrice v3.0 | Ultimate Spread & Ask Visualizer TheRealPrice is a high-precision utility for MetaTrader 5 designed to expose the hidden cost of every trade: The Spread . While standard charts only display the Bid price, professional traders know that buy orders and short-exits happen at the Ask price. TheRealPrice bridges this gap by drawing a dynamic, real-time horizontal line that tracks the exact Ask level, providing a clear visual representation of the current market spread. Why do you
English VWAP Daily (Clean) is a simple and lightweight indicator that plots the classic Daily VWAP (Volume Weighted Average Price) directly on your MT5 chart. Features: Classic Daily VWAP calculation Supports real volume (if available) or tick volume Timezone offset option to match your broker’s server time Weekend merge option (merge Saturday/Sunday data into Friday) Clean version → no arrows, no alerts, only VWAP line VWAP is widely used by institutional traders to identify fair value, su
FREE
移動平均の形ではなく、相場の実際の回転を測る二本の線。Vortex Indicator MTFは上向きと下向きの渦運動を窓の上で合計し、それぞれを真の値幅で割り、できあがった二本の交差からシグナルを取ります。つまり足そのものから測った方向の変化です。中に再帰はまったくないので、どの足からの継続も作りの上で厳密に一致します。無料です。試用期間なし、機能制限なし、上位版への誘導なし。 窓の上で三つの合計を取ります。この足の高値から一本前の安値までの距離、すなわち上向きの渦運動、この足の安値から一本前の高値までの距離、すなわち下向きの渦運動、そして真の値幅です。前の二つをそれぞれ三つ目で割るとVIプラスとVIマイナスが得られます。どちらも一の周りを揺れ、その交差がシグナルです。 この移植版に再帰は一切ありません。二本の線は、入力の高値、安値、終値に対する窓の純粋な関数なので、どの足からの継続も近似ではなく作りの上で厳密に一致します。強度水準は交差を等級1ではなく2にするだけで、渦の強まりと衰えを独立したイベントとして印します。何も除外せず、交差はすべて公開されます。 チャート上の表示 専用ウ
FREE
DRX SPREAD MONITOR は、ブローカーのスプレッドをリアルタイムで可視化・分析するために設計されたプロフェッショナルなユーティリティです。ニュースイベント、ロールオーバー、または流動性の低いセッション中のスプレッド拡大によって引き起こされる隠れたコストを特定するのに役立ちます。 このツールは、約定品質を確保し、取引コストが統計的に高すぎる場合のトレードを回避する必要があるスキャルパーやゴールドトレーダーにとって不可欠です。 主な機能 リアルタイムヒストグラム: 別のウィンドウにスプレッド履歴を表示し、通常、高、極端なレベルを色分けします。 動的移動平均(MA): 平均スプレッドの傾向を計算し、一時的なスパイクと構造的なスプレッドの増加を区別するのに役立ちます。 視覚的「イコライザー」モード: チャートを乱雑にすることなく、市場の流動性状況に関する即時フィードバックを提供する独自のバーチャート表示です。 ライブデータパネル: チャート上のコンパクトなダッシュボードで以下を表示します: 現在のスプレッド 平均スプレッド(時間ベース) 最小/最大記録 音声警告システム: スプレ
FREE
Spread & Swap Monitor — Real-Time Trading Cost & Rollover Fee Tracker for MT5 Never enter a trade blind to broker spreads and overnight financing fees. Spread & Swap Monitor provides an elegant, non-intrusive on-chart HUD that continuously tracks live spread volatility against a rolling average and calculates real swap costs directly converted into your account currency. KEY FEATURES - Real-Time Spread Tracking: Displays live spread in both pips and raw points. - Dynamic Volatility Alert: Spr
FREE
TANIN ICHIMOKU CLOUD (EA20): The Ultimate Trend Rider & Prop Firm Shield Trading the Ichimoku Kinko Hyo system manually can be complex and emotionally draining. Are you tired of getting shaken out of massive trends by market noise? Meet EA20 Tanin Ichimoku Cloud , a fully automated trend-following system. It takes the guesswork out of Ichimoku by executing sniper entries and riding the mega trends with zero emotions. AUTO-LICENSE SYSTEM (NO KEY REQUIRED) This EA is 100% FREE. We have upgrad
FREE
Ichimoku MTF Dashboard reads the full Ichimoku Kinko Hyo system across four timeframes at once and turns it into a single clear state for each of them. Instead of crowding every chart with five overlapping lines, it answers the question that actually matters at a glance. On M15, H1, H4 and D1, is price above, inside or below the cloud, and is the balance tilting bullish or bearish. For each timeframe the panel combines four honest Ichimoku readings. It looks at the position of price relative to
FREE
Nika Session Spread Intelligenceは、市場の開場時刻、閉場までの残り時間、全取引セッションをダークテーマのパネルでチャート上に直接表示する軽量インジケーターです。 一般的なセッションインジケーターとは異なり、このツールはSymbolInfoSessionTradeを通じてブローカーの実際の取引セッションスケジュールを読み取るため、表示時刻はお使いの通貨ペアとサーバーに対して常に正確です - FX、指数、商品、仮想通貨を問わず。 主な機能 - マーケットの開場/閉場ステータス(緑 = 開場、赤 = 閉場) - カウントダウンタイマー - セッション終了または次の開場までの残り時間、500msごとに更新 - ビジュアルプログレスバー - セッションの進行に応じて増加、終了間際にオレンジに変化 - 当日の全セッションリスト(サーバー時間)、アクティブセッションをハイライト表示 - 組み込みアラート - セッション開始/終了のX分前に通知(設定可能、サウンド付き) - パネル上の + / - ボタンでズーム - 完全カスタマイズ可能 - 色、フォント、位置、更新頻
FREE
The Analytical cover trend indicator is a revolutionary trend trading and filtering solution with all the important features of a trend tool built into one tool! The Analytical cover indicator is good for any trader, suitable for any trader for both forex and binary options. You don’t need to configure anything, everything is perfected by time and experience, it works great during a flat and in a trend. The Analytical cover trend indicator is a tool for technical analysis of financial markets
Dairy Desk は、口座で動いている各エキスパートアドバイザー (EA) の本当の成績を表示する軽量なダッシュボードです。取引履歴を読み込み、マジックナンバーごとに取引をまとめ、損益、統計、損益カレンダー、口座情報をチャート上の1つのパネルに集めます。ターミナルの動作を重くすることはありません。 1つの口座、たくさんのEA、ひと目でわかる画面。 概要 種類: ユーティリティ (取引の新規、変更、決済を一切行わないEA) 軽量: パネル全体が1つのチャートオブジェクトで、ティックごとの処理はありません プラットフォーム: MetaTrader 5、ヘッジ口座とネッティング口座に対応 どの銘柄、どの時間足でも動作し、チャートは1つで十分です 手動取引 (magic 0) を含む口座の全履歴を読み込みます 4つの画面: Summary、Details、Calendar、Account DLL不要、追加ファイルのインストール不要、インターネット接続不要 仕組み Dairy Desk は口座の決済済み取引を読み込み、マジックナンバーごとにまとめます。各マジックナンバーは1つの戦略となり、名
Dynamic Supply and Demand indicator automatically identifies and displays Supply and Demand Zones on your chart based on price action patterns and market structure.  These zones represent areas where institutional buying or selling pressure has historically occurred, making them key levels for potential price reactions. This form of indicator takes inspiration from ICT as well as traditional Support & Resistance formation. **For the first 50 candles (number depends on LookBackCandles) when indic
FREE
この情報インジケーターは、アカウントの現在の状況を常に把握したい人にとって役立ちます。 VERSION MT 4 -   More useful indicators このインジケーターには、ポイント、パーセンテージ、通貨での利益、現在のペアのスプレッド、現在の時間枠でバーが閉じるまでの時間などのデータが表示されます。 チャート上に情報線を配置するには、いくつかのオプションがあります。 価格の右側 (価格の後ろにあります)。 コメントとして (グラフの左上隅に); 画面の選択した隅。 情報区切り記号を選択することもできます。 | / \ # このインジケーターは使いやすく、非常に有益です。設定で不要な情報項目を無効にすることも可能です。 設定 外観の種類     - 情報行の表示タイプ。次の 3 つのオプションがあります。 価格に従ってください     - 価格に従う。 コメントとして     - コメントとして; 画面の選択した隅に     - 画面の選択した隅にあります。 添付用グラフコーナー     - 表示タイプを選択した場合 画面の選択されたコーナーでは、この項目を使用して
FREE
押し目がどこで止まりそうかを、先にチャートで確認できます。 FiboZone OTE Map は、マーケットストラクチャーを抜けたインパルス波を見つけ、その0.705〜0.95の戻り(OTEゾーン、最適エントリーゾーン)を最大3つの時間足で同時に描きます。価格がゾーンに入ったとき、そしてゾーン内で下位足が反転を確認したときにお知らせします。 表示する内容 OTEゾーン: ATRの1.5倍以上の大きさでストラクチャーを抜けたインパルスごとに、0.705〜0.95の戻りゾーンをインパルスの終点からチャート右端まで描きます。インパルスが伸び続けている間は、ゾーンもそれに合わせて動きます。 3つの時間足を1チャートに: チャートの時間足を塗りつぶしのゾーンで、上位2つの時間足(初期値はH1とH4)を枠線で表示します。 ターゲット: 0.5の均衡ラインと、インパルス終点より先の2つの拡張ターゲット(初期値は0.618と1.0)。 チェンジ・オブ・キャラクター: 価格が届いたゾーンの中で、下位足(初期値はM5)が直近スイングを終値で抜けると矢印を表示します。 ストラクチャーパネル: H4とD1のマ
FREE
Stochastic   +   RSI   Multi-Timeframe   Dashboard   with   Momentum   Strength Need Trade Assistant? Trade Panel Pro MT 5 Please leave a review, if you like this.   OVERVIEW A   professional   multi-timeframe   dashboard   indicator   that   displays   Stochastic   Oscillator   and   RSI   (Relative   Strength   Index)   values   from   7   different   timeframes   simultaneously   on   a   single   compact   panel.   Perfect   for   scalpers   and   day   traders   who   need   quick   m
FREE
======================================================== GOLD WAVE LEVELS (ELLIOTT-ALIGNED) - MQL5/MT5 MARKET DESCRIPTION (formatting: **bold** = Bold button; lines with • = bullet list; UPPERCASE = heading) ======================================================== OVERVIEW ------------------------------------------------------- **Gold Wave Levels** draws a tested wave backbone for gold and validates signals against **Elliott theory hard-rules**, with higher-timeframe context and per-timeframe
FREE
KCI Candle: Advanced Kinematics Price Action The KCI (Kinematics Computing Index) Candle is a next-generation analytical tool designed to transform raw market data into crystal-clear visual intelligence. By painting the chart's candles based on deep mathematical kinematics, this indicator provides traders with an immediate, unambiguous reading of the current market direction and momentum. Built for professional traders who demand clean charts and pure data, the KCI Candle eliminates second-guess
FREE
Haven Volume Profileは、取引量の分布に基づいて重要な価格レベルを識別するための多機能なボリュームプロファイル分析インジケーターです。市場をより深く理解し、重要なエントリーポイントとエグジットポイントを特定したいプロのトレーダー向けに設計されています。 その他の製品 ->  こちら 主な機能: Point of Control (POC) 計算 - 最大の取引活動が行われるレベルで、最も流動性の高いレベルを特定するのに役立ちます Value Area(高い活動の領域)の定義とカスタマイズ可能な取引量の割合で、取引範囲をより正確に評価できます ティックボリュームと実際の取引量の両方に対応し、さまざまな市場タイプや取引戦略に対応しています 計算期間(日数)の柔軟な設定により、任意の時間枠にツールを適応させることができます ターミナルのライトテーマとダークテーマに自動的に適応し、ユーザーインターフェースの視覚的な体験を向上させます レベルの視覚化が明確で、スタイルや色をカスタマイズでき、グラフ分析と迅速な意思決定を支援します このインジケーターは、重要な価格レベルや統合ゾー
FREE
The indicator detects and displays М. Gartley's Butterfly pattern. The pattern is plotted by the extreme values of the ZigZag indicator (included in the resources, no need to install). After detecting the pattern, the indicator notifies of that by the pop-up window, a mobile notification and an email. The pattern and wave parameters are displayed on the screenshots. The default parameters are used for demonstration purposes only in order to increase the amount of detected patterns. Parameters z
Fibomathe
Almaquio Ferreira De Souza Junior
Fibomathe Indicator: Support and Resistance Tool for MT5 The Fibomathe Indicator is a technical analysis tool designed for MetaTrader 5 (MT5) that assists traders in identifying support and resistance levels, take-profit zones, and additional price projection areas. It is suitable for traders who use structured approaches to analyze price action and manage trades. Key Features Support and Resistance Levels: Allows users to define and adjust support and resistance levels directly on the chart.
FREE
TrendView — Clear Trend Visualization for Confident Trading TrendView is a free trend indicator designed to give traders a clean and reliable view of market direction. It displays clear trendlines in three colors, making it easy to identify bullish, bearish, and neutral phases without cluttering the chart with unnecessary elements. Whether you are monitoring long-term market structure or short-term price action, TrendView helps you keep your focus on the bigger picture. For traders who also w
FREE
ST Daily Pivot Levels MT5 ST Daily Pivot Levels MT5 は、MetaTrader 5 向けの無料インジケーターです。クラシックな日次ピボットポイントを自動計算し、チャート上にわかりやすく表示します。 主な機能: PP、R1、R2、R3、S1、S2、S3 を自動計算。 直近の確定した日足の高値、安値、終値を使用。 ブローカーのサーバー時間に基づき、新しい取引日の開始時に自動更新。 前日のピボットラインを新しい水準に自動置換。 チャート右側にライン名を表示し、価格表示も選択可能。 レジスタンス、サポート、中央ピボットの色を変更可能。 ラインの太さ、スタイル、文字サイズ、ラベル位置を調整可能。 R3 と S3 の表示・非表示を選択可能。 MetaTrader 5 のさまざまな銘柄と時間足で使用可能。 インストール方法: 日足データが利用可能な MT5 チャートにインジケーターを追加してください。ピボットラインが自動的に表示されます。表示設定はパラメーターから変更できます。 リスクに関する注意事項: 本インジケーターはテクニカル分析専用です。自動
FREE
FlowDelta Profile FlowDelta Profile is a volume-based chart analysis indicator. It divides the selected price range into rows and estimates how activity is distributed across those levels. The left side shows the Delta Profile: an estimate of buying versus selling pressure at each price row. The right side shows the aggregated Money Flow Profile, with wider bars indicating rows with more activity. When enabled, a normalized heat map appears alongside it to make row-by-row comparisons easier. How
FREE
The Big Swinger Its Free For Only 7 Days After That You Will Have To Pay 50 to 100$ (You Have Only 7 Days) Overview The Big Swinger is a technical trading indicator designed to help traders identify potential buying and selling opportunities through clearly displayed chart signals. It evaluates predefined market conditions and highlights potential trade setups directly on the chart, helping traders observe possible market turning points without manually monitoring every price movement. Key Fea
このプロダクトを購入した人は以下も購入しています
Trend Sniper X
Sarvarbek Abduvoxobov
4.87 (46)
Trend Sniper X は、トレードの方向性と潜在的な反転ポイントを明確かつ正確に特定するのに役立つ、MetaTrader 5 用のマルチタイムフレーム・トレンドフォロー指標です。 MT4用: https://www.mql5.com/en/market/product/193245 価格情報: 現在の価格はプロモーション価格であり、今後のアップデートや新機能のリリースに伴い変更される場合があります。 ボーナス特典: このインジケーター用の無料自動売買アシスタントEAを入手するには、購入後に an 著者(開発者)へメッセージをお送りください。 Code2Profit チャンネル マルチタイムフレーム分析で相場をマスターしよう! Trend Sniper X で勝率を最大化する方法:重要なルールとセッションのコツ 技術仕様 プラットフォーム MetaTrader 5 インジケータータイプ マルチタイムフレーム・トレンドインジケーター 操作タイムフレーム あらゆるチャートタイムフレームに対応。個別に選択可能な上位タイムフレーム (M1–MN1) を搭載 主要銘柄 FX、ゴールド (X
Smart Trend Trading System — MetaTrader 5 ご購入後、MQL5で私にメッセージをお送りいただくと、Smart Universal Expert Advisorを無料で受け取れるほか、オンライン講座、PDFマニュアル、非公開グループへのアクセスもご利用いただけます。 STTSは、トレンドの方向、エントリー・決済シグナル、反転ゾーン、重要な価格水準をチャート上にまとめて表示します。システムを参考に手動で取引することも、別の対応EAを接続し、ご自身で選んだ設定に基づいて自動売買することもできます。 ひとつのシステム、4つのトレードアプローチ STTSのトレードアプローチは、大きく4つのカテゴリーに分かれています。 • スキャルピング — 短期的なシグナルや相場の動きを捉えます。 • トレンドトレード — 方向性を評価し、トレンド内の機会を探します。 • 反転トレード — 反転の可能性があるゾーンや方向の変化を見つけます。 • 出来高トレード — 出来高に基づく情報を使い、市場の活発さを評価します。 エントリー・決済の矢印、トレンド情報、サポート・
新たな王者が登場 - インジケーター + 注文管理表示(TP1 + TP2 + TP3)+ オプションのTelegramシグナル送信機能付き(無料) (完全なトレード&シグナルシステム) ゴールド向け最高のEA: Gold Slayer このインジケーターには、高度な戦略、カスタマイズ可能な注文管理システム、そしてエンベロープ拡張を組み合わせた平均回帰システムが搭載されています。さらに、RSIなど複数のインテリジェントな確認フィルターによって、高確率の反転エントリーをBUY・SELLシグナルとして検出します。 単にトレードを学ぶだけでなく、複数ポジションを効果的に管理し、過去に利益を出しているオープンポジションで損失トレードをカバーする方法も学べます。 M5向けに構築・最適化されており、流動性が高くシグナルの精度が安定しているBTCUSDとXAUUSDで優れたパフォーマンスを発揮します。 このインジケーターは、ATRを基に自動計算されたエントリー、ストップロス、テイクプロフィットレベルを備えた明確なLong・Shortシグナルを提供するため、リスク管理が最初から組み込まれています。 マ
SuperScalp Pro
Van Minh Nguyen
4.5 (38)
SuperScalp Pro - Professional Multi-Layer Confluence Scalping System SuperScalp Proは、複数の高度な確認フィルターを追加することで、従来のSupertrendを強化したスキャルピング向けインジケーターです。誤ったシグナルを大幅に減らしながら、成功する可能性がより高いBuy/Sellの取引機会を見つけるのに役立ちます。 BuyとSellの矢印がチャート上に明確に表示され、ATRに基づくStop LossとTake Profitのレベルもリアルタイムで自動計算されます。 ご購入後、MQL5で私にメッセージを送っていただくと、SuperScalp Pro Auto Trader EAを無料で受け取れるほか、ユーザーガイドとプライベートグループへのアクセスもご利用いただけます。 XAUUSD M1の高頻度スキャルピング実取引結果: [Live Trading] 推奨設定ファイルをダウンロード: [Set File] 詳細なドキュメントは製品ブログでご覧いただけます: [User Guide] 最新情報を受け
Entry Points Proは、注文を出す前に、どこでエントリーし、どこにストップを置き、どのロットで取引するかを示します。 価格 現在 199 USD、この価格での販売は 4 本です。その後は 249 USD、最終価格は 349 USD です。 私は相場のトレードで収入を得ており、それを公開しています。だから、このインジケーターを誰にでも売る必要はありません。自分の頭で考えるトレーダーのためのツールであり、魔法のボタンではありません。 ブレイクがなければ取引もありません。グレーの矢印はキャンセルされたシグナルです。価格がシグナル足をブレイクしなかったため、エントリーも損失もありません。 矢印はローソク足の確定時に表示され、リペイントしません。設定は2つ:あなたの資金と1回のトレードあたりのリスクです。 お支払い前にご確認ください:無料デモはMT5のストラテジーテスターで動作し、2分で済みます。ご購入後は、私が個人的に設定をお手伝いします。 2019年、私はこのインジケーターの実力を世界中に示しました。そのシグナルに従って手動で、リアル口座で、公開の場でトレードしたのです。口座は
Zoryk Gold
Reda El Koutbane
4.68 (22)
割引は 24 時間後に終了します — 次の価格は$ 69 ZORYK — MetaTrader 5専用 XAUUSDシグナル・トレードプランニングシステム このような経験はありませんか。 ゴールドを分析し、エントリーを待ち、ようやくポジションを持った直後に価格が逆方向へ動く。 早すぎる決済をしてしまったり、Stop Lossを動かしたり、数秒迷っている間にチャンスを逃したりする。 その後、相場は自分が最初に予想していた方向へ進み、目標へ到達する。 問題は常に方向判断ではありません。 本当の問題は、明確な計画がなかったことです。 どこでエントリーすべきか。 どこでトレードの前提が無効になるのか。 近い利益を確保すべきか、より大きな値動きを待つべきか。 現在のsetupが本当に強いのか、それとも無理にトレードを探しているだけなのか。 ゴールドは非常に速く動きます。 正しい分析でも、明確なプランがなければ数秒で悪い判断に変わることがあります。 ZORYKは、その問題を解決するために開発されました。 ZORYKとは ZORYKは、MetaTrader 5とXAU
Gann Made Easy   は、ミスター・ギャンの理論を使用した取引の最良の原則に基づいた、プロフェッショナルで使いやすい外国為替取引システムです。 W・D・ガン。このインジケーターは、ストップロスとテイクプロフィットレベルを含む正確な買いと売りのシグナルを提供します。 PUSH通知を利用して外出先でも取引可能です。 ご購入後、取引方法の説明と優れた追加インジケーターを無料で入手するには、私にご連絡ください! おそらく、ギャンの取引手法についてはすでに何度も聞いたことがあるでしょう。通常、ギャンの理論は初心者のトレーダーだけでなく、すでにある程度の取引経験がある人にとっても非常に複雑なものです。なぜなら、ギャンの取引手法は理論的にはそれほど簡単に適用できるものではないからです。私はその知識を磨き、最良の原則を私の外国為替インジケーターに組み込むために数年を費やしました。 このインジケーターは非常に簡単に適用できます。必要なのは、それをチャートに添付し、簡単な取引推奨事項に従うだけです。このインジケーターは常に市場分析の仕事を行い、取引の機会を探します。適切なエントリーポイントを検
あなたのトレード優位性を視界に入れよう! M5 Sniper は MeanFX による新しいインジケーターです。 正確なトレードシグナル と 適応型TP/SLレベル を組み合わせることで、結果として可能な限り最高の統計的トレードを実現します! 5回購入されるごとに価格が上昇し、次の価格は69$です 購入後に私にメッセージを送っていただければ、ヒント/ガイドとボーナスEAをお受け取りいただけます 何が他と違うのでしょうか? Gold XAUUSDにおける 実証済みの統計的パフォーマンス ( ほぼすべてのアセットで機能します 。一貫した結果が得られないまま何でも扱おうとするのではなく、1つの時間足をマスターすることに重点を置いています) 1日あたり1~8回のトレード を各シンボルで実行し、高い勝率と、すべての統計的優位性をこちら側に持つことができます チャート上には 確認済みの BUYおよびSELLシグナルのみを表示 適応型TPおよびSLレベル を各トレードごとにインジケーターが生成 平均Winrate 75%+ 平均 Signal Ratio 最低1.1+ アラーム と通知を 携帯電話
SMC Intraday Formula
VividMind Digital Solutions
5 (26)
まず正直に言いましょう。 どんなインジケーターも、それ単体であなたを利益化させることはできません。もしそう言う人がいるなら、それは夢を売っているだけです。完璧な売買シグナル(矢印)を表示するインジケーターは、いくらでも“完璧に見せる”ことができます。正しい過去の区間を拡大して、勝ちトレードだけを切り取ればいいだけです。私たちはそれをしません。 SMC Intraday Formula はツールです。 市場構造を読み取り、最も高い確率の価格ゾーンを特定し、今この瞬間のスマートマネーの痕跡をシンプルな言葉で正確に示します。最終判断はあなたが行います。トレードを実行するのもあなたです。しかし今は「希望」ではなく「精度」でエントリーできます。 私たちはこのインジケーターを、ゴールド(XAUUSD)および主要FX通貨ペアで約3年間、日々のスキャルピングに使用してきました。M1、M5、M15、M30の主要ツールです。これは未来を予測しようとするのではなく、今まさに形成されている高確率セットアップを示し、その理由を説明します。 他のすべてのインジケーターと何が違うのか? ほとんどのトレーディングイ
ULTRAは、「オールインワン」方式で機能するテクニカル指標です。市場を独自に分析し、売買シグナルを生成し、ストップロス注文を設定するための水準を表示し、利益を確定したり損失を最小限に抑えたりするためにポジションを決済すべきタイミングを提案します。 つまり、市場の分析方法や、水準(ストップロスをどこに設定すべきか)の見極め方がわからなくても、あるいは資金管理に苦労していても問題ありません。ULTRAがすべて代行してくれます! 購入者限定特典 :「ULTRA」インジケーターをご購入後、私にプライベートメッセージをお送りいただければ、「ULTRA BOT」を無料プレゼントとしてお受け取りいただけます。これは、このインジケーターからのシグナルに基づいて、オープンしたトレードを管理するのに役立つ特別なツールです(各トレードにストップロスを設定し、最適な結果が得られるよう、戦略のルールに従って自動的にトレードを決済します)。  また、インジケーターを最大限に活用できるよう、さまざまな資産向けの既成の設定も購入者の皆様に提供しています。これらの「超お得な特典」を無料で入手するには、私へダイレクトメ
GoldenX Entry MT5
VividMind Digital Solutions
5 (17)
GoldenX Entryは、MT5向けのインジケーターであり、適応型Smart Entry Trendアルゴリズム、シグナルスコアリングシステム、マーケットレジーム検出機能、およびボラティリティフィルターを備えています。各シグナルには、計算されたエントリーレベル、3つのテイクプロフィット(TP1、TP2、TP3)、およびストップロスレベルが含まれます。本インジケーターは、異なる市場環境に適応するために設計された複数の分析レイヤー上に構築されており、マルチレイヤー分析システムと内蔵オプティマイザーおよび統計トラッキングシステムを組み合わせています。リスク・リワード(RR)指標および過去のトレード履歴に基づく定量分析を提供します。 使い始めは簡単です — 選択した時間足でオプティマイザーを実行し、そのままチャート上でインジケーターを使用します。 コア機能 GoldenX Entryは、シグナルエンジンとトレード管理機能、そして過去統計トラッキングを1つのチャートに統合しています: - 内蔵オプティマイザー: オプティマイザーはチャート上でワンクリックで実行できます。200通りのパラメー
通貨強さウィザードは、取引を成功させるためのオールインワン ソリューションを提供する非常に強力な指標です。このインジケーターは、複数の時間枠のすべての通貨のデータを使用して、このまたはその外国為替ペアのパワーを計算します。このデータは、使いやすい通貨インデックスと通貨パワーラインの形式で表され、特定の通貨のパワーを確認するために使用できます。 必要なのは、取引したいチャートにインジケーターを接続することだけです。インジケーターは、取引する通貨の実際の強さを示します。このインジケーターは、トレンドに合わせて取引するときに有利に利用できる売買高の圧力の極値も示します。このインジケーターには、フィボナッチに基づく可能なターゲットも表示されます。 このインジケーターは、PUSH 通知を含むあらゆるタイプのアラートを提供します。 購入後ご連絡下さい。私の取引のヒントをあなたと共有し、素晴らしいボーナスインジケーターを無料で提供します! 幸せで有益な取引をお祈りします。
Auto Optimized SpeedAngle は、継続的なウォークフォワード最適化(WFO:Walk-Forward Optimization)によりカーブフィッティング(過剰最適化)を排除した、機関投資家レベルのモメンタムベクトルシステムです。市場レジームの変化時に効果が低下する静的な入力に依存せず、アウトオブサンプル(OOS)検証を用いてパラメーターを動的に再キャリブレーションすることで、表示されるシグナルが単なる過去の偶然ではなく、確実な統計的優位性に基づいていることを保証します。 主な機関投資家向けフレームワーク ウォークフォワード最適化エンジン: ルックバック期間やしきい値の数千に及ぶ組み合わせを継続的にスキャンし、データをインサンプルとアウトオブサンプルに厳格に分離します。未検証のデータ環境において数学的優位性が証明された場合にのみ、新しいパラメーター設定を採用します。 定量的目的関数: 単なる純利益の追求ではなく、機関投資家レベルの安定性指標をターゲットとします。システム品質ナンバー(SQN)、期待値(1トレードあたりの平均Rマルチプル)、またはネットRの最適化を選
Atomic Analyst — MetaTrader 5 ご購入後、MQL5で私にメッセージをお送りいただくと、Smart Universal Expert Advisorを無料で受け取れるほか、オンライン講座、PDFマニュアル、非公開グループへのアクセスもご利用いただけます。 Atomic Analystは、プライスアクション、トレンドの方向、エントリー・決済シグナル、損切り水準、複数の利確水準をチャート上にまとめて表示します。 シグナルを確認し、取引の状況を理解する Atomic Analystは、分析結果をわかりやすい視覚情報として表示します。 • エントリーの候補を見つけるための買い・売りの矢印。 • 取引計画に役立つ損切り水準と複数の利確水準。 • 市場の方向性を評価するトレンド、強さ、モメンタムの指標。 • より広い市場背景を比較する複数時間足の分析。 • 変化する状況を追うための色分けされたローソク足とアラート。 シグナルと補助分析を併せて確認し、その取引機会がご自身のルールに合うかを判断してください。 短期の取引機会から、より大きな値動きまで Atomic A
Gold Trend Coach MT5
Cristhian Alexander Gaibor Cuasquer
4.27 (11)
MetaTrader 5 向け、ゴールド(XAUUSD)のリペイントしない売買シグナル。すべてのシグナルに損切りラインと3つの利確ラインが付きます。BOS と CHoCH を使った Smart Money Concepts フィルターで、相場の構造に逆らわず、構造に沿ってトレードできます。パネル上のライブ・メンターが、エントリーから TP3 まで一歩ずつナビゲート。アラートはスマホとあなた自身の Telegram チャンネルに直接届きます。それが Gold Trend Coach。もう一人でトレードすることはありません。 ご購入特典・無料の購入者キット: 1. Telegram Alert Bridge: シグナルをあなた自身の Telegram チャンネルへ。チャートのスクリーンショットと日次レポート付き。 2. ユーザーマニュアルと設定ガイド。 受け取り方: キットはダウンロードファイルには含まれていません。購入後に MQL5 のメッセージでご連絡ください。当日中にお送りします。 $39 と $45 のローンチ価格分は完売しました。現在は次の10本まで $59、その後は $79
マルチ通貨強度・モメンタム・インジケーター MT5 Dynamic Forex28 Navigator は、長年ご愛用いただいている人気インジケーターの進化形であり、5つの力を1つにまとめたものです。 Advanced Currency Strength28 Indicator (700件のレビュー) Advanced Currency IMPULSE with ALERT (530件のレビュー) Currency Strength EXOTICS GOLD Impulse with Alert CS28 Combo Signals (最近のボーナス) 4つのインジケーターを購入してチャートに重ねる必要はありません。すべてが1つの強力なインジケーターに統合されています。28通貨ペアの強度、それらを導く市場のモメンタム、そして両方のアラートを、1つのウィンドウ、1つのチャートで。 上記のプログラムは MQL5 Market で1,200件以上のレビューを獲得し、2016年から MT4 コミュニティで定番となっています。Dynamic Forex28 Navigator MT5 は、実証済
M1 SNIPER は使いやすいトレーディングインジケーターシステムです。M1時間足向けに設計された矢印インジケーターです。M1時間足でのスキャルピングのためのスタンドアロンシステムとして、また既存のトレーディングシステムの一部としても使用できます。このトレーディングシステムはM1時間足での取引に特化して設計されていますが、他の時間足でも使用できます。元々、この手法はXAUUSDとBTCUSDの取引用に設計しましたが、他の市場においても役立つと考えています。 インジケーターのシグナルは、トレンドの方向と逆方向に取引できます。インジケーターのシグナルを利用して両方向に取引するのに役立つ特別な取引テクニックをご紹介します。この手法は、特別な動的なサポートとレジスタンスの価格帯を利用することに基づいています。 ご購入後、M1 SNIPER矢印インジケーターをすぐにダウンロードできます。さらに、M1 SNIPERツールのすべてのユーザーに、以下のスクリーンショットに表示されているApollo Dynamic SRインジケーターを無料で提供しています。この2つのインジケーターを組み合わせることで
次回アップデート — バージョン 2.52 近日公開!【新機能】 市場分析とトレードワークフローを強化する、4つの主要な新機能にご期待ください 皆様のトレードニーズに応える4つの新機能により、市場分析を次のレベルへと引き上げます。新機能をご紹介します: 1. TRADE OVERVIEW DASHBOARD 2. CONFLUENCE AT ZONE 3. STRONG & WEAK HIGH/LOW 4. OTE 1. TRADE OVERVIEW DASHBOARD 市場全体の状況をより簡単に把握できるダッシュボードです。トレード判断をサポートするガイダンスを提供し、市場分析とトレード計画を体系的に行えるよう支援します。すべてを1つの画面で確認できます。 マルチタイムフレーム市場概要(Multi-Timeframe Market Overview) 市場の方向性と価格構造をより明確に把握 市場状況をすばやく確認 体系的な市場分析とエントリー計画のためのガイダンス 2. CONFLUENCE AT ZONE 価格が重要なゾーンに入るとき…いくつのサポート要因が一致しているかを確認で
Unix Scalper — MetaTrader 5 ご購入後、MQL5で私にメッセージをお送りいただくと、Smart Universal Expert Advisorを無料で受け取れるほか、オンライン講座、PDFマニュアル、非公開グループへのアクセスもご利用いただけます。 セットアップを見つけ、取引プランを確認し、取引方法を選ぶ。 UNIX Scalperは、市場分析、BUY/SELL/WAITの判断、Entry、Stop Loss、TP1、TP2の水準を、見やすいパネルにまとめています。 シグナルと取引プランを確認 • 明確な判断:BUY、SELL、WAIT。 • 明示された水準:Entry、Stop Loss、TP1、TP2。 • 複数時間足の一覧:パネル上で各時間足のシグナルを比較。 • 判断を支える分析:トレンド、モメンタム、出来高、ボラティリティ、サポートとレジスタンス、市場の質。 • 選べるレイアウト:Minimized、Compact、Standard、Full。 シグナルと各水準を確認し、そのセットアップがご自身の取引ルールに合うか判断してください。 ゴール
Smc Pro ToolKit
Talal N Z Aljarusha
5 (13)
SMC PRO TOOLKIT — SMART MONEY ANALYSIS & STRUCTURED TRADE PLANNING SMC Pro ToolKit is a professional Smart Money Concepts analysis workspace for MetaTrader 5. It combines market structure, multi-timeframe analysis, institutional price zones, setup evaluation, confirmation tools, volume context, alerts, and risk planning inside one organized chart environment. One workspace. Multiple layers of confirmation. One structured trading plan. OPEN COMPLETE USER GUIDE MULTI-CONDITION SETUP ENGINE At
FX Power: 通貨の強弱を分析して、より賢い取引を実現 概要 FX Power は主要通貨と金の実際の強弱をあらゆる市場状況で理解するための必須ツールです。強い通貨を買い、弱い通貨を売ることで、 FX Power は取引の意思決定を簡素化し、高い確率の取引機会を見出します。トレンドを追従する場合でも、極端なデルタ値を使用して反転を予測する場合でも、このツールはあなたの取引スタイルに完全に適応します。ただ取引するだけではなく、 FX Power で賢く取引をしましょう。 1. なぜ FX Power がトレーダーにとって非常に有益なのか 通貨と金のリアルタイム強弱分析 • FX Power は主要通貨と金の相対的な強弱を計算し、マーケットダイナミクスに関する明確な洞察を提供します。 • どの資産がリードしているか、または後れを取っているかを監視して、取引するペアを賢く選びましょう。 マルチタイムフレームの包括的なビュー • 短期、中期、長期のタイムフレームで通貨と金の強弱を追跡し、マーケットトレンドに基づいて取引戦略を調整できます。 • スキャルピングからスイングトレード
Azimuth Pro
Ottaviano De Cicco
5 (7)
Azimuth Pro V2:MT5向けシンセティック・フラクタル構造分析と確認済みエントリー 概要 Azimuth Pro は Merkava Labs によるマルチレベルスイング構造インジケーターです。4つのネストされたスイングレイヤー、スイングアンカーVWAP、ABCパターン検出、3タイムフレーム構造フィルタリング、そして確定バーでの確認済みエントリー — 1つのチャートで、ミクロスイングからマクロサイクルまでを網羅するワークフロー。 これはブラインドシグナル製品ではありません。ロケーション、コンテキスト、タイミングを重視するトレーダーのための構造ファーストワークフローです。 1. V2での変更点 シンセティック・マルチタイムフレームエンジン 上位タイムフレーム分析をMeridian Proと同じ独自のシンセティックアーキテクチャで一から再構築。よりクリーンなHTFコンテキスト、安定したライブ動作、従来のMTF同期問題なし。シンセティックエンジンは 固定比率タイムフレームカスケード (x2、x3、x4、x6)も可能にします — ブローカーのタイムフレーム間の任意なジャンプの代
Boba Analysis Suite
Trade Ready Solutions LLC
5 (2)
Boba Analysis Suite Boba Analysis Suite は、MetaTrader 5 向けの分析インジケーターです。市場構造、重要な価格帯、相場全体の状況を、一つのチャート画面にまとめて表示します。 トレーダーおよびトレーディング指導者としての実務経験をもとに開発され、市場の方向性の評価、重要な価格水準の特定、複数の時間足を組み合わせた分析など、体系的な分析プロセスを支援します。 相場の背景を踏まえた分析 個々のシグナルの意味は、相場の状況によって変わります。Boba Analysis Suite は、現在のチャート状況をより大きな市場構造と関連付け、あらかじめ定めたルールに沿って取引アイデアを検討するための分析を支援します。 主な分析機能: トレンドと市場構造: 市場の方向性と、その背景にある構造を評価します。 重要な価格帯と価格水準: さらに分析すべき重要な領域を視覚的に表示します。 複数の時間足: 異なる時間足の情報を組み合わせ、相場全体の状況を評価します。 視覚的な分析プロセス: 分析情報をチャート上で直接確認できます。 自主的な取引判断を支援 Boba
Gold Sniper Scalper Pro は、XAUUSD における ダマシブレイクアウト(false breakout)パターンの検出に特化した MetaTrader 5 用インジケーターです。価格がレンジの境界を突破してブレイクアウトトレーダーを誘い込み、その後反転してレンジ内に戻る4本バーのトラップ構造を識別します。インジケーターは各セットアップを17の品質要素で採点し、4層コンフルエンスパイプラインで評価し、7タイムフレームトレンドコンセンサスエンジンで検証し、ゴールドボラティリティレジーム分類器でフィルタリングします。すべてシグナルがチャートに表示される前に完了します。 詳細なユーザーガイドは、著者の   MQL5 ブログ   で入手できます。追加の更新は、著者の   MQL5 チャンネル   を通じて入手可能です。 現在のサポートポリシーに基づき、購入者は著者が開発した選定コンパニオンツールへの追加アクセスを受けることができます。 Forex通貨ペア、インデックス、暗号資産でも動作しますが、検出パラメーター、ボラティリティ処理、フィルターロジックはXAUUSD
Naked Forex Tweezer Pro Indicator Tweezer Pro Indicator is a pattern recognition indicator for Forex, Stocks, Indices, Futures, Commodities and Cryptos. The standard Tweezer is a two bar pattern. Our enhanced version is a multi-bar pattern. We filter the patterns for you so that you only get the     best and most effective patterns   and ignore the noise. The Tweezer pattern is a simple and effective pattern to trade. The strategy that comes with the Tweezer is based on price action. The Twe
Power Candles V3 - 自己最適化型強弱インジケーター Power Candles V3は 、通貨や銘柄の強さを、適用されたすべてのチャート上で実行可能なトレードプランに変換します。単にローソク足を色分けするだけでなく、バックグラウンドでリアルタイムの自動最適化を実行し、目の前の銘柄に対して最適なストップロス、テイクプロフィット、およびシグナルの閾値を提示します。ワンクリックで実取引に適用でき、エントリーポイント、ストップロス、テイクプロフィットのラインが正確な価格位置にチャート上に表示され、方向性を示すアラートがリアルタイムで発動します。 このツールは、Stein Investmentsのエコシステムの一部です。  18種類以上のツールをすべて閲覧し、AIを活用したセットアップの推奨事項を入手し、  https://stein.investments でコミュニティに参加しましょう クローズしたバーごとに3,000回以上のトレードシミュレーション。9つの強さの状態。2つの戦略を並行してテスト。勝率の高い設定をワンクリックで適用。 なぜこれが必要なのか ほとんどの強
Gold Entry Sniper – ゴールドスキャルピング&スイングトレード用プロフェッショナル多時間足ATRダッシュボード Gold Entry Sniper は、XAUUSDや他の銘柄向けに正確な 売買シグナル を提供する、MetaTrader 5用の高度なインジケーターです。 ATRトレーリングストップロジック と 多時間足分析ダッシュボード を搭載し、スキャルピングからスイングトレードまで対応します。 主な特徴と利点 多時間足シグナル分析 – M1、M5、M15 のトレンドを同時表示。 ATRベースのトレーリングストップ – ボラティリティに応じて動的に調整。 プロ仕様のチャートダッシュボード – シグナル状況、ATRレベル、回帰線、売買方向を表示。 明確な売買マーカー – 自動矢印とテキストラベル。 エグジットアラートとトレード管理 – 利益確定のための自動検出。 完全カスタマイズ可能 – パネル位置、色、フォント、ATR/回帰設定を調整可能。 ゴールド(XAUUSD)に最適化 – M1〜M15のスキャルピングに最適、FXや指数、暗号資産にも対応。 Gold Entry
RM Control Deck puts a compact bar ("slot bar") and a panel on your chart so you manage all your indicators without digging through menus: toggle them on/off with one click, set their colors, periods and style from a built-in panel with the native MT5 color picker, group them into categories and reorder them by dragging. You can save "scenarios" — full sets of indicators, even across multiple charts — and recall them in one click whenever you need. This is the Pro edition, with no limits and e
Fx Levels Premium Indicator Support and Resistance are important concepts in trading. Fx Levels Premium was created to easily draw important levels of support and resistance for the active trader. The indicator will give you all important levels (support/resistance) to watch for a wide range of assets. Trading without these levels on your chart is like driving a car for a long journey without a roadmap. You would be confused and blind. Support and resistance levels should be used as guideline
FiboSniper Pro
Van Minh Nguyen
4.6 (5)
FiboSniper Pro – Multi-Filter Fibonacci System with Auto SL/TP and Control Panel FiboSniper Proは、動的なFibonacci Envelopesと複数の確認フィルターを組み合わせ、選別されたBuyおよびSellシグナルを生成するテクニカルインジケーターです。FibonacciレベルはMoving AverageとATRを基に計算され、その後ADX、EMA、RSI、ATR、Volume、Time、Candle構造によってフィルタリングされます。インジケーターは、ATRに基づく自動Stop LossおよびTake Profitレベルをチャート上に直接表示し、さらに迅速な調整が可能なインタラクティブControl Panelを提供します。 ご購入後、MQL5で私にメッセージを送っていただくと、Auto Trader Xを無料で受け取れるほか、このインジケーターの取引シグナルを自動化する方法についての説明もご利用いただけます。 User GuideとSet Files: [Click here] 完全
作者のその他のプロダクト
The “Kalman Filter Color” indicator was faithfully designed based on the official Python library called pykalman, which in turn was based on the original Kalman filter created by Rudolf Kalman in 1960. The traditional Kalman filter is based on an algorithm that has a wide variety of applications in physics and engineering. It involves the control and prediction of states (prices) based on self-adjusting mechanisms and in the presence of noise. In this case, pykalman has been adapted and optimiz
FREE
The “Displaced Moving Averages Suite” indicator is not part of the standard technical analysis library; rather, it was adapted from the “Hull Suite” indicator, published for free by InSilico in the TradingView community library. The system is based on the principle of shifting the moving average line selected by the user backward relative to that same moving average, but at the present time. It is at the crossover of these two moving averages that a bullish or bearish signal is generated. Addi
FREE
The  « Multi-Standard Dev Channel»  indicator is based on the statistical concept of linear regression, with Gilbert Raff being the first to implement it as a technical analysis indicator. Basically, it is one of many ways of making future projections based on known past and current data; it also requires that the variables be linearly related, i.e., that changes in the variables remain stable, resulting in a straight line on the plane, hence the term «linear». Advanced users may rightly note th
FREE
This indicator was named “Multiple Moving Averages” because it can plot up to 10 different moving averages on the same chart, assigning each a color that creates a blurred effect, which significantly improves its visual appeal and ease of interpretation. The only limitation is the number of available moving averages of different types. In the case of ThinkScript, the documentation states that there are five different types of moving averages: simple, exponential, weighted, Wilder’s moving averag
FREE
The “Color Filled MACD” indicator is based on the classic Moving Average Convergence Divergence indicator created by Gerald Appel (in the 1970s) and later improved by Thomas Aspray (in the 1980s), in this case for MQL5. It is part of the standard technical analysis library. In this case, the native MQL5 code was used as a basis, and customizable colors were added so that users can choose them for the histogram, the moving averages, and the spaces between them. The goal is to make the indicator
FREE
This indicator, called the “Moving Average Crossover Suite,” is the classic moving average crossover indicator. It takes into account all types of moving averages available in MQL5. As is well known, this indicator—whether it involves two or three moving averages, of the same or different types—has been extensively discussed in the relevant literature, particularly in *Technical Analysis of the Financial Markets* and *The Visual Investor*, both by John Murphy. First, it should be noted that the
FREE
The Cybernetic Cycle Oscillator for MetaTrader 5 is an indicator designed to reduce the lag inherent in traditional indicators. This MT5 version is a direct adaptation of the classic CyberCyclesOscillator found on the Thinkorswim platform, whose mathematical logic is based on John Ehlers' developments presented in his book Cybernetic Analysis for Stocks and Futures . Mathematical Foundations and Code Structure Unlike conventional oscillators, which tend to react late to trend changes because the
FREE
The Average Directional Index (ADX) is a technical analysis indicator developed by J. Welles Wilder in 1978. Its primary function is to measure the strength of a trend, regardless of its direction, and to determine whether the price has entered a sideways trend. It is also mentioned by John Murphy in *The Visual Investor* (2005) as an indicator that helps determine whether a market is ranging or is about to start a new trend. As for Exponential Moving Averages (EMAs), some authors believe that
FREE
フィルタ:
レビューなし
レビューに返信