Multi Standard Error Channel
- Indicateurs
- Version: 2.0
- Mise à jour: 6 octobre 2026

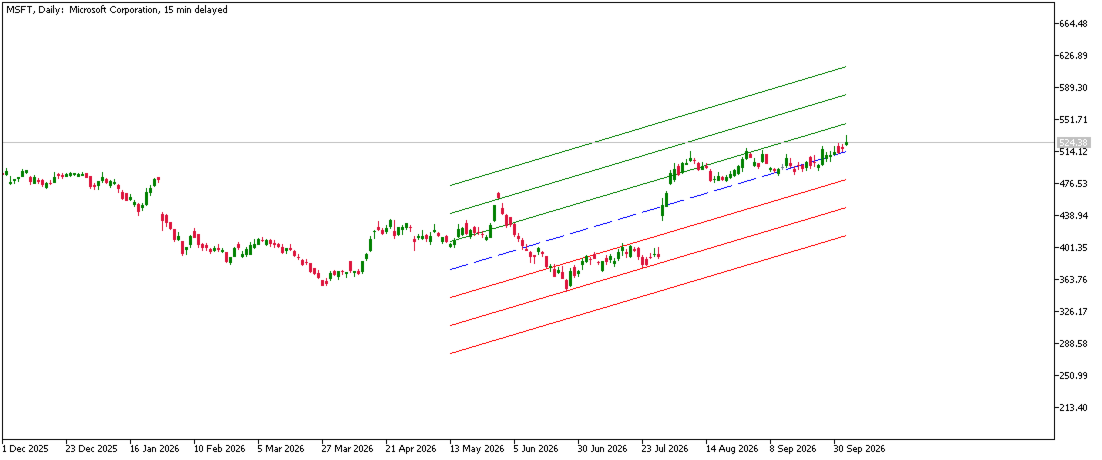
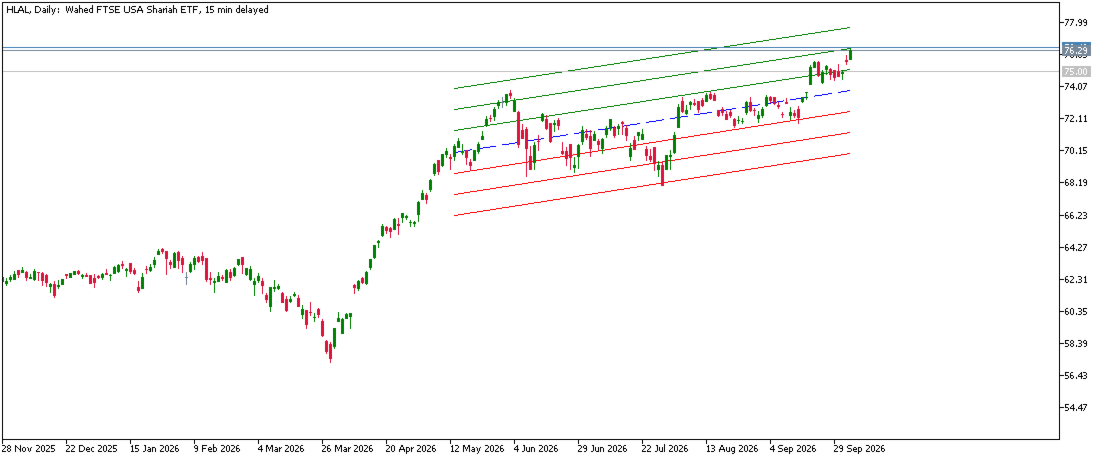
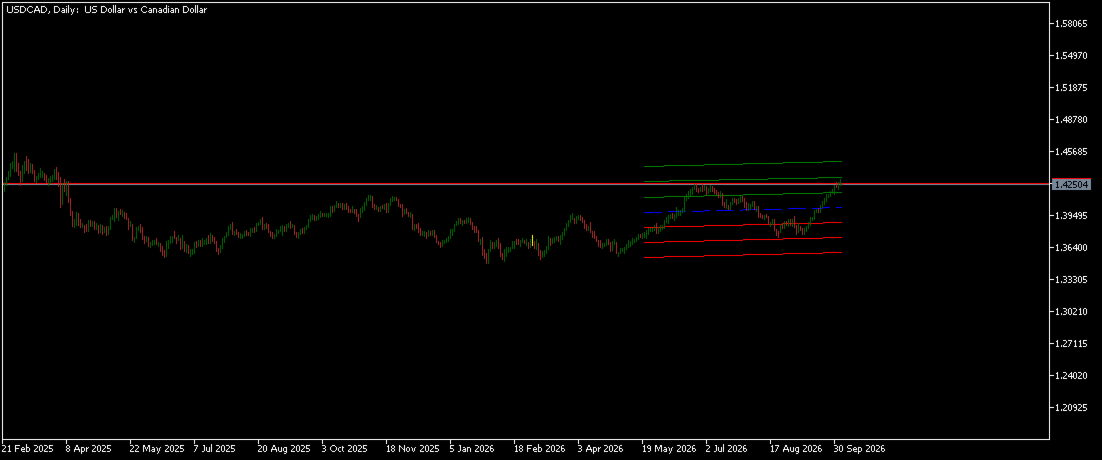
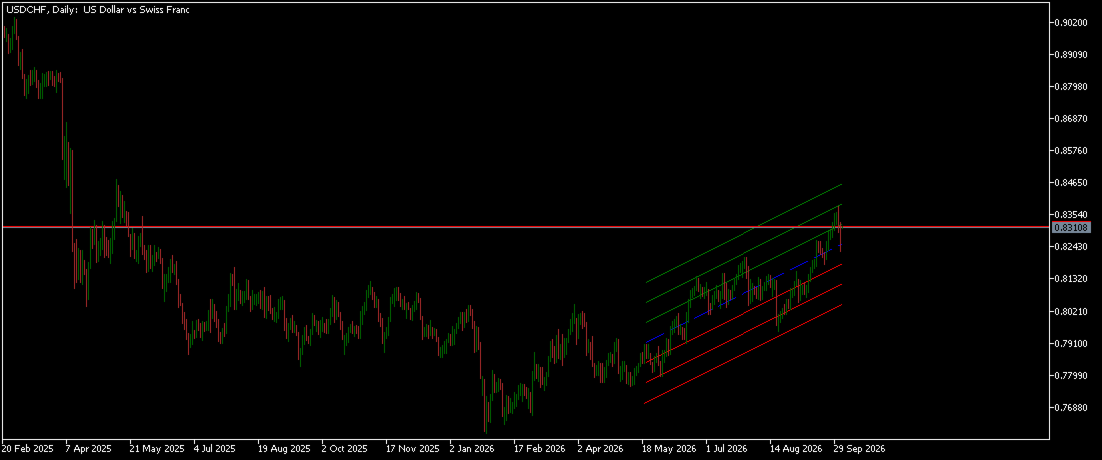
The “Multi Standard Error Channel” indicator was taken directly from the Thinkorswim® indicator of the same name (and translated into MQL5), except that “Multi” was added because it has been enhanced to incorporate three channels into the same indicator, allowing the user to analyze the price chart for different numbers of bars and standard deviations. The “Standard Error Channel” indicator, unlike the “Standard Dev Channel,” uses the average dispersion of prices around the fitted regression line; that is, it does not consider prices directly but instead uses the standard error.
The theory underlying this indicator, as was the case with the simple regression channel, has its origins in statistics and the concept of linear regression; however, unlike prices, here we consider the average dispersion of prices around the fitted regression line. Because of this mathematical principle, it can be observed that, although both consider the same concept of one, two, or three standard deviations, the standard error channel is much narrower than that of the simple deviation; for this reason, prices are more likely to reach the extremes of the channel.
Just as with subjective trend channels, the standard error channel indicates a strong trend when the price breaks out sharply from the channel; and just as with the simple regression channel, the theory underlying this channel assumes that the data are normally distributed—that is, that the data follow a normal probability distribution—which, as has already been noted, is incorrect when studying prices per se.