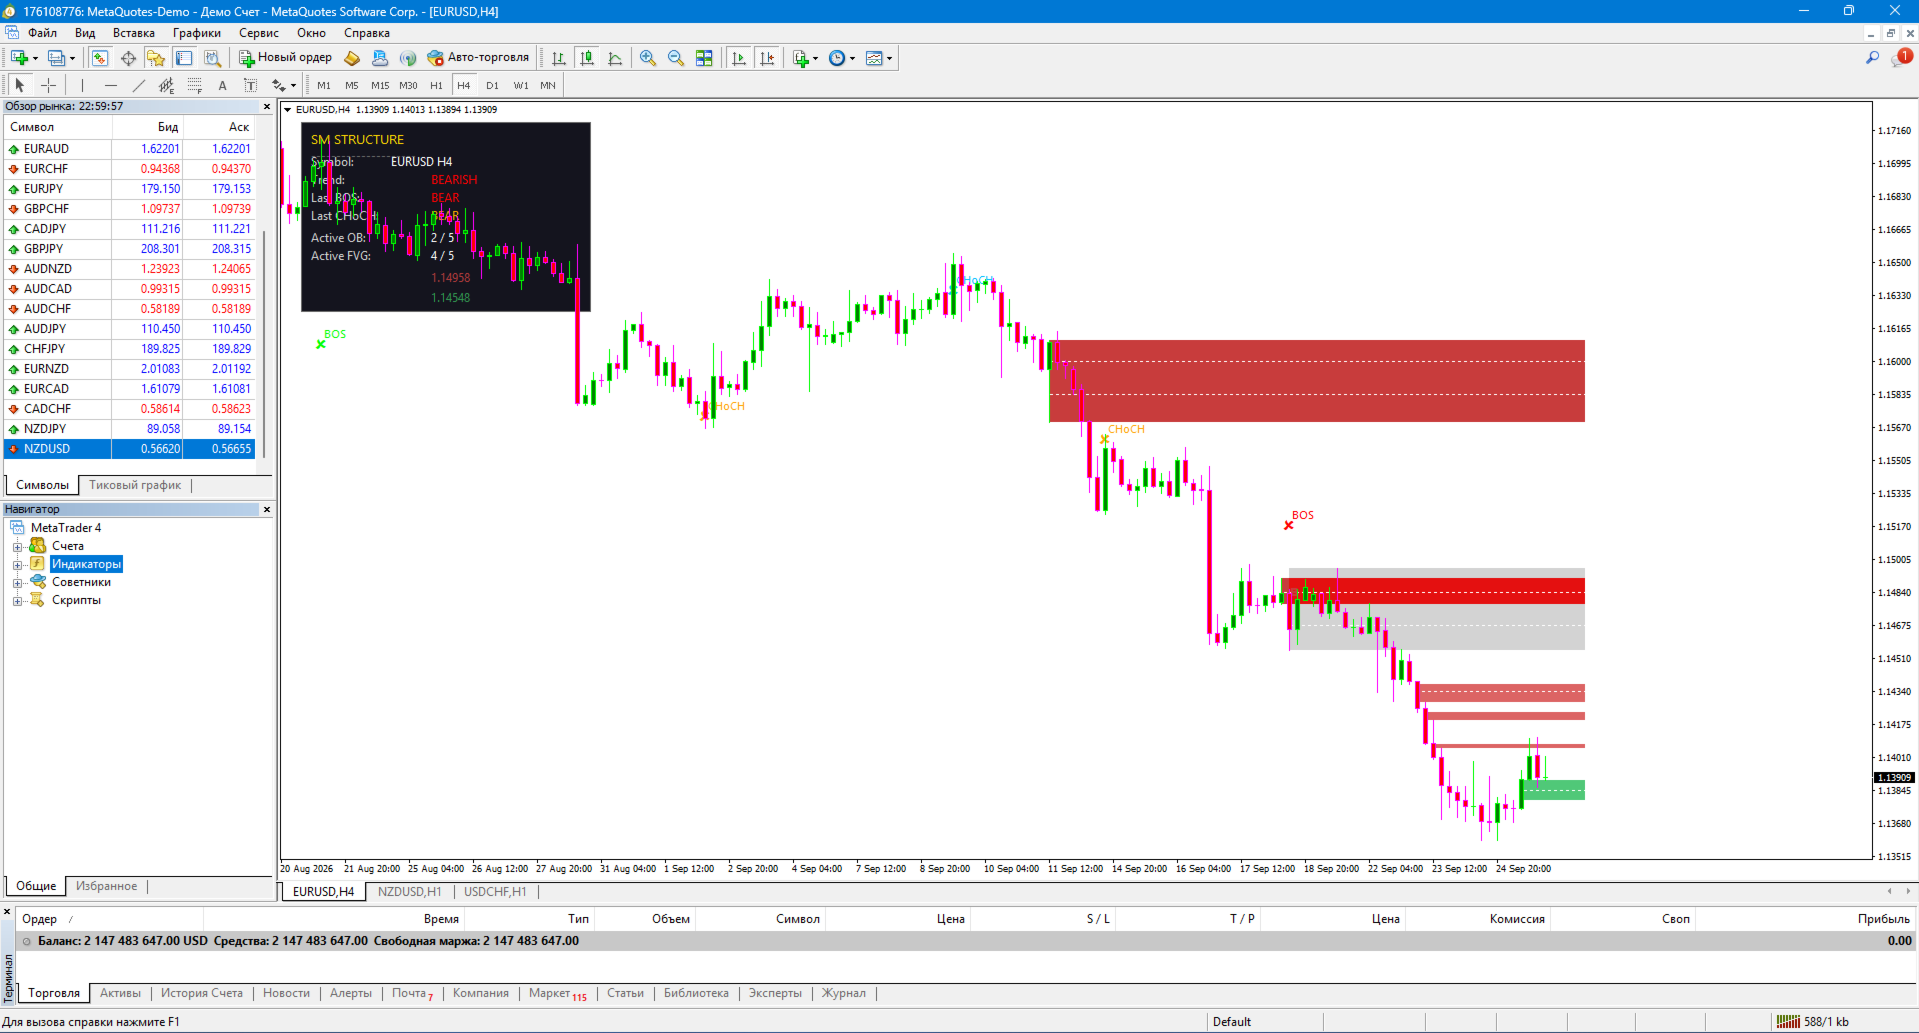
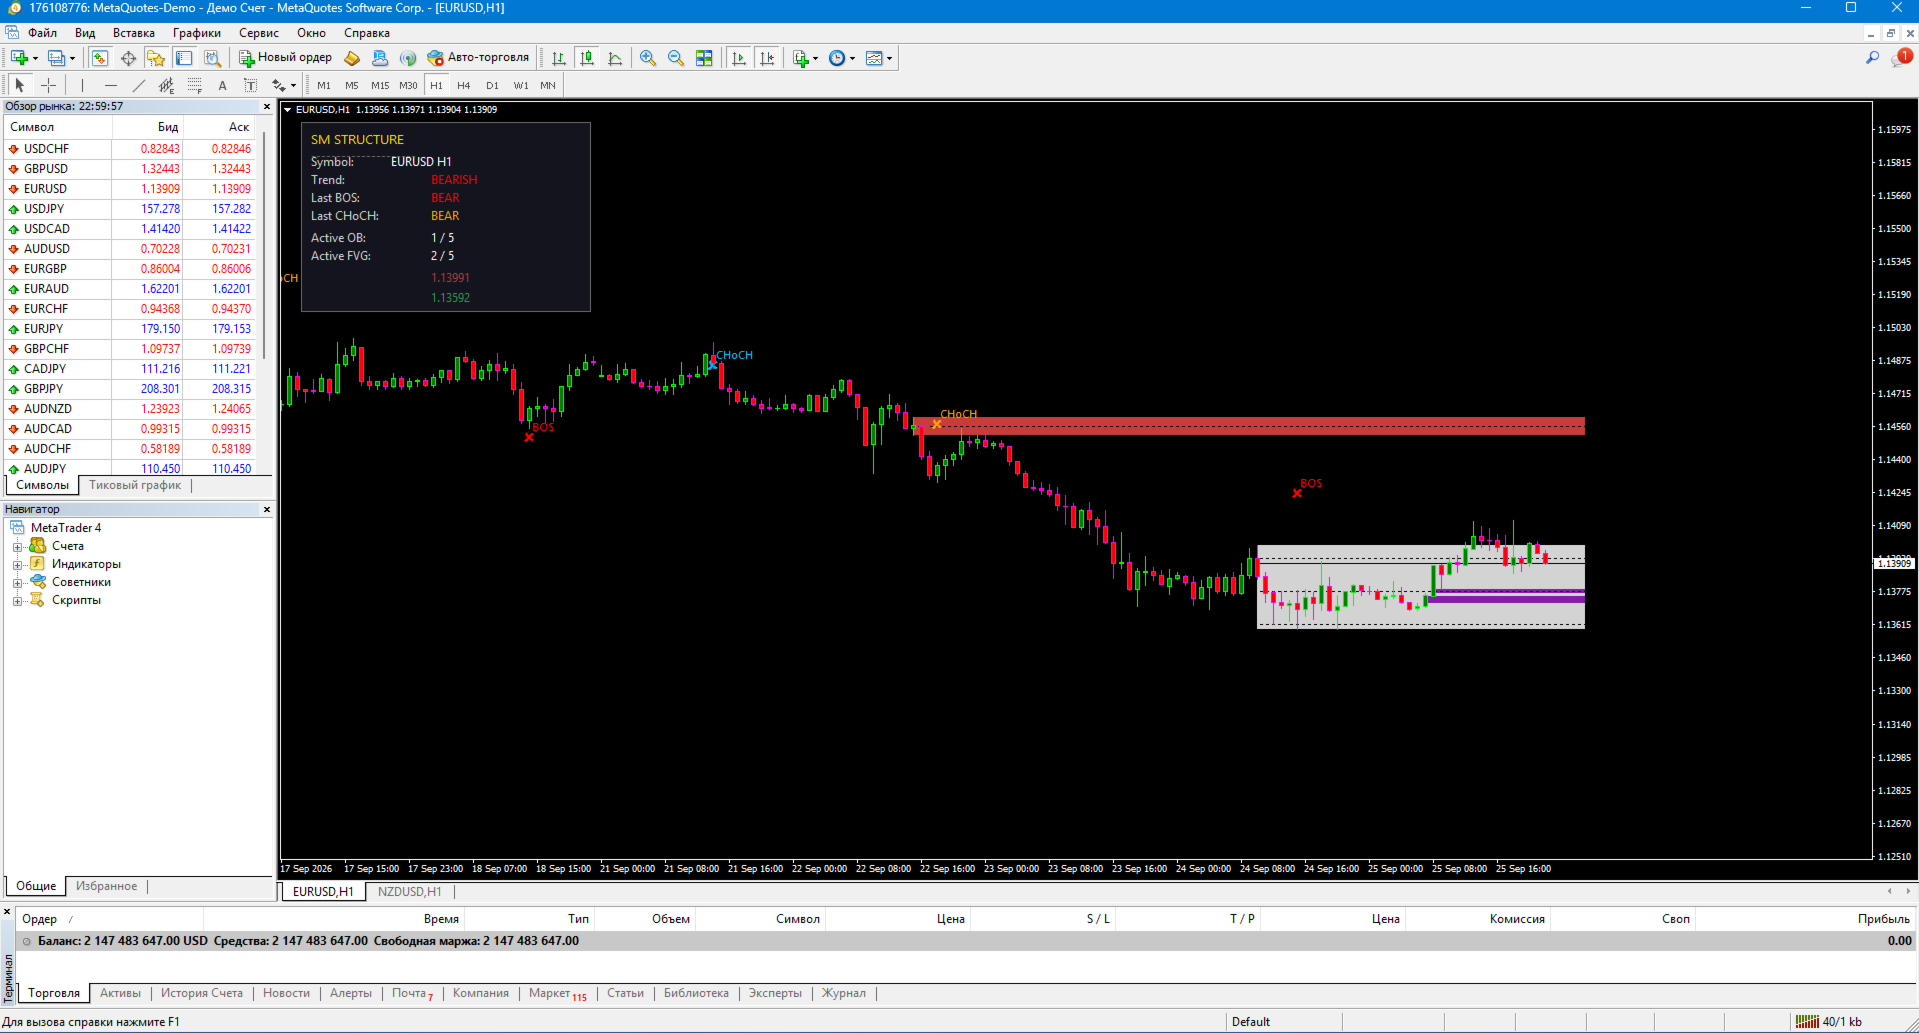
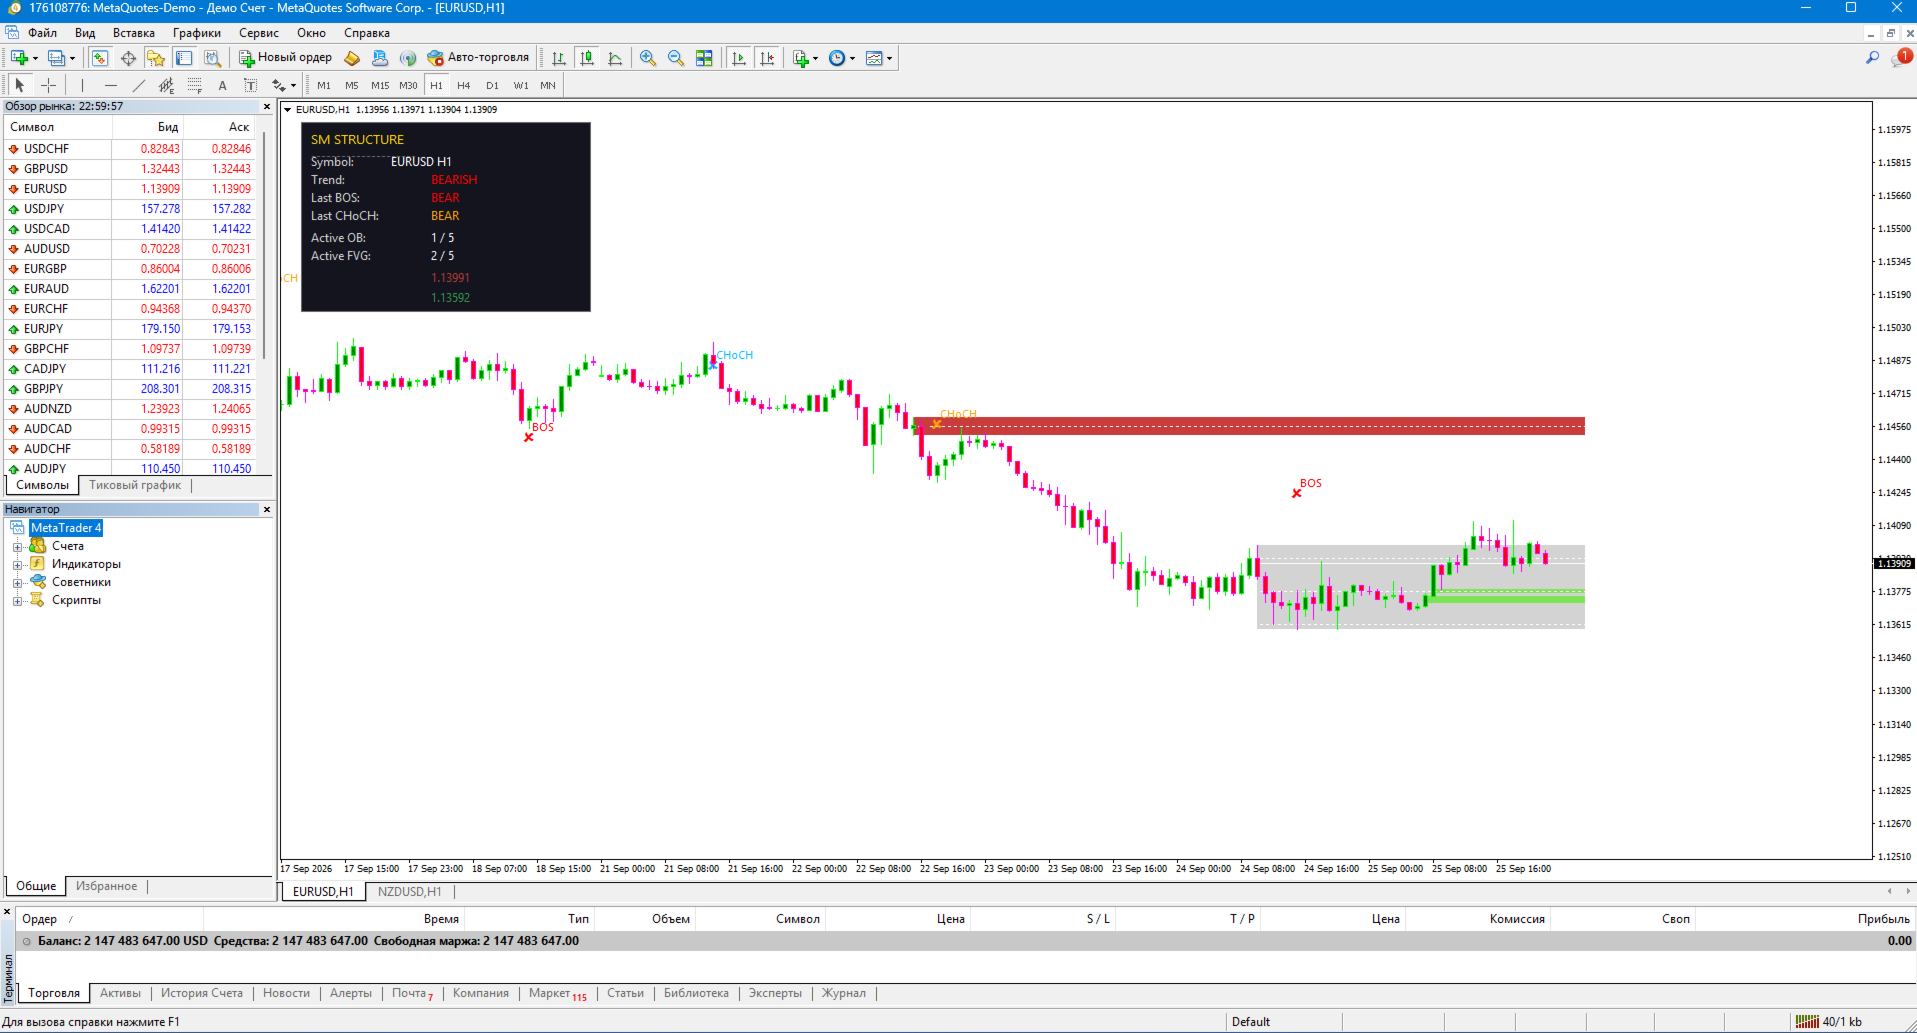
SM Structure PR

💡 Like the logic of this tool?

Explore the full ecosystem of professional indicators and utilities, built by a trader for traders:

👉 All author's products in MQL5 Market: https://www.mql5.com/en/users/musa1994/seller

🌐 Trading philosophy and details: https://developer-mql4-mql5.netlify.app/

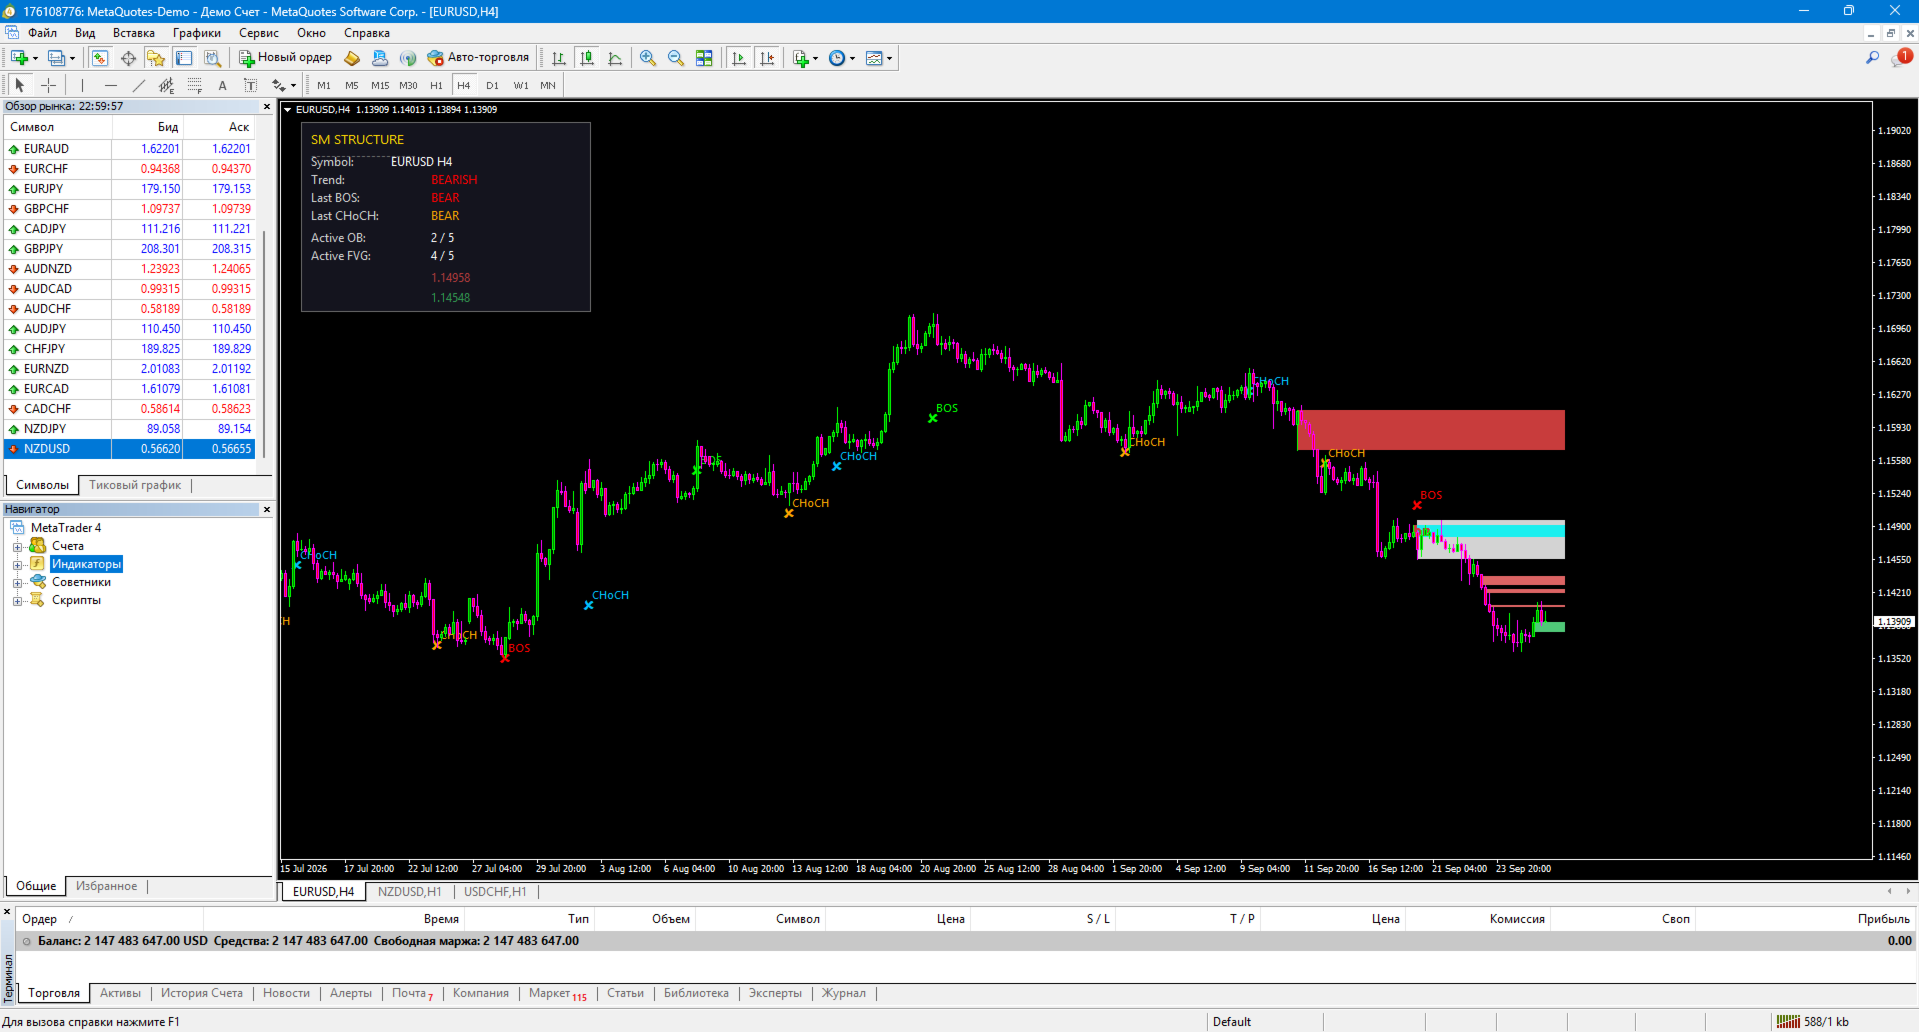
SM Structure PR is a professional indicator for MetaTrader 4 that automatically identifies market structure using Smart Money Concepts (SMC) and ICT methodology. It detects BOS (Break of Structure), CHoCH (Change of Character), Order Blocks, Fair Value Gaps (FVG) and Premium/Discount zones — all in one tool.

Built by a trader with 12 years of live experience. Helps see market structure the way institutional players see it, and find entries in the direction of "smart money".

🎯 What the indicator shows

Market structure:

  • ✅ BOS (Break of Structure) — trend-following structure break

  • 🔄 CHoCH (Change of Character) — first reversal signal

  • 📊 Swing High / Low — key structural points

Smart Money zones:

  • 🟩 Order Blocks — zones where institutional capital opened positions

  • 🟦 FVG (Fair Value Gaps) — imbalances that price typically fills

  • 🔴 Premium zone — upper half of the range (expensive)

  • 🟢 Discount zone — lower half of the range (cheap)

Dashboard:

  • Current symbol and timeframe

  • Trend direction (BULLISH / BEARISH / NEUTRAL)

  • Last BOS and CHoCH

  • Active OB and FVG counts

  • Premium and Discount levels

✨ Key features

📈 Automatic structure detection

The indicator finds swings, marks BOS and CHoCH automatically — no manual chart marking needed. Everything updates in real time.

🎯 Order Blocks with mitigation

Order Blocks are identified as the last opposite candle before the impulse. The indicator tracks mitigation — when price breaks through the zone, it fades or hides (configurable).

📊 Fair Value Gaps (FVG)

Classic three-candle imbalances with a minimum size in points. Active FVGs are highlighted with fill, mitigated ones become faded.

⚖️ Premium / Discount zones

Automatic identification of the upper (Premium) and lower (Discount) halves of the range between the latest significant swings. Classic ICT approach: buy in Discount, sell in Premium.

🚫 Anti-clutter protection

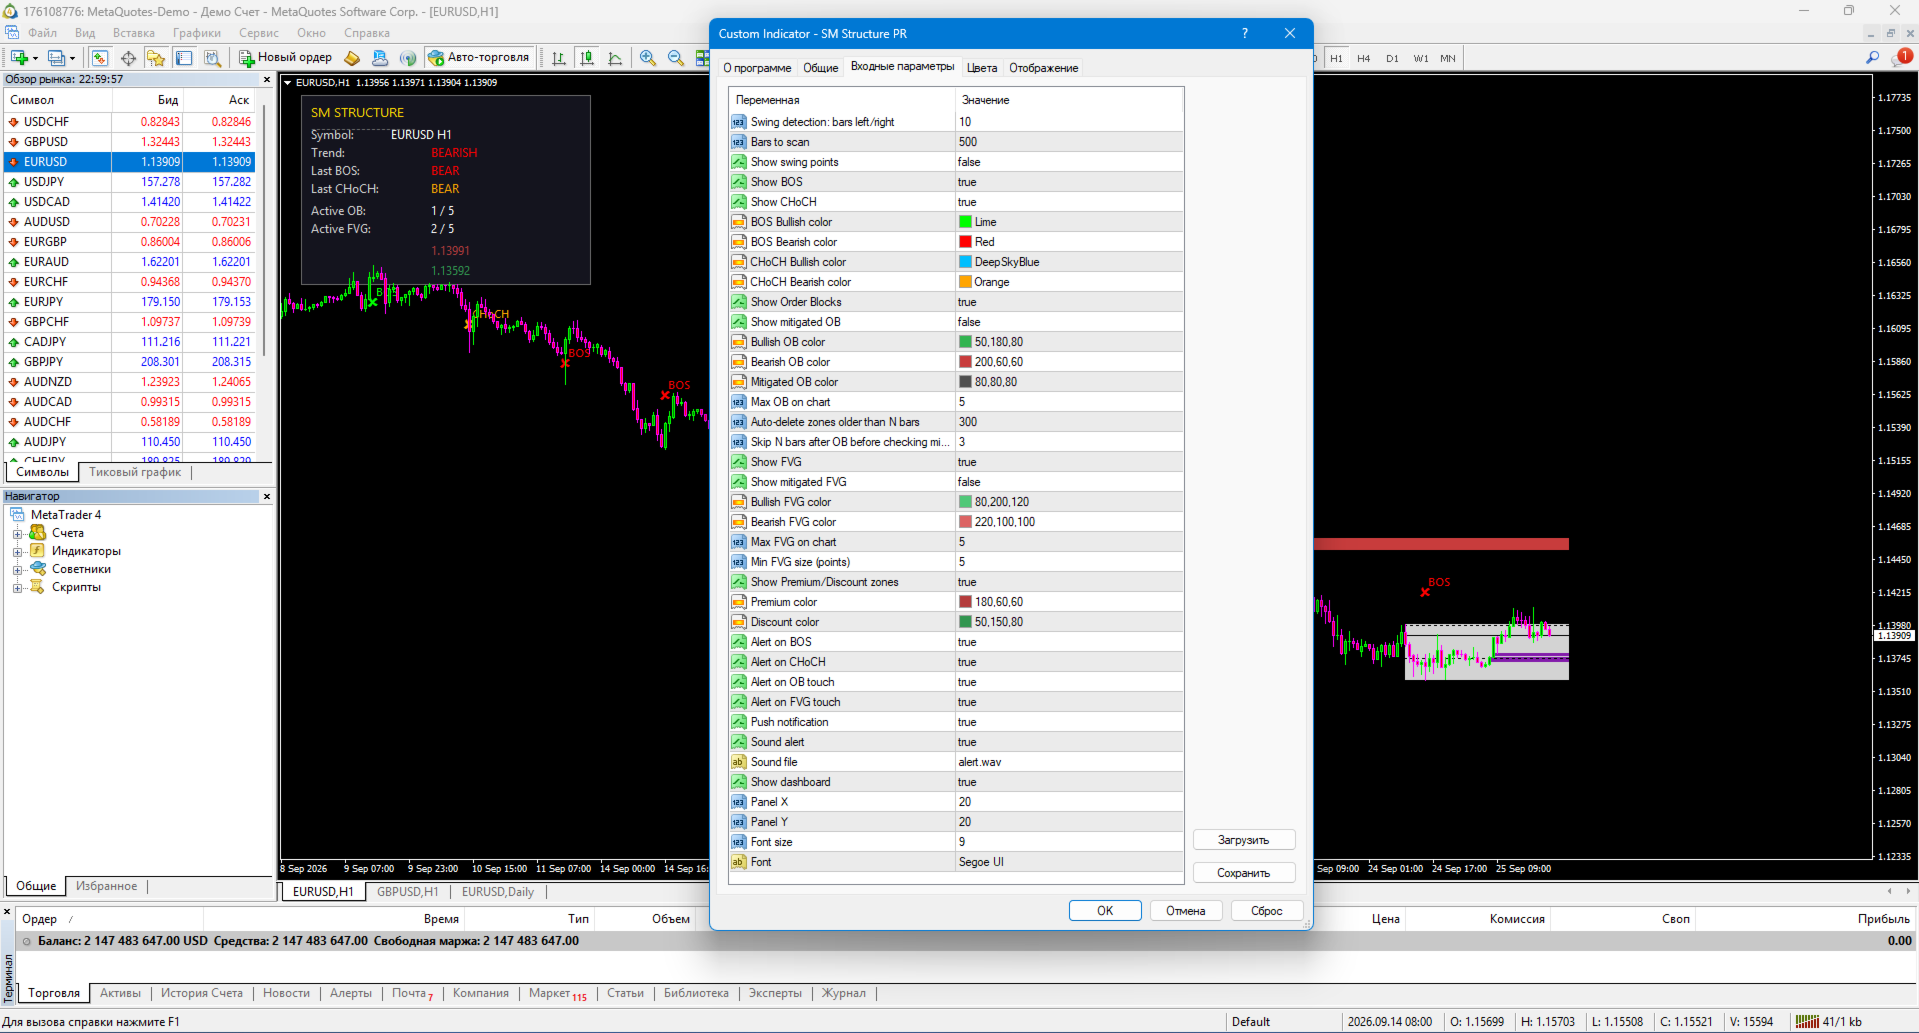
  • Max active OB and FVG (default 5 each)

  • Auto-delete zones older than N bars

  • Skips impulse bars during mitigation check — no false triggers

🔔 Alerts

  • Popup alert

  • Push notification to mobile MT4

  • Sound alert

  • Separate alerts for BOS, CHoCH, OB touch and FVG touch

🎨 Flexible settings

  • Colors and widths of all elements

  • Show/hide swings, mitigated zones

  • Configure number of displayed zones

  • Disable any element

🌍 Cross-platform

Unified logic for MetaTrader 4. Identical signals — can be used on both platforms in parallel.

🛠️ How to use

1. Installation

  • Copy SMStructure.ex4 to MQL4/Indicators/ (MT4)

  • Restart the terminal

  • Drag the indicator onto the chart

2. Tuning by instrument

Instrument SwingBars MinFVGPoints MaxOB MaxFVG
EURUSD, GBPUSD 10 5 5 5
XAUUSD (gold) 10 50 5 5
BTCUSD, ETHUSD 12 500 5 5
US500, NAS100 10 20 5 5

3. Trading scenarios

  • BOS up → bullish trend, buy on retrace to OB or FVG below

  • BOS down → bearish trend, sell on retrace to OB or FVG above

  • CHoCH → possible reversal, wait for confirmation (new BOS)

  • Price in Discount + bullish OB → strong buy signal

  • Price in Premium + bearish OB → strong sell signal

  • FVG + OB in same zone → high-probability zone

4. Recommended timeframes

  • M5–M15 — scalping and intraday

  • H1–H4 — swing trading

  • D1 — medium-term trading

📋 Implementation notes

  • Pure MQL4 — no DLLs, no external dependencies

  • No repaint — signals are stable after bar close

  • Works on any instrument: Forex, crypto, metals, indices, stocks

  • All timeframes: M1 to MN

  • Optimized performance

  • Multilingual interface (planned)

⚠️ Important warning

SM Structure is not a trading system. It's a market structure analysis tool. The indicator doesn't provide 100% buy/sell signals — it shows zones of institutional interest and current structure state.

Using the indicator does not guarantee profit. All trading decisions are made by the trader.

🏆 About the developer

Created by Musa Khunarikov — trader with 12 years of live experience (Forex, stocks, MOEX, metals). 51 certifications from "Finam" training center in trading, algo trading and MetaTrader 4.5 .

Services: EA development, indicators, panels, trading system audit.

📞 Support

30 days of free support after purchase. Bug fixes within 48 hours.

おすすめのプロダクト
This indicator filters the Zigzag indicator to calculate the main support and resistance levels. Variables minimum gap between peaks : is the distance (GAP) between the peaks of the Zigzag peaks sensitivity : Minimum number of nearby peaks look back: it means that it has to test the last 50 peaks in the Zigzag object name perfix: a prefix for level’s line name on chart
FREE
RelicusRoad Daily Pivots は MetaTrader 4 および MetaTrader 5 向けの日次ピボットポイントインジケーターで、前日のレンジをフィボナッチレベルに分割し、マイナス 100 パーセントからプラス 200 パーセントまでその上下に延長します。 従来のフロアピボットではなく、直近の確定したレンジを安値が 0%、高値が 100% となるスケールとして扱います。19 本のレベルがチャート右端にコンパクトな色付きマーカーとして表示されるため、当日の値動きの大きさを前日のレンジに対する割合や倍数として読み取れます。 仕組み インジケーターは直前に確定した基準期間の高値と安値を取り、そのレンジの各比率にレベルを配置します。レベル = 安値 + 比率 x (高値 - 安値)。週末の足はスキップされるため、月曜日の基準は直近の取引日になります。基準期間はチャートの時間足から決まります。 内側のセット(グレー):0%、23.6%、38.2%、50.0%、61.8%、78.6%、100%。 上側のセット(緑):+123.6%、+138.2%、+150.0%、+16
FREE
インディケータは指定された数のろうそくを分析し、高値-安値に基づいてフィボナッチレベルをプロットします。 レベルが再配置されているので、範囲の右側に関心があります。 価格はレベルに固執し、タッチに反応します。 このツールを使用して、修正後のトレンドエントリポイントを見つけます。 左側でレベルが完全に上昇していることがわかる場合は、極値で移動の終わりを見つけたと見なすことができます。 すべての線は、バッファまたはオブジェクトを介して描画されます(オプション)。 入力パラメータ 。 Bars Count - 計算範囲 。 Visual Button - ボタン表示(有効/無効) 。 Corner - ボタンアンカー角度 。 X indent - ピクセル単位の水平パディング 。 Y indent - ピクセル単位の垂直パディング 。 Label Visual - 表示レベルラベル 。 Label Font Size   - フォントサイズ 。 Label Shift Bars   - バーの碑文のインデント 。 Label Tooltip   - レベルの上のカーソルの下にテキスト
FREE
Wa Candle Timer MT4
Wachinou Lionnel Pyrrhus Sovi Guidi
5 (1)
Wa Candle Timer MT4 は、次のローソク足が形成されるまでの残り時間を表示する、強力でユーザーフレンドリーなMT4インジケーターです。このツールは、ローソク足のクローズタイミングを把握しやすくし、より良い取引判断を支援します。 主な機能 : 現在のローソク足のカウントダウンを表示 残り時間が指定した割合を下回ると色が変化 バージョン3.00の新機能:指定した割合でアラートを出す設定が可能 フォントと色の完全カスタマイズ対応 時間管理と取引精度の向上に貢献 カスタマイズ可能な設定 : 1️⃣ 閾値以上のカラー設定 2️⃣ 閾値以下のカラー設定 3️⃣ フォントサイズ 4️⃣ フォントスタイル 5️⃣ アラート発動の割合(%)
FREE
Pivot Points Classic and Camarilla は、クラシックピボットレベル(P、R1-R3、S1-S3)とCamarillaレベル(H1-H4、L1-L4)をチャート上に直接描画します。レベルは選択した時間足(デフォルトはD1)の前の期間の高値・安値・終値から計算され、各期間はそれが適用される期間にわたって水平線で描画されるため、過去の日・週・月に価格がレベルにどう反応したかを確認できます。 機能 クラシックピボット - 中心のピボットPと、3本のレジスタンス(R1-R3)、3本のサポート(S1-S3) Camarillaピボット - H1-H4とL1-L4の8レベル。Camarillaトレーダーが最も注目するレベルであるため、H3/L3とH4/L4は太く描画されます。クラシックではピボットPと外側のR3/S3が太くなります Classic、Camarilla、または両方 を同じチャートに表示可能。Classicの線は実線、Camarillaの線はデフォルトで破線スタイルです(線のスタイルは入力パラメータで変更できます) 任意のソース時間足 - 日中足チャートで
FREE
This indicators automatically draws the Support and resistances levels for you once you've dropped it on a chart.  It reduces the hustle of drawing and redrawing these levels every time you analysis prices on a chart. With it, all you have to do is dropped it on a chart, adjust the settings to your liking and let the indicator do the rest.  But wait, it gets better; the indicator is absolutely free!  Get the new and improved version here:  https://youtu.be/rTxbPOBu3nY Parameters Time-frame  -> T
FREE
指標は、ボラティリティに基づいて自動的にチャート上の大きな影を検索して表示します。 影はさらに波のサイズによってフィルタリングされます。 このアルゴリズムは、指定された範囲の影によるフラクタル内訳を分析し、レベルを表示します。 設定では、複数通貨ダッシュボードを有効にすることができます。 アラートは、現在のスケジュールまたはダッシュボードシート全体の間で選択されます。 大きな影の信号とフラクタルレベルを突破した信号は、別々にオンにすることができます。 Blog-Link -   Retest and Fake Breakout with UPD1 。 取引パターン: +トレンド別再テスト 。 +偽の内訳 。 +その他 。 EURUSD, GBPUSD, XAUUSD, ... M15, M30, H1 。 入力パラメータ 。 メイン 。 Bars Count – 表示するバーの数 。 ATR Period - ボラティリティを計算するローソク足の数 。 ATR Coeff Shadow (0 - Off) – シャドウサイズ係数(平均ボラティリティに対する) 。 ATR Co
The price is moving between two curve tunnel lines in a trend. The two lines of a tunnel represent support and resistance. In an uptrend, for instance, a trade might be entered at the support of the trend line (shown by the red line in the chart) and exited at resistance of the upper tunnel line (shown by the blue line). Tunnel show trend direction for any timeframe (if you have enough bars on the chart for higher timeframes). Trend, or price tunnel, can be up, down or sideways. If the current p
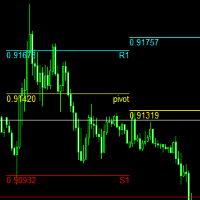
pivot points using by many traders and pivot levels most of the times are very helpfull . this indicator is a custom with internal parameters. it can show two times pivot (weekly and daily). you can choose periods total for each time showing pivots.( 1 week , 2 week ,...1day , 2day ,...) when use weekly and daily pivots , it can show you many support and resistance zones. if have proposal comment too me for upgrading indicator.

FREE
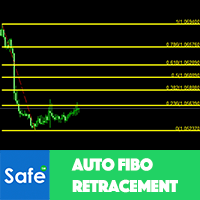
Auto Fibonacci Retracement Indicator — Flexible and Reliable This is not just another Auto Fibonacci Retracement indicator — it’s one of the most flexible and dependable tools available . If you find it useful, please leave a review or comment to support the project. Check out my other helpful tools below: Telegram to MT4 using AI   - AI-Powered Signal Copier Bot Timeframes Trend Scanner    - Scan the trend of assets in difference timeframes with multiple indicators Market Trend Scanner   - Scan
FREE
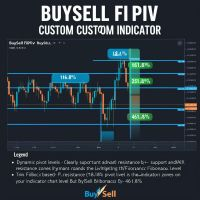
BuySell FibPiv Fibonacci Pivot Level Indicator with Dynamic Support and Resistance Zones Overview BuySell FibPiv is a Fibonacci pivot-based technical analysis indicator designed to calculate dynamic support and resistance levels using previous session price data. The indicator applies Fibonacci expansion and retracement calculations to generate multiple pivot-based levels for intraday and swing trading analysis. It provides: Central pivot calculation Fibonacci-based support and resistance zones
Peak Trough Analysis is the great tool to detect peaks and troughs in your chart. Peak Trough Analysis tool can use three different peaks and troughs detection algorithm. The three algorithm include the orignal Fractals Indicator by Bill Williams, the Modified Fractals indicator and ZigZag indicator. You can use this peak and trough analysis tool to detect the price pattern made up from Equilibrium Fractal-Wave process. For further usage, there are good guide line on how to use this peak trough
FREE
Description: This indicator draw ZigZag Line in multiple time frame also search for Harmonic patterns before completion of the pattern. Features: Five instances of ZigZag indicators can be configured to any desired timeframe and inputs. Draw Harmonic pattern before pattern completion. Display Fibonacci retracement ratios. Configurable Fibonacci retracement ratios. Draw AB=CD based on Fibonacci retracement you define. You can define margin of error allowed in Harmonic or Fibonacci calculations
FREE
Raymond Cloudy Day Indicator for MT4 – Pivot-Based Reversal and Trend Levels Raymond Cloudy Day Indicator is a pivot-based level indicator for MetaTrader 4 (MT4). It was developed by Ngo The Hung based on Raymond’s original idea and is designed to give a structured view of potential reversal zones, trend extensions and support/resistance levels directly on the chart. The default settings are optimised for XAUUSD on the H1 timeframe, but the indicator can be tested and adjusted for other symbols
TCL Auto Pivot Points is a daily, weekly, and monthly pivot-point indicator for MetaTrader 4. It calculates classic institutional support and resistance levels (R1 through R3 and S1 through S3) using a choice of four formulas and plots them automatically on the chart. What It Plots The indicator draws seven horizontal lines: the central Pivot Point (P), three Resistance levels (R1, R2, R3) above it, and three Support levels (S1, S2, S3) below. The lines update at the start of each pivot period (
FREE
無料 — ZigZag のスイング・ピボットと移動平均トレンドフィルターを、同じチャート上にまとめて描画します。ピボット・ブレイクアウト系のシステムが売買の根拠とするピボット水準とトレンドの背景を表示します。ゴールド(XAUUSD)向けに調整済みです。 完全無料・制限なしでご利用いただけます。チャートで役立つと感じられましたら、短いレビューをいただけると何よりの助けになります。30秒で終わり、他のトレーダーがこのツールを見つける唯一の手がかりになります。 対応プラットフォーム: MetaTrader 4(このページ)。 ピボットのブレイクは、より大きなトレンドの方向でこそ意味を持ちます。本インジケーターは確定した各スイング・ピボットを記し、トレンド移動平均を描くことで、直近ピボットのブレイクがトレンド順張りか逆張りかを一目で把握できるようにします。 === 何を描画するか === - 確定した ZigZag のスイング高値・安値(ドット)— ブレイクアウト系システムが反応するピボット。 - トレンド移動平均(既定 MA 50)。 === 確定したピボットはリペイントしません
FREE
SRP (Strong Retracement/Reversal Points) is a powerful and unique support and resistance indicator. It displays the closest important levels which we expect the price retracement/reversal! If all level are broken from one side, it recalculates and draws new support and resistance levels, so the levels might be valid for several days depending on the market! Key Features You can use it in all time-frames smaller than daily! Displays closest significant support and resistance levels Update the le
FREE
Pivot Points MT4
KEENBASE SOFTWARE SOLUTIONS
KT Pivot Points は、最新の市場データに基づいて、日足・週足・月足のピボットレベルをチャート上に自動で表示します。ピボットポイントは、特にFX市場において、テクニカル分析で広く利用されている指標の一つです。 特徴 価格がピボットレベルに到達した際にアラートを送信します。  各種類のピボットレベルに対して完全なカスタマイズが可能です。   シンプルな表示で、日足・週足・月足のピボットレベルを一目で確認できます。 最小限のCPUリソースを使用し、高速な計算を実現します。 チャート上の他のインジケーターとも互換性があります。 ピボットポイントとは ピボットポイントは、前の取引日の高値、安値、終値の平均から算出されます。  この計算により、将来のサポートおよびレジスタンスレベルを予測でき、価格がこれらのレベル付近でどのように動くかを判断する手助けとなります。 また、価格がピボットポイントの上にあるときは強気傾向、下にあるときは弱気傾向とされるのが一般的です。 ピボットの計算式 ピボットレベルの計算には、前日、週、または月の高値、安値、終値が使用されます。 P = (H +
Description: The indicator measures, through the zigzag indicator, the levels of trend or correction. It shows in the chart the levels of each low or high detected. KEY LINKS:   How to Install  –  Frequent Questions  -  All Products  How is this indicator useful? This indicator determines, depending on Zigzag parameter if a trend is beginning, developing, or ending This indicator determines the direction of the trend Components Levels as positive or negative numbers, depending on the direction
FREE
シンプルだが効果的。 反転インジケーター - それは何か? スーパートレンドのロジックと指数曲線技術を組み合わせたトレンドフォロー型オーバーレイインジケーターです。トレンドの方向を検知し、チャート上に動的なチャネルを描画し、トレンドが反転した際にリアルタイムでアラートを送信します。 仕組み ATRとスーパートレンド係数を用いて指数ベースラインを算出。価格がこのベースラインを上抜け/下抜けした時点でトレンド反転を確認。緑矢印は買いトレンド開始、赤矢印は売りトレンド開始を示す。 特徴: ATRベースの動的チャネル付き指数トレンドベースライン 緑/赤で色分けされたトレンドラインと塗りつぶしチャネル トレンド反転時の買い/売り矢印シグナル 内蔵アラート:ポップアップ、プッシュ通知、メール、サウンド 重複アラート防止(1バーあたり1アラート) 完全カスタマイズ可能:色、線幅、矢印サイズ、チャネル幅 遅延のないクリーンなチャートオーバーレイ 入力パラメータ: 指数係数、スーパートレンド係数、ATR期間、チャネル幅 オン/オフ切り替え:チャネル塗りつぶし、矢印、各アラートタイプ 全視覚
FREE
Necessary for traders: tools and indicators Waves automatically calculate indicators, channel trend trading Perfect trend-wave automatic calculation channel calculation , MT4 Perfect trend-wave automatic calculation channel calculation , MT5 Local Trading copying Easy And Fast Copy , MT4 Easy And Fast Copy , MT5 Local Trading copying For DEMO Easy And Fast Copy , MT4 DEMO Easy And Fast Copy , MT5 DEMO The homeopathic indicator is also called the CCI indicator. The CCI indicator was proposed
FREE
Introduction Harmonic Patterns are best used to predict potential turning point. Traditionally, Harmonic Pattern was identified manually connecting peaks and troughs points in the chart. Manual harmonic pattern detection is painfully tedious and not suitable for everyone. You are often exposed under subjective pattern identification with manual pattern detection. To avoid these limitations, Harmonic Pattern Plus was designed to automate your harmonic pattern detection process. The functionality
Liquidity Grab X — Liquidity Sweep & Grab Detector (MT4 & MT5) Liquidity Grab X automatically detects buyside and sellside liquidity sweeps (stop-hunts) at swing pivots and classifies each grab by strength — helping you spot exhaustion moves and potential reversal zones in real time, with instant push notifications to your phone. Full Description Liquidity Grab X is a free rule-based indicator for MetaTrader 4 and MetaTrader 5 that identifies liquidity grabs — moments where price sweeps above a
FREE
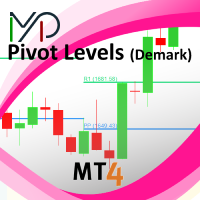
This indicator is stand alone version from  MP Pivot Levels  (All in one) containing Demark's Pivots. Calculations:     PP = X / 4     R1 = X / 2 - LOWprev     S1 = X / 2 - HIGHprev Uses: When the pair currency price may change the direction of movement. Possible constraints of support and resistance that creates plateaus for the currency pair prices. Tendency identification by comparing the present prices according to current day's pivot point and also the prior day's pivot points. ____________
FREE
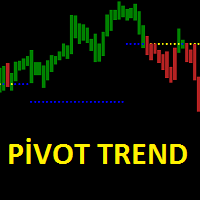
Pivot trend indicator is a trend indicator that uses standard pivot calculation and some indicators. The purpose of the indicator is to calculate the possible trends using the pivot point. And to give the user an idea about trend direction. You can use this display as a trend indicator. Or with other indicators suitable for your strategy. Features The green bar represents the upward trend. The red bar represents the downward trend. The blue pivot point represents the upward trend. The yellow pi
Trend formation channel is a set of lines. The two central lines of the indicator represent moving averages of the specified type and period, they also form a small channel. The large channel is formed - the central lines of the indicator plus / minus the standard deviation estimate, multiplied by the coefficient selected by the user. The basic rule for plotting is that about 5% of prices should be outside these lines, and 95% - inside. If the price crosses the upper or lower line too often, th
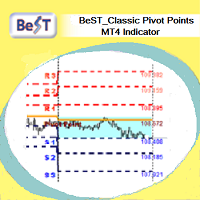
BeST_ Classic Pivot Points is an MT4 Indicator that is based on the widely known and definitely classic Pivot Point of a market prices activity. A pivot point is calculated as an average of significant prices (high,low,close) from the performance of a market in the prior trading period. If the market in the following period trades above the pivot point it is usually evaluated as a bullish sentiment, whereas trading below the pivot point is seen as bearish. A pivot point and the associated suppo
FREE
Convenient drawing of parabolic channels by four points (two lower and two upper extremums). Additional control keys: N (New) - Start drawing a new channel. C (Clear) - Deletes the current channel. By default, the current channel is the last channel. But you can click on the line of any channel to make it current. Click on the gear in the upper right corner to set some parameters for all channels or the current channel. All work is visible from the animated Gif. Channels are saved when the time
FREE
This is a well-known ZigZag indicator. But it differs by the fact that its plot is based on values of the middle line which is set by a user. It can display Andrews’ Pitchfork and standard or Bobokus Fibo levels. NO REPAINTING. Parameters Period МА — middle line period. Default value is 34. Minimum value is 4. Maximum value is set at your discretion. Used to calculate price - base price to calculate the middle line. The averaging method - method of smoothing the middle line. Turning pitchfork —
FREE
Aura Mini Candle Timer - スマート・インタラクティブ・エディション Aura Mini Candle Timerは、チャート上のスペースを最小限に抑えつつ、複数の時間足(MTF)におけるローソク足の残り時間と現在の方向を直感的に表示する軽量なインジケーターです。 本インジケーターの最大の特徴は、その「インタラクティブ(対話型)」な操作性にあります。設定画面を開くことなく、チャート上のタイマーパネルをクリックするだけで、主要な7つの時間足をリアルタイムで切り替えることが可能です。 [主な機能] ワンクリックでの時間足切り替え:タイマーパネルをクリックするたびに、時間足が M1 M5 M15 M30 H1 H4 D1 の順序で即座に切り替わります。 独立した時間足の監視:現在表示しているチャートの時間足に関わらず、タイマー上で選択した特定の時間足の終了時刻や方向を個別に監視できます。 ローソク足の方向に連動する動的な色変化:選択した時間足の現在価格(終値)と始値を比較し、パネルの背景色が直感的に変化します。 陽線(Bullis
FREE
このプロダクトを購入した人は以下も購入しています
Quant Direction
Georgios Kalomoiropoulos
Quant Direction は、3次元の市場分析ツールです。完全に客観的なアルゴリズムベースの市場分析を提供し、様々なパラメータにわたる正確なパーセンテージ偏差を同時に算出します。高度なAI搭載モデリングツールで開発され、厳密なテストを経て開発されたこのアルゴリズムは、かつてない精度で市場を分析するように設計されています。プラットフォーム上では、あらゆる通貨ペアや金融商品を分析できます。 短期取引、デイトレード、スイングトレードなど、どのような取引スタイルに も、Quant Directionは最適な選択肢です。 オペレーターの本当の利点 Quant Directionの真の利点は、感情、眼精疲労、過剰分析を完全に排除できる点にあります。方向性を探るために何十ものチャートを手作業で精査したり、自分の好みを常に疑ったりする必要がなくなります。このシステムは、8つの時間間隔(5ヶ月から月単位まで)をミリ秒単位で処理します。あらゆる瞬間に市場を支配している主体を正確に明らかにし、常に成功確率が最も高い方向で取引できるようにします。 市場分析の3つの側面 このアルゴリズムは市場を3つの
Hidden Cycles
Lev Vladimirovic Marushkin
5 (1)
The Only 100% Universal Tool! Stop trading against nature! This is your chance to secure the only indicator rooted in the absolute laws that govern the entire universe. Most tools guess—this one reveals the truth. Buy another toy or buy the truth. Your choice... Based on Universal Laws — NOT Some Guy’s Algorithm: Let the market adjust to the Hidden Cycles Geometry — not the other way around. Most indicators are based on a man-made formula. They often lag, fail over time, or need constant re-o
Super Signal – Skyblade Edition プロ仕様のノンリペイント / ノーラグ・トレンドシグナルシステム。卓越した勝率を実現 | MT4 / MT5 対応 1分足、5分足、15分足などの低い時間足で最も効果を発揮します。 主な特徴: Super Signal – Skyblade Edition は、トレンド取引に特化したスマートなシグナルシステムです。マルチレイヤーのフィルターロジックを用いて、明確な方向性と実際のモメンタムに支えられた強力なトレンドのみを検出します。 このシステムは 天井や底を予測するものではありません 。次の3つの条件がすべて満たされた場合にのみシグナルを発生させます: 明確なトレンド方向 モメンタムの増加 健全なボラティリティ構造 市場セッションに基づく流動性分析と組み合わせることで、シグナルの精度とタイミングがさらに向上します。 シグナルの特性: すべての矢印シグナルは 100% 非リペイント / 遅延なし 一度出現したシグナルは固定され、点滅・消失しません チャート上の矢印、情報パネル、ポップアップ通知、音声アラート、プッシュ通知
Neuro Poseidon is a new indicator by Daria Rezueva. It combines precise trading signals with adaptive TP/SL levels - creating best possible trades as a result! Message me and get  Neuro Poseidon Assistant  as a gift to automize your trading process! What makes it stand out? 1. Proven profitability on all assets and timeframes 2. Only confirmed BUY and SELL signals present on the chart 3. Adaptive TP & SL levels generated by the software for each trade 4. Easy to understand - suitable for all
Gold Channel is a volatility-based indicator, developed with a specific timing algorithm for the XAUUSD pair, which consists of finding possible corrections in the market. This indicator shows two outer lines, an inner line (retracement line) and an arrow sign, where the theory of the channel is to help identify overbought and oversold conditions in the market. The market price will generally fall between the boundaries of the channel. If prices touch or move outside the channel it is a tradi
現在30%OFF! 初心者やエキスパートトレーダーのためのベストソリューション! このダッシュボードソフトウェアは、28の通貨ペアで動作しています。それは私達の主要な指標(高度な通貨の強さ28と高度な通貨インパルス)の2に基づいています。それは全体の外国為替市場の大きい概観を与えます。それは、すべての(9)時間枠で28の外国為替ペアのための高度な通貨の強さの値、通貨の動きの速度と信号を示しています。チャート上で1つのインディケータを使用して市場全体を観察し、トレンドやスキャルピングの機会をピンポイントで見つけることができたら、あなたのトレードがどのように改善されるか想像してみてください。 このインディケータには、強い通貨と弱い通貨の識別、潜在的な取引の識別と確認がより簡単になるような機能が搭載されています。このインディケータは、通貨の強さや弱さが増加しているか減少しているか、また、すべての時間枠でどのように機能しているかをグラフィカルに表示します。 新機能として、現在の市場環境の変化に適応するダイナミックなマーケットフィボナッチレベルが追加され、すでに当社のAdvanced
現在30%OFF! このダッシュボードは、複数のシンボルと最大9つのタイムフレームで動作するソフトウェアの非常に強力な部分です。 このソフトは、弊社のメインインジケーター(ベストレビュー:Advanced Supply Demand)をベースにしています。    Advanced Supply Demand ダッシュボードは、素晴らしい概要を提供します。それは示しています。  ゾーン強度評価を含むフィルタリングされた需給値。 ゾーン内/ゾーンへのPips距離。 ネストされたゾーンがハイライトされます。 選択されたシンボルの4種類のアラートを全ての(9)時間枠で提供します。 それはあなたの個人的なニーズに合わせて高度に設定可能です。 あなたの利益! すべてのトレーダーにとって最も重要な質問です。 市場に参入するのに最適なレベルはどこか? 成功のチャンスとリスク/リターンを得るために、強力な供給/需要ゾーン内またはその近くで取引を開始します。 損切りの最適な位置はどこですか? 最も安全なのは、強力な供給/需要ゾーンの下/上にストップを置くことです。 最適な利益
Miraculous Indicator Binary & Forex v3 StrategySafe Miraculous Indicator Binary & Forex v3 StrategySafe は、明確なシグナル、強力な確認ツール、そして Binary と Forex 市場で使える体系的な取引アプローチを求めるトレーダー向けのプロフェッショナル指標です。 v3 では、MIR Dashboard、Miraculous Confirmation Dashboard、GANN Law、Square of 9 レベル、GANN 角度、そしてより高度な Forex モードが搭載されています。 主な特徴 Binary と Forex の両方に対応。 MIR Dashboard による素早い市場分析。 Miraculous Confirmation Dashboard によるエントリー確認。 Forex 分析用の GANN Law drawing lines。 Square of 9 のライン、レベル、方向表示。 1x1 GANN Angle によるトレンド圧力の確認。 Entry I
All in One package includes the  Oscillator Predictor ,  MACD Predictor ,  Thrust Scanner  and  Advanced Fibonacci  indicators which are mandatory for applying  Dinapoli  trade plans.  Please visit below links for detailed explanations of indicators. Advanced Fibonacci Indicator =>  https://www.mql5.com/en/market/product/52834 Thrust Scanner Indicator => https://www.mql5.com/en/market/product/52830 Overbought /Oversold Predictor indicator => https://www.mql5.com/en/market/product/52621 Macd P
BTMM State Engine Pro by G-Labs — Beat The Market Maker indicator for MetaTrader 4. Asian session range, London and New York kill zones, level progression (L1/L2/L3), peak formation detection (PFH/PFL), entry signals, and a multi-pair scanner from one chart. Stop scanning charts one pair at a time. The State Engine tracks the BTMM daily cycle automatically — Asian box, room boundaries, level blocks, peak formations, and filtered entries — while the scanner dashboard shows level, peak status,
KURAMA GOLD SIGNAL PRO MT4版 ゴールドのサインに、目で見えるトレード計画を。 ゴールドのサインが出た。利確はどこか。損切りはどこか。エントリー前に何を確認すべきか。 自動注文を使いたい方へ:MT5用EA版もあります Gold Signal Pro EA with Auto TP SLは、Gold Signal Proエンジンにサイン選別、自動注文、自動TP/SLとリスク設定を組み合わせた別売りのMT5用EAです。GOLDのM5・M15向け。サイン確認だけの使い方と自動注文を選べます。EAは単独で動作し、このインジケーターの購入には含まれません。MT4では動作しません。 EA版の機能・画面・価格を見る KURAMA GOLD SIGNAL PROは、その判断材料をチャートに集約します。XAUUSDのM5、M15向けに、売買サイン、自動計算TP/SL、3段階のサイン評価、注意すべき相場条件を知らせるMARKETパネルを搭載。 セットアップ、決済目安、相場の注意点を一か所で確認。情報を集める手間を減らし、トレードの判断に集中できます。 買い切り購入者限定特典 AI
ゴールドラッシュ・トレンド・アロー・シグナル ゴールドラッシュ・トレンド・アロー・シグナル 指標は、XAU/USDにおける高速・短期スキャルパー向けに最適化された、正確でリアルタイムのトレンド分析を提供します。 1分足専用に設計されたこのツールは、明確なエントリーポイントを示す方向矢印を表示し、スキャルパーが変動の激しい市場状況でも自信を持って取引できるよう支援します。 この指標は、PRIMARY(主要)とSECONDARY(補助)のアラート矢印で構成されています。PRIMARYシグナルは、トレンドの方向転換を示す白と黒の方向矢印であり、SECONDARYシグナルは、PRIMARY矢印が示す方向を確認し、潜在的なエントリーポイントを示す青と赤の矢印です。 注意:トレンド方向の変化後にPRIMARYアラート矢印が1つだけ表示される場合、複数のSECONDARY青/赤矢印が表示される点に注意が必要です。SECONDARYシグナルは、シグナル基準を満たす任意のローソク足後に表示されます。したがって、長期的なトレンド移動の場合、画面に多くのSECONDARY矢印が表示されます(添付の
JSL Orderflow Footprint turns every candle into a price ladder that shows how much volume traded on the bid and on the ask at each price level. It highlights diagonal imbalances, stacked imbalance zones, absorption at candle extremes, cumulative delta (CVD), delta divergence and the daily session volume profile, then combines five of these order-flow conditions into a 0–100 confluence score. A signal is only issued on bar close when the score is high, clearly one-sided and confirmed by the candl
Dynamic Forex28 Navigator - 次世代の Forex 取引ツール。 現在 49% オフ。 Dynamic Forex28 Navigator は、長年人気のインジケーターを進化させたもので、3 つの機能を 1 つにまとめています。 Advanced Currency Strength28 インジケーター (レビュー 695 件)  + Advanced Currency IMPULSE with ALERT (レビュー 520 件) + CS28 コンボ シグナル (ボーナス)。 インジケーターの詳細 https://www.mql5.com/en/blogs/post/758844 次世代の Strength インジケーターが提供するもの  オリジナルで気に入っていたすべての機能が、新機能と精度の向上によって強化されました。 主な機能: 独自の通貨強度計算式。 すべての時間枠でスムーズかつ正確な強度ライン。 トレンドの特定と正確なエントリーに最適です。 ダイナミックマーケットフィボナッチレベル (マーケットフィボナッチ)。 このインジケーターに固有
Presenting one-of-a-kind Gann Indicator for XAUUSD IQ Gold Gann Levels is a non-repainting, precision tool designed exclusively for XAUUSD intraday trading. It uses W.D. Gann’s square root method to plot real-time support and resistance levels, helping traders spot high-probability entries with confidence and clarity. William Delbert Gann (W.D. Gann) was an exceptional market analyst whose trading technique was based on a complex blend of mathematics, geometry, astrology, and ancient calculation
OrderFlow Absorption – MT4用プロフェッショナル・デルタ&アブソープションシグナルインジケーター OrderFlow Absorptionで本物のオーダーフロー分析の力を解き放ちましょう。MetaTrader 4向けの究極のデルタヒストグラム&アブソープションシグナルインジケーターです。あらゆる価格変動の裏側で何が起きているのかを知りたいトレーダーのために設計されており、市場を動かす隠れた買い/売り圧力や吸収イベントを明らかにします。 特徴 デルタヒストグラムの可視化:   買い圧力・売り圧力を色分けされたヒストグラムで即座に表示。 アブソープションシグナル検出:   高度なロジックで強気・弱気の吸収イベントを特定し、反転の兆しを早期に通知。 チャートマーカー:   吸収シグナルをチャート上に直接マークし、視覚的に分かりやすく表示。 ポップアップアラート:   新しい吸収シグナルが出現した際にリアルタイムで通知。 カスタマイズ可能な閾値:   弱いシグナルを除外し、高確率のセットアップに集中。 リソース管理:   大きなチャートでも高速に動作する効率的な計算。
プレシジョン・インデックス・オシレーター(Pi-Osc)は、Precision Trading SystemsのRoger Medcalfによるものです。 バージョン2は、チャートにスーパーファストでロードされるように注意深く再コードされ、その他の技術的な改良も組み込まれて、エクスペリエンスを向上させています。 Pi-Oscは、市場が強制的に行かなければならない、すべての人のストップを取り除くためのポイントである、極限のエクソースト・ポイントを見つけるために設計された正確な取引タイミング信号を提供するために作成されました。 この製品は、極限のポイントがどこにあるかを知るという古代の問題を解決し、トレーダーの生活をはるかにシンプルにします。 これは、業界標準のオシレーターとは異なる強力な要素を持つ高度なコンセンサス・インジケーターです。 使用されている一部の機能には、需要指数、マネーフロー、RSI、スティリング、パターン認識、出来高分析、標準偏差の極値などがあり、異なる長さでこれらのバリエーションが多く含まれています。 初めて見ると、訓練されていない目には、他のオシレーター
Beast Super Signal
Florian Zuercher
4.73 (90)
収益性の高い取引機会を簡単に特定するのに役立つ強力な外国為替取引インジケーターをお探しですか?ビースト スーパー シグナル以外に探す必要はありません。 この使いやすいトレンドベースのインジケーターは、市場の状況を継続的に監視し、新しいトレンドを検索したり、既存のトレンドに飛びついたりします。ビースト スーパー シグナルは、すべての内部戦略が一致し、互いに 100% 合流したときに売買シグナルを発するため、追加の確認は不要です。シグナル矢印アラートを受け取ったら、単に売買します。 購入後、プライベート VIP グループに追加されるようにメッセージを送ってください! (完全な製品購入のみ)。 購入後、最新の最適化されたセット ファイルについてメッセージを送ってください。 MT5バージョンは こちらから入手できます。 Beast Super Signal EA は こちらから 入手できます。 コメント セクションをチェックして、最新の結果を確認してください。 ビースト スーパー シグナルは、1:1、1:2、または 1:3 のリスクと報酬の比率に基づいて、エントリー価格、ストッ
ORB Seeker
Marcela Goncalves De Oliveira
4 (1)
数量限定で特別価格!希少性を維持するための特別価格です! たったの599ドル! ご購入後、ボーナスとしてORB Seeker EAと個人最適化セットファイルをお受け取りいただくため、私にご連絡ください。 クリーンなセッションブレイクアウトを自信を持ってキャッチしましょう! ORB Seekerは、正確性、シンプルさ、柔軟性、そして明確なチャート構造を求めるトレーダー向けに開発された、プロ仕様のオープニングレンジブレイクアウト(ORB)インジケーターです。 このシステムは、あらゆる銘柄のプレマーケットまたはカスタムセッションのレンジを自動的にプロットし、エントリー、ストップロス、テイクプロフィット、およびオプションの50%部分TPレベルを含む明確なブレイクアウトシグナルを提供します。すべての計算結果はリアルタイムでチャート上に表示されます。 ロンドン市場オープン、ニューヨーク市場セッション、アジア市場セッション、または独自のカスタム市場時間帯で取引できます。ORB Seekerは選択したセッション時間帯に合わせて調整されるため、市場レンジ、ブレイクアウトレベル、トレードレベルの位置を
Introduction Excessive Momentum Indicator is the momentum indicator to measure the excessive momentum directly from raw price series. Hence, this is an extended price action and pattern trading. Excessive Momentum Indicator was originally developed by Young Ho Seo. This indicator demonstrates the concept of Equilibrium Fractal Wave and Practical Application at the same time. Excessive Momentum detects the market anomaly. Excessive momentum will give us a lot of clue about potential reversal and
Elliott Wave Trend was designed for the scientific wave counting. This tool focuses to get rid of the vagueness of the classic Elliott Wave Counting using the guideline from the template and pattern approach. In doing so, firstly Elliott Wave Trend offers the template for your wave counting. Secondly, it offers Wave Structural Score to assist to identify accurate wave formation. It offers both impulse wave Structural Score and corrective wave Structure Score. Structural Score is the rating to sh
Owl smart levels
Sergey Ermolov
4.26 (38)
トレンドに沿ってトレードする際の主な難しさは、レベルを見つけることではなく、どこが実際に有効なエントリーポイントなのかを理解することにあります。 価格はしばしばレベルに反応しますが、動きが継続しないことが多く、その結果、誤ったエントリーや機会損失につながります。 Owl Smart Levels は単にレベルを表示するだけではなく 、市場構造とプルバックに基づいてゾーンを形成します。これにより、エントリーポイントを異なる視点で評価でき、一部の誤シグナルを回避できます。 Owl Smart Levels システムに含まれるもの Owl Smart Levels は単なるレベルの表示ではなく、各要素が連携する 完全なトレードモデル です。 内容は以下の通りです: Owl Smart Levels(インジケーター) トレンド方向、プルバックゾーン、事前定義されたエントリー・StopLoss・TakeProfitレベルを表示 システムガイド 実際のトレードでのシグナルの扱い方を解説:どの状況を考慮し、どれを回避し、どのようにトレードを管理するか トレード判断チェックリスト シグナルを迅
Congestioni
Stefano Frisetti
5 (1)
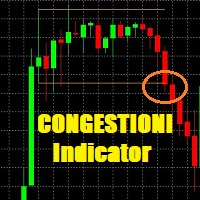
This indicator is very usefull to TRADE Trading Ranges and helps identify the following TREND. Every Trader knows that any market stay 80% of the time in trading ranges and only 20% of the time in TREND; this indicator has been built to help traders trade trading ranges. Now instead of waiting for the next TREND, You can SWING TRADE on trading ranges with this simple yet very effective indicator. TRADING with CONGESTIONI INDICATOR: The CONGESTIONI Indicator identify a new trading range and ale
I have been trading for some time now and always find it a difficulty remembering the timing of the various market opening hours at the other part of the world (especially, when it comes to daylight saving), but could not find any decent indicator online that could help. And it is for this reason that gives birth to this indicator, which I have spent much time, effort and thinking. As many already know that opening of a certain marketplace, depending on which currency pair, has an impact on the
Introduction to Fractal Pattern Scanner Fractal Indicator refers to the technical indicator that makes use of the fractal geometry found in the financial market. Fractal Pattern Scanner is the advanced Fractal Indicator that brings the latest trading technology after the extensive research and development work in the fractal geometry in the financial market. The most important feature in Fractal Pattern Scanner is the ability to measure the turning point probability as well as the trend probabi
IQ FX Gann Levels a precision trading indicator based on W.D. Gann’s square root methods . It plots real-time, non-repainting support and resistance levels to help traders confidently spot intraday and scalping opportunities with high accuracy. William Delbert Gann (W.D. Gann) was an exceptional market analyst, whose trading technique was based on a complex blend of mathematics, geometry, astrology, and ancient mathematics which proved to be extremely accurate. We don't offer free or bonus indic
Smart Market Structure Pro by G-Labs — ICT and Smart Money Concepts toolkit with built-in multi-symbol scanner for MetaTrader 5. Break of structure, change of character, order blocks, fair value gaps, liquidity sweeps, premium and discount zones, ICT sessions, confluence scoring, AI trade ideas, and a traffic-light scanner across up to 30 pairs and four timeframes from one chart. Map SMC and ICT on the active chart while the built-in scanner monitors your full watchlist. Each cell shows BUY, SE
TPA True Price Action indicator reveals the true price action of the market makers through 100% non-repainting signals (except early signals mode) strictly at the close of a candle! TPA shows entries and re-entries, every time the bulls are definitely stronger than the bears and vice versa. Not to confuse with red/green candles. The shift of power gets confirmed at the earliest stage and is ONE exit strategy of several. There are available now two free parts of the TPA User Guide for our custom
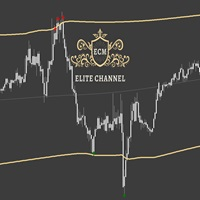
ECM Elite Channel is a volatility-based indicator, developed with a specific time algorithm, which consists of finding possible corrections in the market. This indicator shows two outer lines, an inner line (retracement line) and an arrow sign, where the channel theory is to help identify overbought and oversold conditions in the market. The market price will generally fall between the boundaries of the channel. If prices touch or move outside the channel, it's a trading opportunity. The ind
Titan Z-Score Pro v3.2 Sürüm Notları: Kurumsal UI/UX Yeniden Tasarımı: Performans kokpitleri ve MTF matrisleri ana harita köşelerine taşındı, böylece tertemiz, dağınıklıktan arındırılmış bir alt pencere görünümü sağlandı. Canlı Kazanma Oranı ve Geri Dönüş Kokpiti: Ortalama geri dönüş başarı oranının ve kazanılan ortalama piplerin gerçek zamanlı takibi eklendi. Çok Zaman Dilimi Z-Puan Matrisi: Ana tabloya doğrudan görsel olarak 5 zaman dilimli (M5'ten D1'e) bir durum ızgarası entegre edildi. Yeni
作者のその他のプロダクト
Like the logic of this tool? Explore the full ecosystem of professional indicators and utilities, built by a trader for traders: All author's products in MQL5 Market: https://www.mql5.com/en/users/musa1994/seller Trading philosophy and details: https://developer-mql4-mql5.netlify.app/ Liquidity + Volume Pro is a professional MetaTrader 4 indicator that combines liquidity and volume analysis into one system. Detects level sweeps, filters by volume, scores signal strength, and builds Supp
️ This is a FREE version of the tool. Developed by a practicing trader with 12 years of live trading experience (verified tax records, 51 Finam certificates). Looking for professional trading solutions (Volume Profile, SMC, Risk Manager)? Author's full lineup of PRO indicators: https://www.mql5.com/en/users/musa1994/seller Official website and portfolio: https://developer-mql4-mql5.netlify.app/ VolumeAnalysis is a professional library designed to integrate advanced volume analysis into y
FREE
️ This is a FREE version of the tool. Developed by a practicing trader with 12 years of live trading experience (verified tax records, 51 Finam certificates). Looking for professional trading solutions (Volume Profile, SMC, Risk Manager)? Author's full lineup of PRO indicators: https://www.mql5.com/en/users/musa1994/seller Official website and portfolio: https://developer-mql4-mql5.netlify.app/ MA Crossover EA - advisor at the intersection of moving averages The advisor opens trades when
FREE
️ This is a FREE version of the tool. Developed by a practicing trader with 12 years of live trading experience (verified tax records, 51 Finam certificates). Looking for professional trading solutions (Volume Profile, SMC, Risk Manager)? Author's full lineup of PRO indicators: https://www.mql5.com/en/users/musa1994/seller Official website and portfolio: https://developer-mql4-mql5.netlify.app/ RoundLevelss — Psychological Round Levels with Auto-Adaptive Step for MetaTrader 4 Round price
FREE
️ This is a FREE version of the tool. Developed by a practicing trader with 12 years of live trading experience (verified tax records, 51 Finam certificates). Looking for professional trading solutions (Volume Profile, SMC, Risk Manager)? Author's full lineup of PRO indicators: https://www.mql5.com/en/users/musa1994/seller Official website and portfolio: https://developer-mql4-mql5.netlify.app/ RoundLevelsX — Psychological Round Levels with Auto-Adaptive Step for MetaTrader 5 Round price
FREE
️ This is a FREE version of the tool. Developed by a practicing trader with 12 years of live trading experience (verified tax records, 51 Finam certificates). Looking for professional trading solutions (Volume Profile, SMC, Risk Manager)? Author's full lineup of PRO indicators: https://www.mql5.com/en/users/musa1994/seller Official website and portfolio: https://developer-mql4-mql5.netlify.app/ VolumeMonitorUtility is a service utility for the MetaTrader 5 terminal that displays key volum
FREE
️ This is a FREE version of the tool. Developed by a practicing trader with 12 years of live trading experience (verified tax records, 51 Finam certificates). Looking for professional trading solutions (Volume Profile, SMC, Risk Manager)? Author's full lineup of PRO indicators: https://www.mql5.com/en/users/musa1994/seller Official website and portfolio: https://developer-mql4-mql5.netlify.app/ Retail Sentiment MT4 Retail Sentiment is a professional information indicator for MetaTrader 4
FREE
️ This is a FREE version of the tool. Developed by a practicing trader with 12 years of live trading experience (verified tax records, 51 Finam certificates). Looking for professional trading solutions (Volume Profile, SMC, Risk Manager)? Author's full lineup of PRO indicators: https://www.mql5.com/en/users/musa1994/seller Official website and portfolio: https://developer-mql4-mql5.netlify.app/ Relative Volume — Relative Volume Indicator This indicator displays current volume as a perce
FREE
️ This is a FREE version of the tool. Developed by a practicing trader with 12 years of live trading experience (verified tax records, 51 Finam certificates). Looking for professional trading solutions (Volume Profile, SMC, Risk Manager)? Author's full lineup of PRO indicators: https://www.mql5.com/en/users/musa1994/seller Official website and portfolio: https://developer-mql4-mql5.netlify.app/ Retail Sentiment MT5 Retail Sentiment is a professional information indicator for MetaTrader 5
FREE
️ This is a FREE version of the tool. Developed by a practicing trader with 12 years of live trading experience (verified tax records, 51 Finam certificates). Looking for professional trading solutions (Volume Profile, SMC, Risk Manager)? Author's full lineup of PRO indicators: https://www.mql5.com/en/users/musa1994/seller Official website and portfolio: https://developer-mql4-mql5.netlify.app/ SpreadMonitor is a professional MetaTrader 5 indicator that colorizes candles by spread level a
FREE
️ This is a FREE version of the tool. Developed by a practicing trader with 12 years of live trading experience (verified tax records, 51 Finam certificates). Looking for professional trading solutions (Volume Profile, SMC, Risk Manager)? Author's full lineup of PRO indicators: https://www.mql5.com/en/users/musa1994/seller Official website and portfolio: https://developer-mql4-mql5.netlify.app/ SpreadMonitor is a professional indicator for MetaTrader 4 that color-codes candlesticks based
FREE
Like the logic of this tool? Explore the full ecosystem of professional indicators and utilities, built by a trader for traders: All author's products in MQL5 Market: https://www.mql5.com/en/users/musa1994/seller Trading philosophy and details: https://developer-mql4-mql5.netlify.app/ Professional VolumeProfile is a professional indicator for MetaTrader 4 that builds a volume profile by price directly on the chart: it shows POC (Point of Control), VAH/VAL (boundaries of the value zone)
Like the logic of this tool? Explore the full ecosystem of professional indicators and utilities, built by a trader for traders: All author's products in MQL5 Market: https://www.mql5.com/en/users/musa1994/seller Trading philosophy and details: https://developer-mql4-mql5.netlify.app/ Professional Delta Volume is a professional indicator for MetaTrader 4 and MetaTrader 5 that shows the difference between buy and sell volume (Delta Volume) and cumulative delta. Helps to see who dominates
Like the logic of this tool? Explore the full ecosystem of professional indicators and utilities, built by a trader for traders: All author's products in MQL5 Market: https://www.mql5.com/en/users/musa1994/seller Trading philosophy and details: https://developer-mql4-mql5.netlify.app/ MTF DashboardX MTF DashboardX is a professional scanner panel for MetaTrader 5 that shows market structure state across multiple symbols and timeframes in one window. Automatically detects BOS (Break of St
Like the logic of this tool? Explore the full ecosystem of professional indicators and utilities, built by a trader for traders: All author's products in MQL5 Market: https://www.mql5.com/en/users/musa1994/seller Trading philosophy and details: https://developer-mql4-mql5.netlify.app/ VolatilityProX is a professional indicator for MetaTrader 4 that combines three tools in one: Adaptive Supertrend — adaptive trend line Daily Range — yesterday's High/Low Pivot Points — classic R1, R2, S1,
Like the logic of this tool? Explore the full ecosystem of professional indicators and utilities, built by a trader for traders: All author's products in MQL5 Market: https://www.mql5.com/en/users/musa1994/seller Trading philosophy and details: https://developer-mql4-mql5.netlify.app/ Risk Manager Panel is a professional trading panel for MetaTrader 4 that automatically calculates lot size based on risk and manages trades in one click. No more manual lot calculation — the panel does it
Like the logic of this tool? Explore the full ecosystem of professional indicators and utilities, built by a trader for traders: All author's products in MQL5 Market: https://www.mql5.com/en/users/musa1994/seller Trading philosophy and details: https://developer-mql4-mql5.netlify.app/ Divergence Indicator Pro X is a professional divergence indicator for MetaTrader 4 that automatically detects divergences between price and oscillator right on the chart. Full MT5-version functionality, ad
Like the logic of this tool? Explore the full ecosystem of professional indicators and utilities, built by a trader for traders: All author's products in MQL5 Market: https://www.mql5.com/en/users/musa1994/seller Trading philosophy and details: https://developer-mql4-mql5.netlify.app/ Volume Profile + CVD is a professional volume analysis indicator for MetaTrader 4 that displays volume distribution by price levels and cumulative volume delta. Full MT5-version functionality, adapted for
Like the logic of this tool? Explore the full ecosystem of professional indicators and utilities, built by a trader for traders: All author's products in MQL5 Market: https://www.mql5.com/en/users/musa1994/seller Trading philosophy and details: https://developer-mql4-mql5.netlify.app/ SLTPManager is a professional automatic Stop Loss and Take Profit manager with an interactive panel for MetaTrader 4, which instantly sets protection and profit-taking levels for every new trade. You will
Like the logic of this tool? Explore the full ecosystem of professional indicators and utilities, built by a trader for traders: All author's products in MQL5 Market: https://www.mql5.com/en/users/musa1994/seller Trading philosophy and details: https://developer-mql4-mql5.netlify.app/ A professional Volume Profile indicator for MetaTrader 5. Builds a horizontal histogram of volume distribution by price levels and identifies key zones of institutional interest. Created by a practicing tr
Like the logic of this tool? Explore the full ecosystem of professional indicators and utilities, built by a trader for traders: All author's products in MQL5 Market: https://www.mql5.com/en/users/musa1994/seller Trading philosophy and details: https://developer-mql4-mql5.netlify.app/ Liquidity + Volume Pro is a professional MetaTrader 5 indicator that combines liquidity analysis with volume filtering into a single trading system. It detects sweeps of key levels, filters them by volume,
Like the logic of this tool? Explore the full ecosystem of professional indicators and utilities, built by a trader for traders: All author's products in MQL5 Market: https://www.mql5.com/en/users/musa1994/seller Trading philosophy and details: https://developer-mql4-mql5.netlify.app/ SM Structure is a professional indicator for MetaTrader 5 that automatically identifies market structure using Smart Money Concepts (SMC) and ICT methodology. It detects BOS (Break of Structure), CHoCH (Ch
Like the logic of this tool? Explore the full ecosystem of professional indicators and utilities, built by a trader for traders: All author's products in MQL5 Market: https://www.mql5.com/en/users/musa1994/seller Trading philosophy and details: https://developer-mql4-mql5.netlify.app/ Professional Delta Volume is a professional indicator MetaTrader 5 that shows the difference between buy and sell volume (Delta Volume) and cumulative delta. Helps to see who dominates the market — buyers
Like the logic of this tool? Explore the full ecosystem of professional indicators and utilities, built by a trader for traders: All author's products in MQL5 Market: https://www.mql5.com/en/users/musa1994/seller Trading philosophy and details: https://developer-mql4-mql5.netlify.app/ MTF Dashboard is a professional scanner panel for MetaTrader 5 that shows market structure state across multiple symbols and timeframes in one window. Automatically detects BOS (Break of Structure) and CHo
Like the logic of this tool? Explore the full ecosystem of professional indicators and utilities, built by a trader for traders: All author's products in MQL5 Market: https://www.mql5.com/en/users/musa1994/seller Trading philosophy and details: https://developer-mql4-mql5.netlify.app/ VolatilityPro is a professional indicator for MetaTrader 5 that combines three tools in one: Adaptive Supertrend — adaptive trend line Daily Range — yesterday's High/Low Pivot Points — classic R1, R2, S1,
Like the logic of this tool? Explore the full ecosystem of professional indicators and utilities, built by a trader for traders: All author's products in MQL5 Market: https://www.mql5.com/en/users/musa1994/seller Trading philosophy and details: https://developer-mql4-mql5.netlify.app/ Risk Manager PanelX is a professional trading panel for MetaTrader 5 that automatically calculates lot size based on risk and manages trades in one click. No more manual lot calculation or opening trades t
Like the logic of this tool? Explore the full ecosystem of professional indicators and utilities, built by a trader for traders: All author's products in MQL5 Market: https://www.mql5.com/en/users/musa1994/seller Trading philosophy and details: https://developer-mql4-mql5.netlify.app/ Divergence Indicator Pro is a professional divergence indicator for MetaTrader 5 that automatically detects divergences between price and oscillator right on the chart. No more manual pivot hunting or chec
Like the logic of this tool? Explore the full ecosystem of professional indicators and utilities, built by a trader for traders: All author's products in MQL5 Market: https://www.mql5.com/en/users/musa1994/seller Trading philosophy and details: https://developer-mql4-mql5.netlify.app/ Volume Profile + CVD is a professional volume analysis indicator for MetaTrader 5 that displays volume distribution by price levels and cumulative volume delta. The indicator answers two key trader questio
Like the logic of this tool? Explore the full ecosystem of professional indicators and utilities, built by a trader for traders: All author's products in MQL5 Market: https://www.mql5.com/en/users/musa1994/seller Trading philosophy and details: https://developer-mql4-mql5.netlify.app/ SLTPManager is a professional automatic Stop Loss and Take Profit manager with an interactive panel for MetaTrader 5, which instantly sets protection and profit-taking levels for every new trade. You will
Bressert Cycle Signals Like the logic of this tool? All author's products: https://www.mql5.com/ru/users/musa1994/seller Trading philosophy: https://developer-mql4-mql5.netlify.app/ Bressert Cycle Signals (BCS) is a professional cyclical indicator for MT5, adapting Walter Bressert's methodology. It combines oscillator phase analysis with precise "Setup & Trigger" entry mechanics, displaying signals directly on candlesticks. What the indicator shows Bressert Oscillator (subwindow):
フィルタ:
レビューなし
レビューに返信