Wa Candle Timer MT4
- インディケータ
- バージョン: 3.0
- アップデート済み: 14 4月 2025

Wa Candle Timer MT4 は、次のローソク足が形成されるまでの残り時間を表示する、強力でユーザーフレンドリーなMT4インジケーターです。このツールは、ローソク足のクローズタイミングを把握しやすくし、より良い取引判断を支援します。
🚀 主な機能:
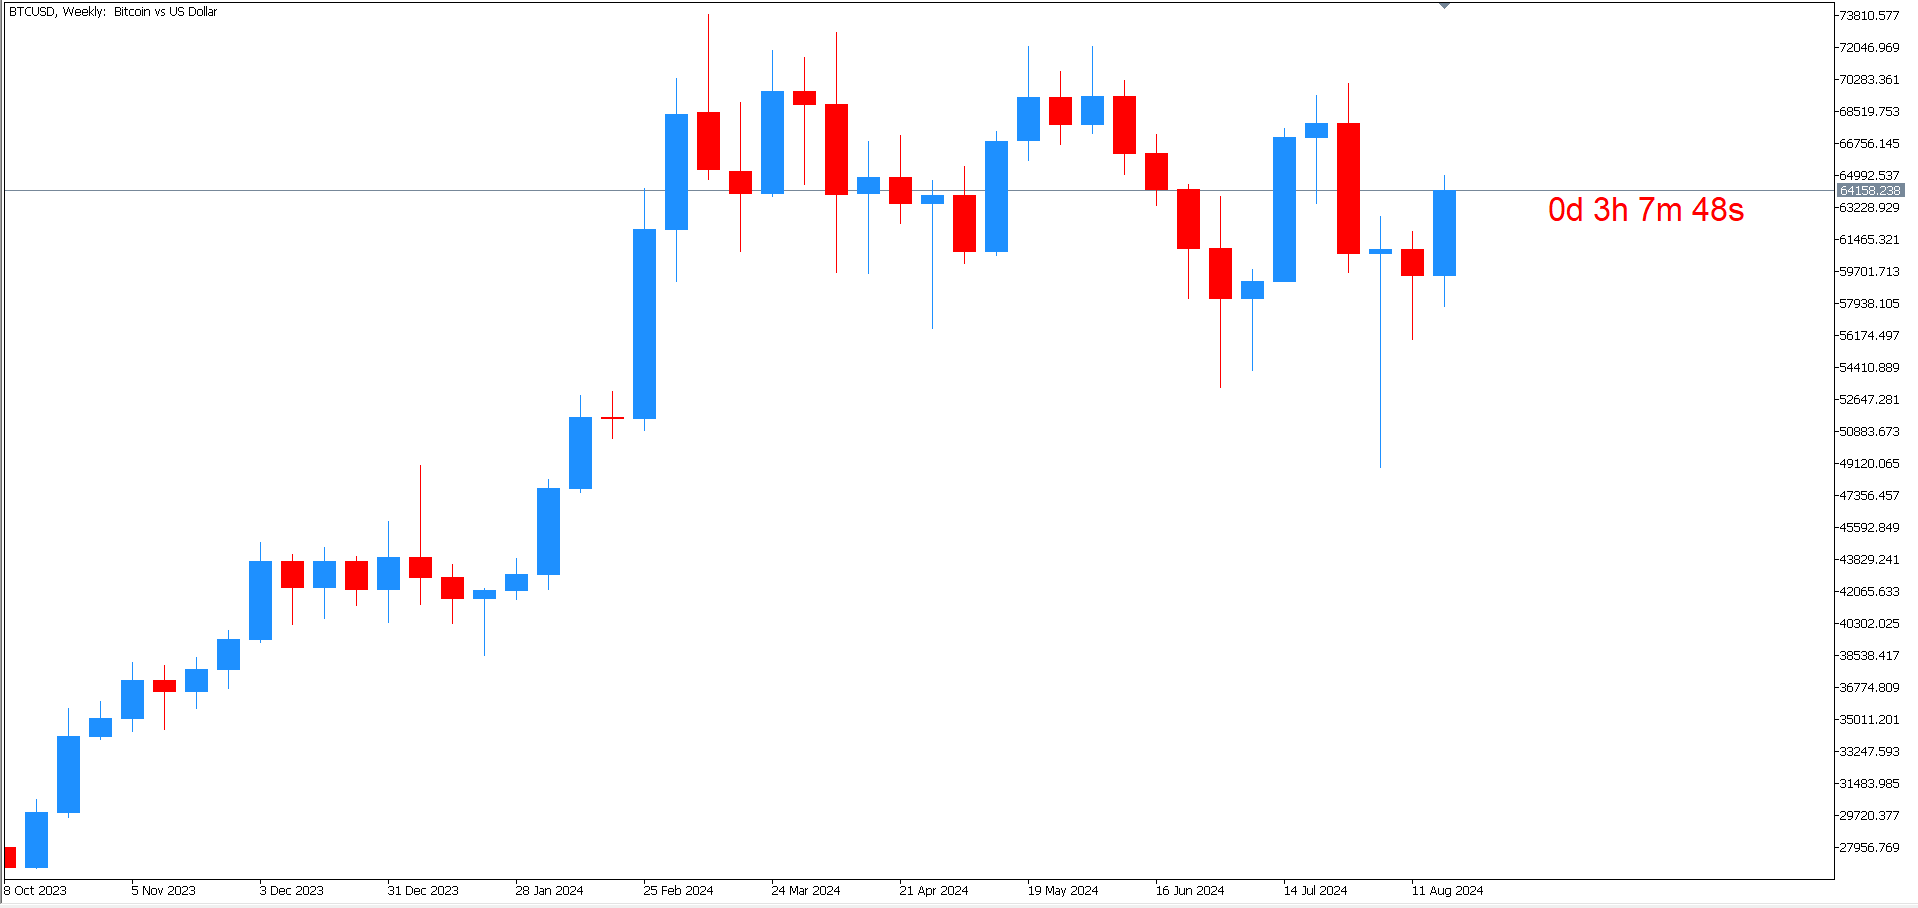
✅ 現在のローソク足のカウントダウンを表示
✅ 残り時間が指定した割合を下回ると色が変化
✅ バージョン3.00の新機能:指定した割合でアラートを出す設定が可能
✅ フォントと色の完全カスタマイズ対応
✅ 時間管理と取引精度の向上に貢献
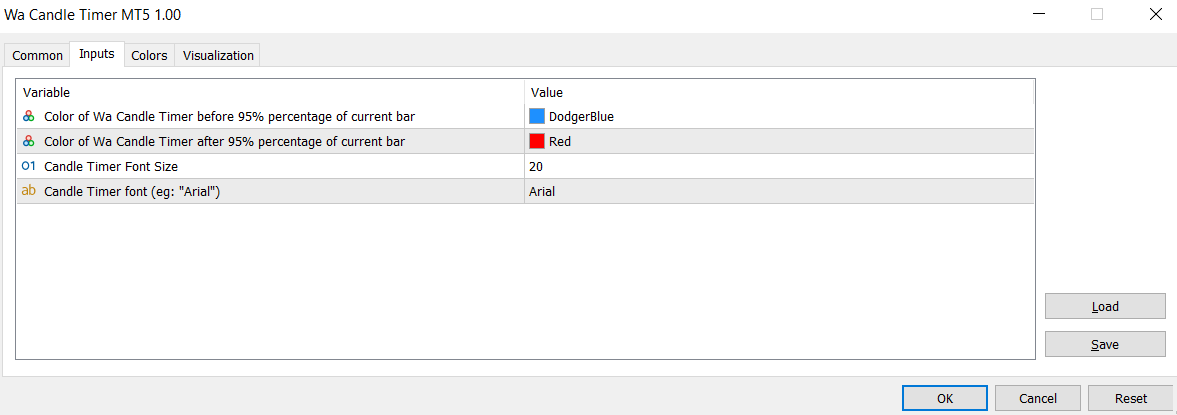
🎨 カスタマイズ可能な設定:
1️⃣ 閾値以上のカラー設定
2️⃣ 閾値以下のカラー設定
3️⃣ フォントサイズ
4️⃣ フォントスタイル
5️⃣ アラート発動の割合(%)

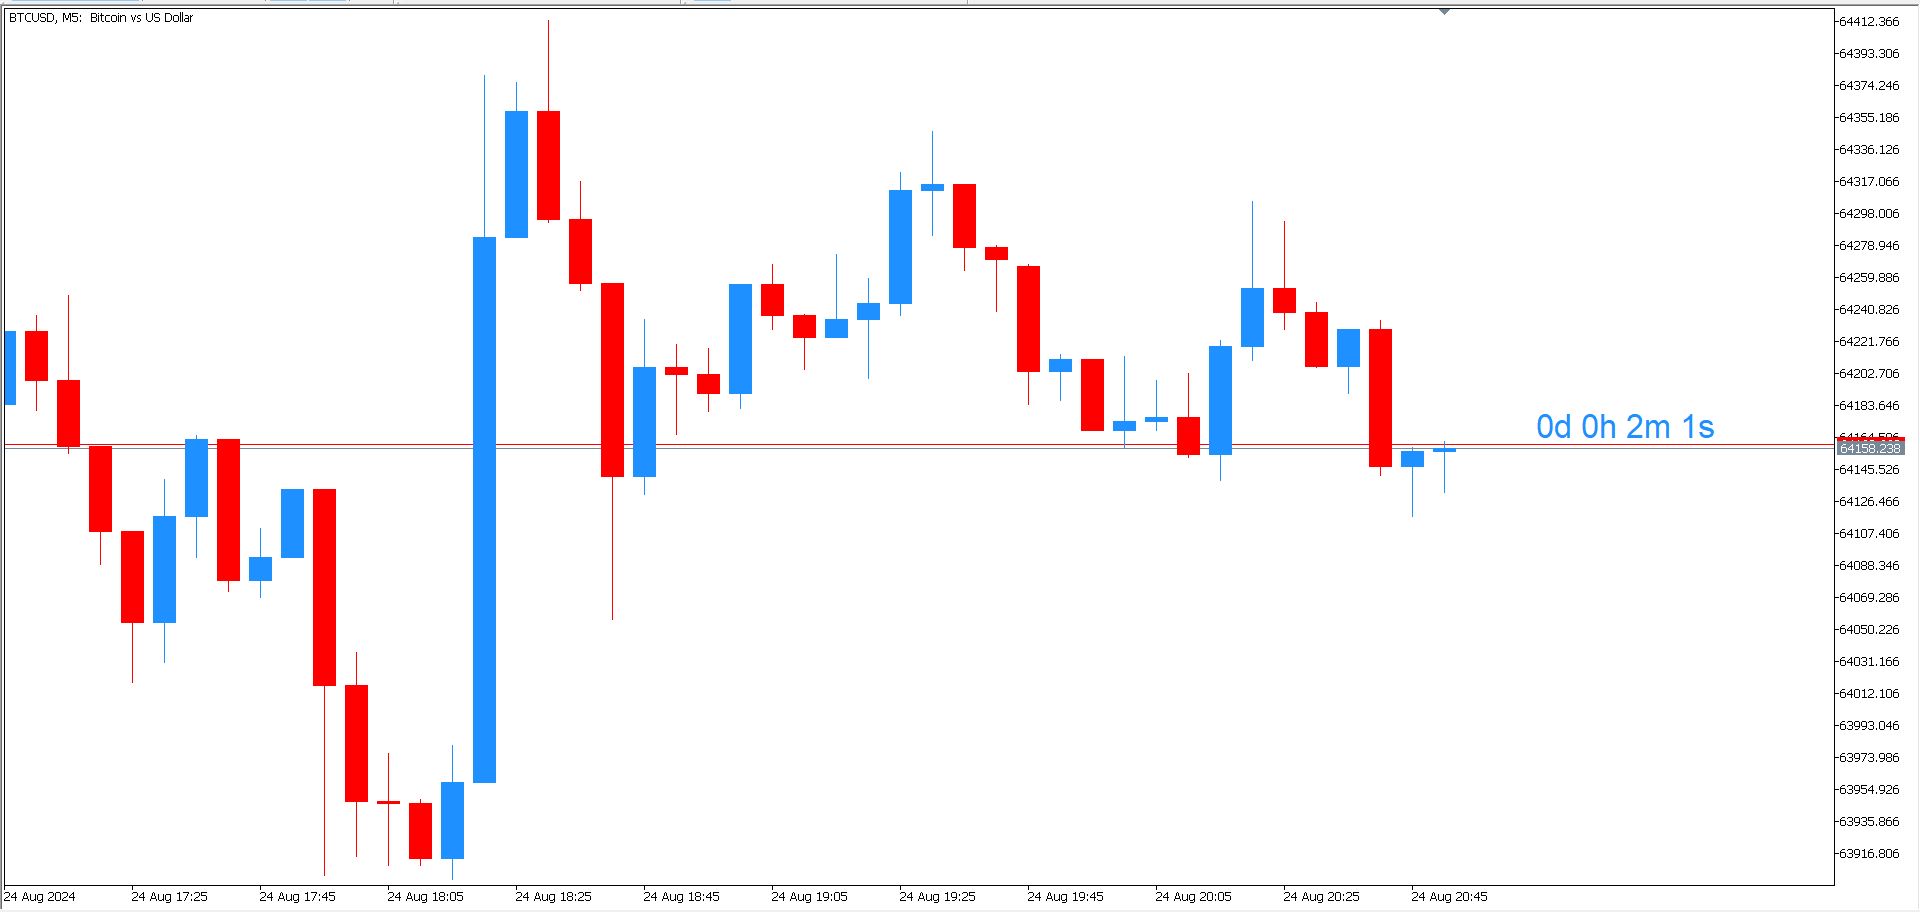

The Candle Timer functions exactly as promised.