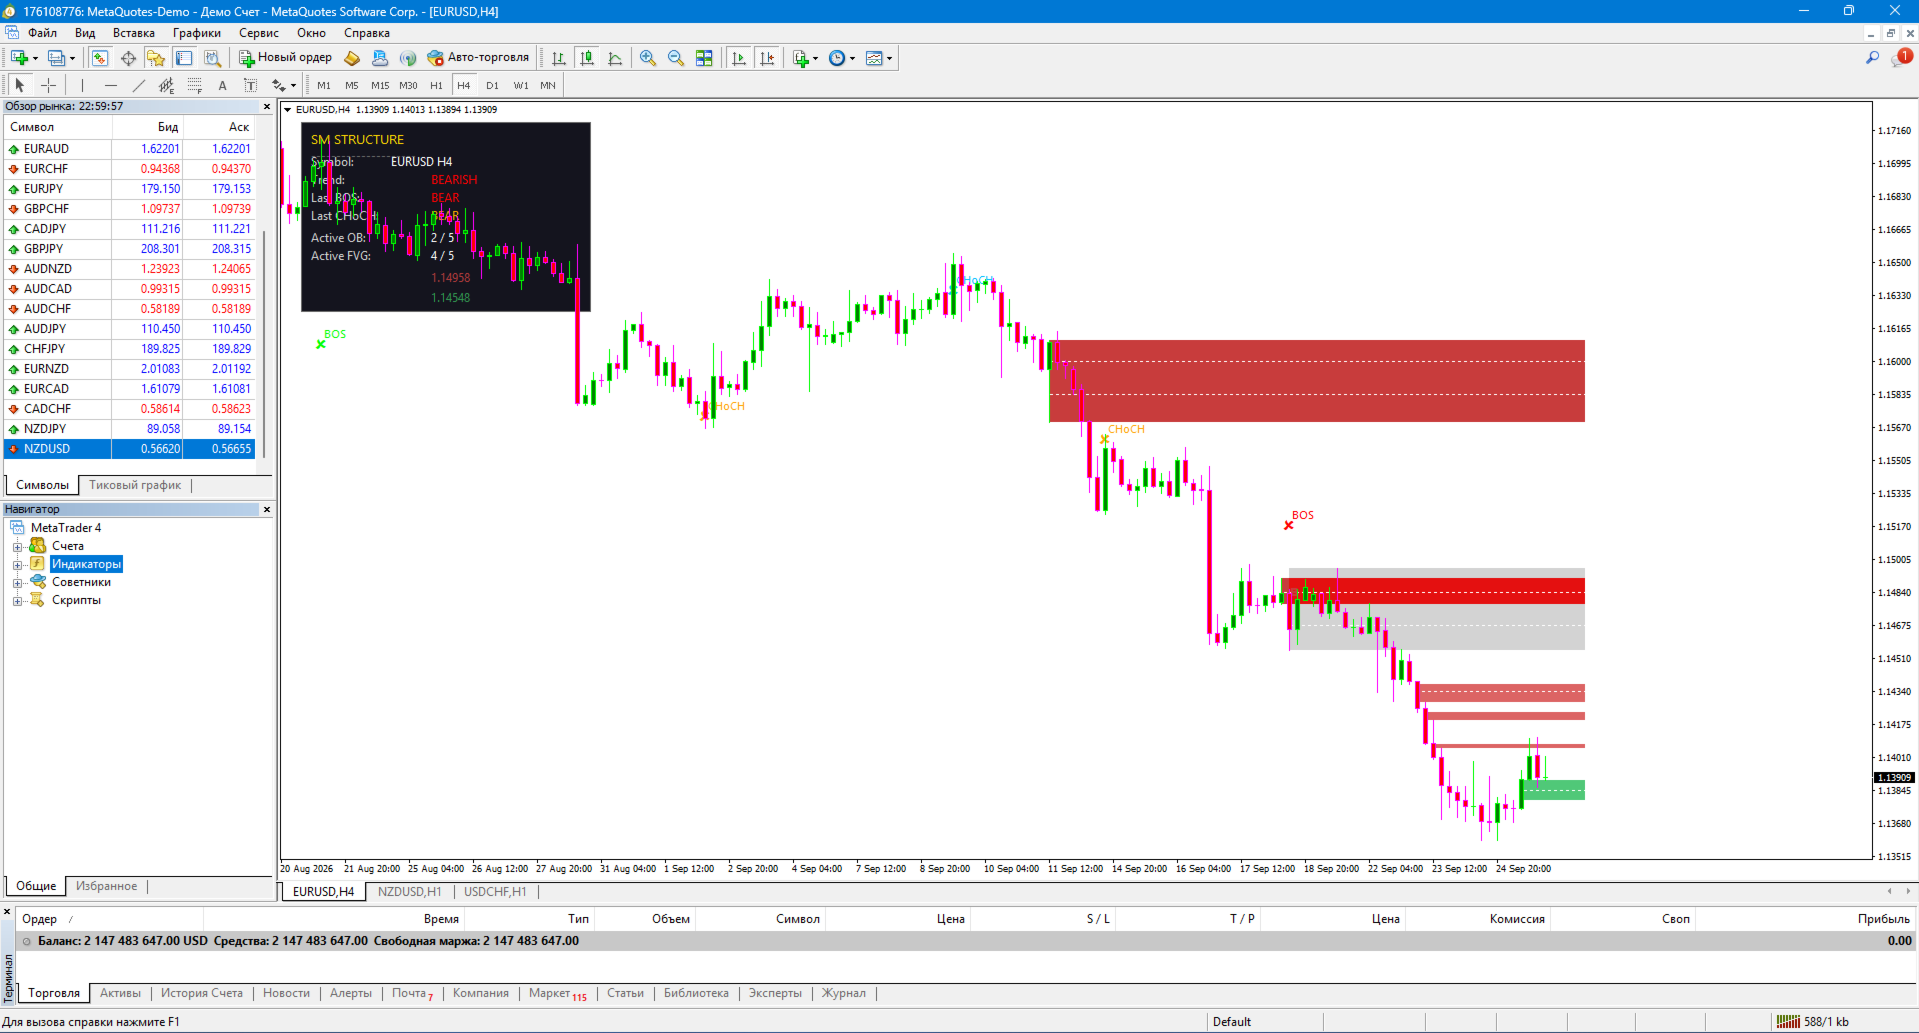
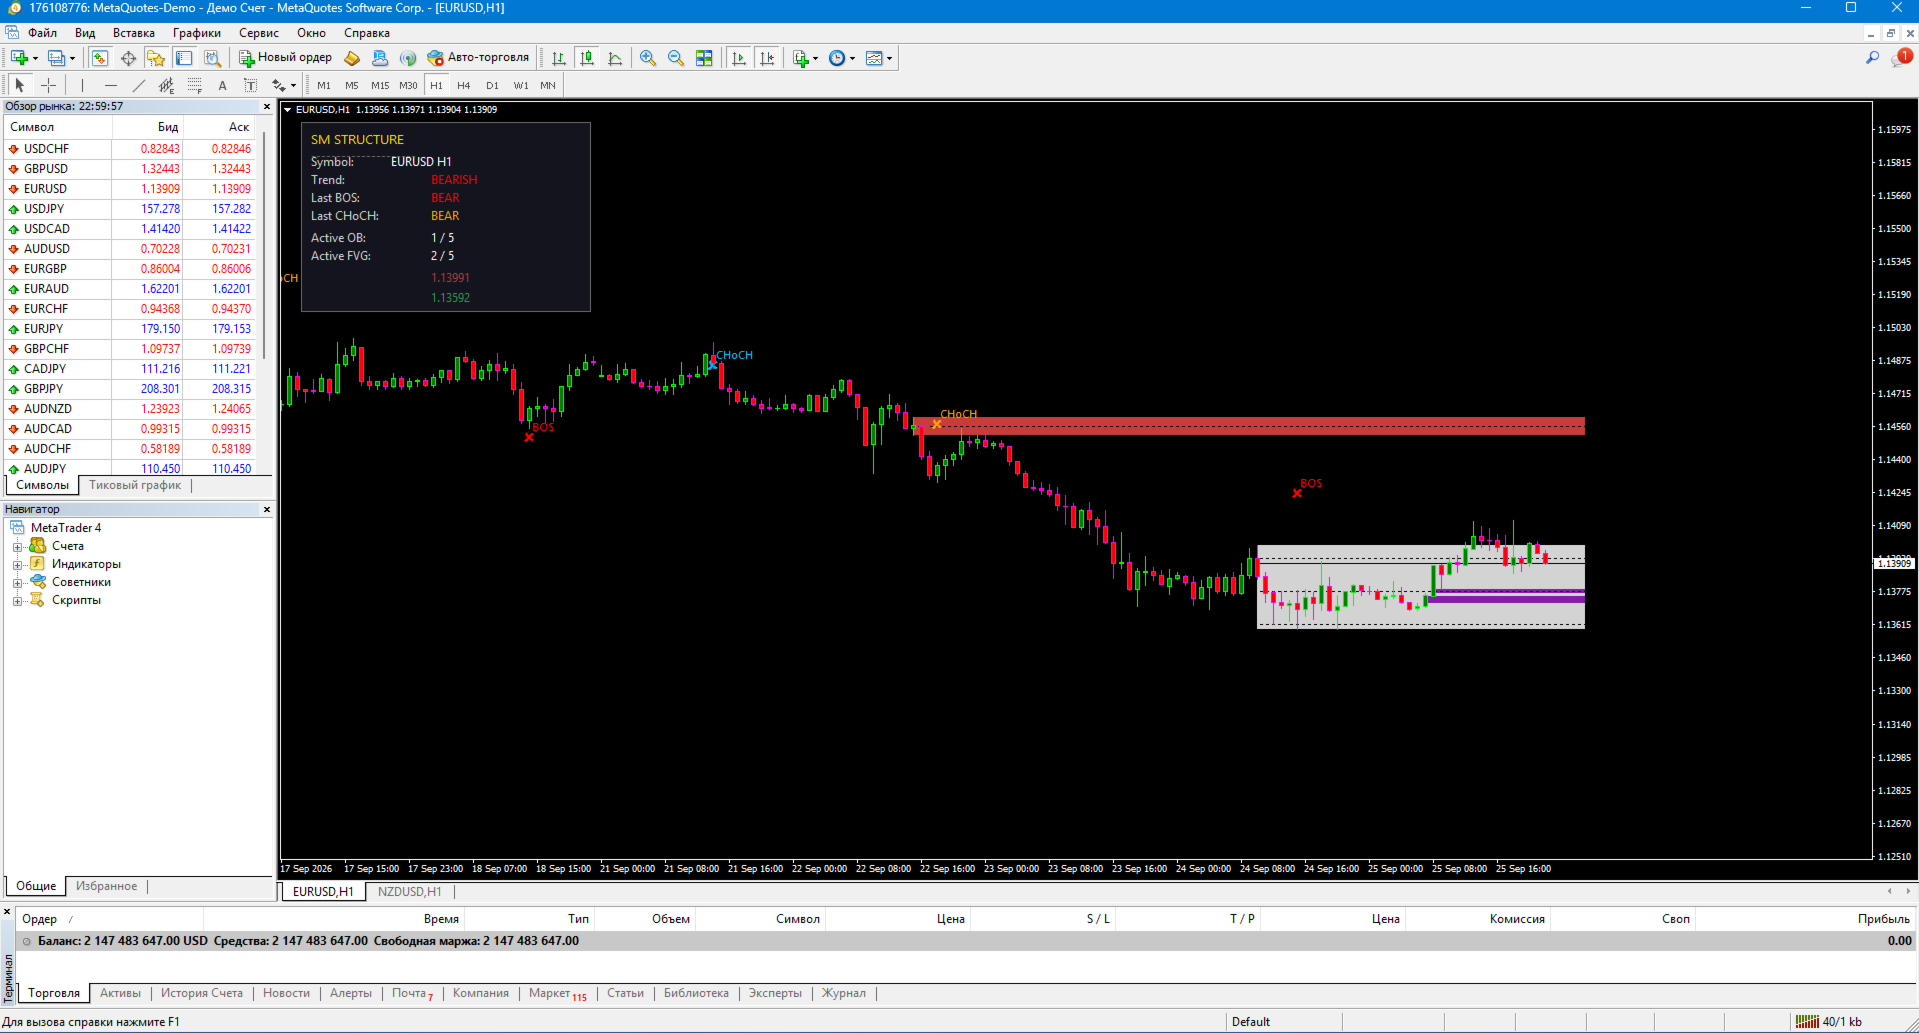
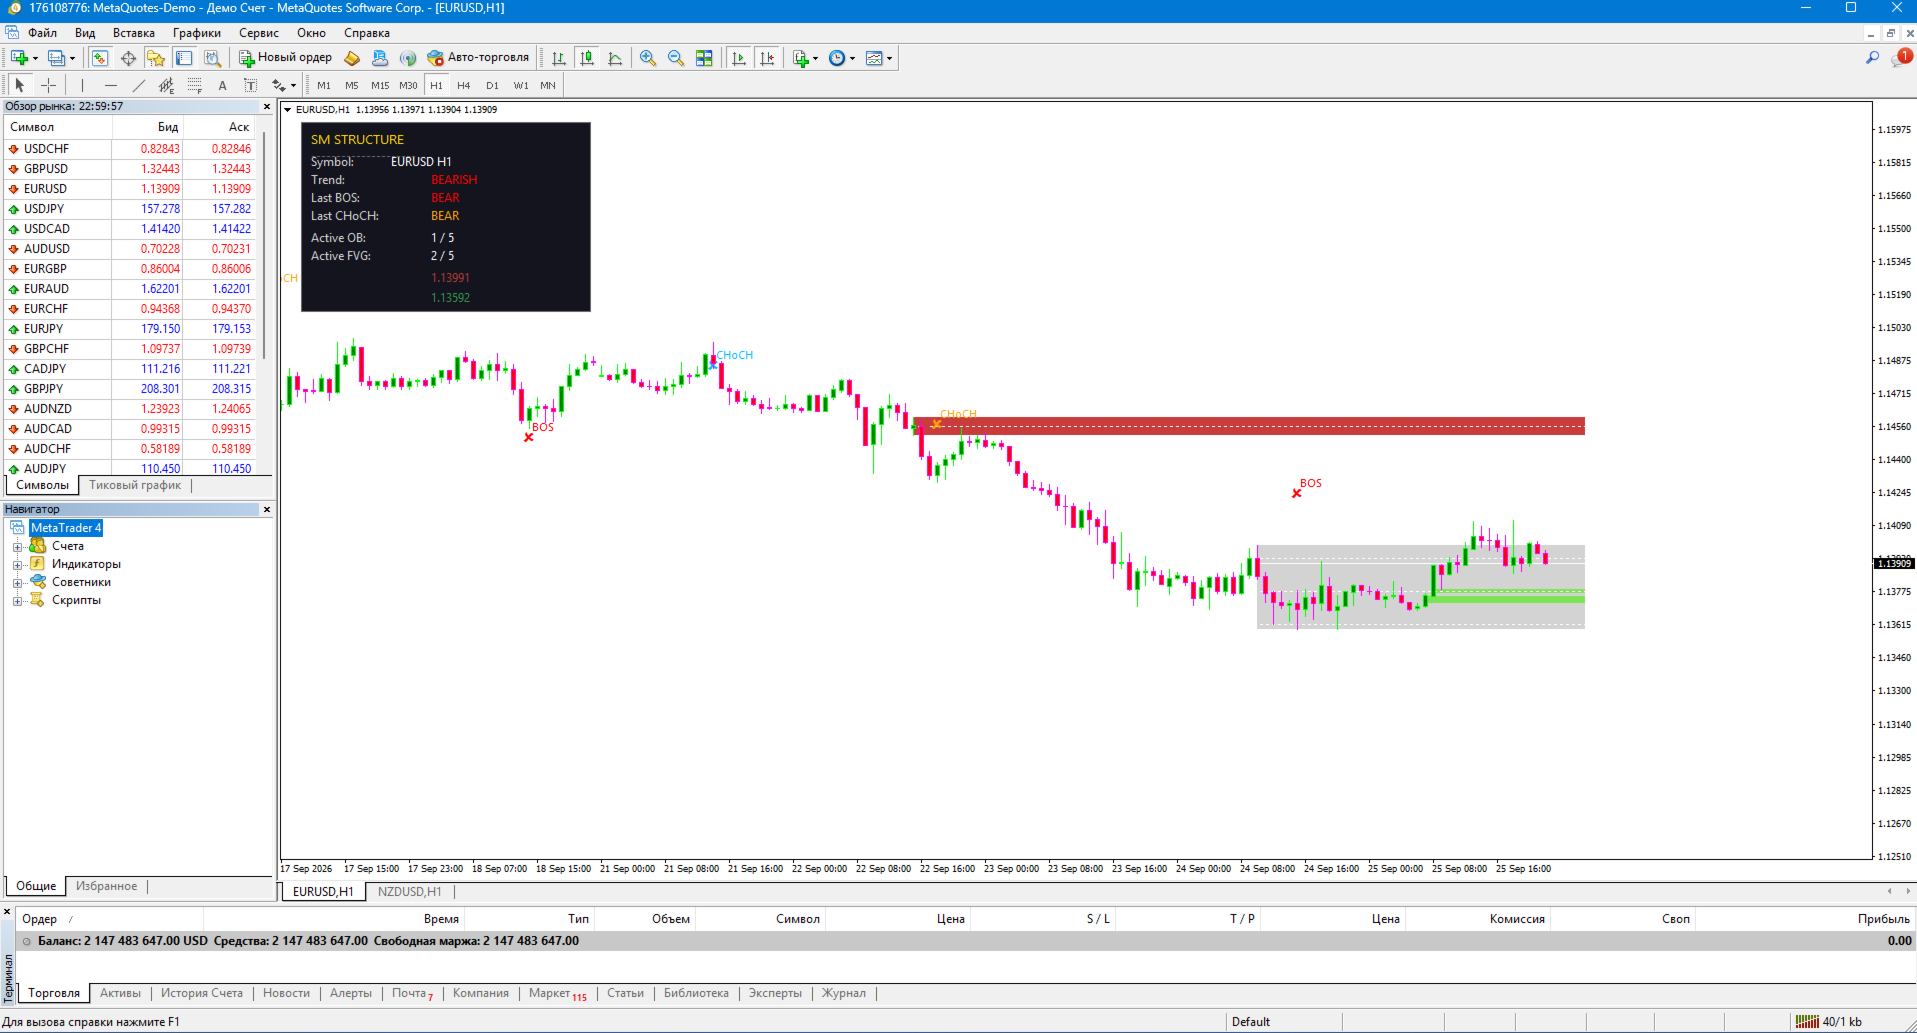
SM Structure PR

💡 Like the logic of this tool?

Explore the full ecosystem of professional indicators and utilities, built by a trader for traders:

👉 All author's products in MQL5 Market: https://www.mql5.com/en/users/musa1994/seller

🌐 Trading philosophy and details: https://developer-mql4-mql5.netlify.app/

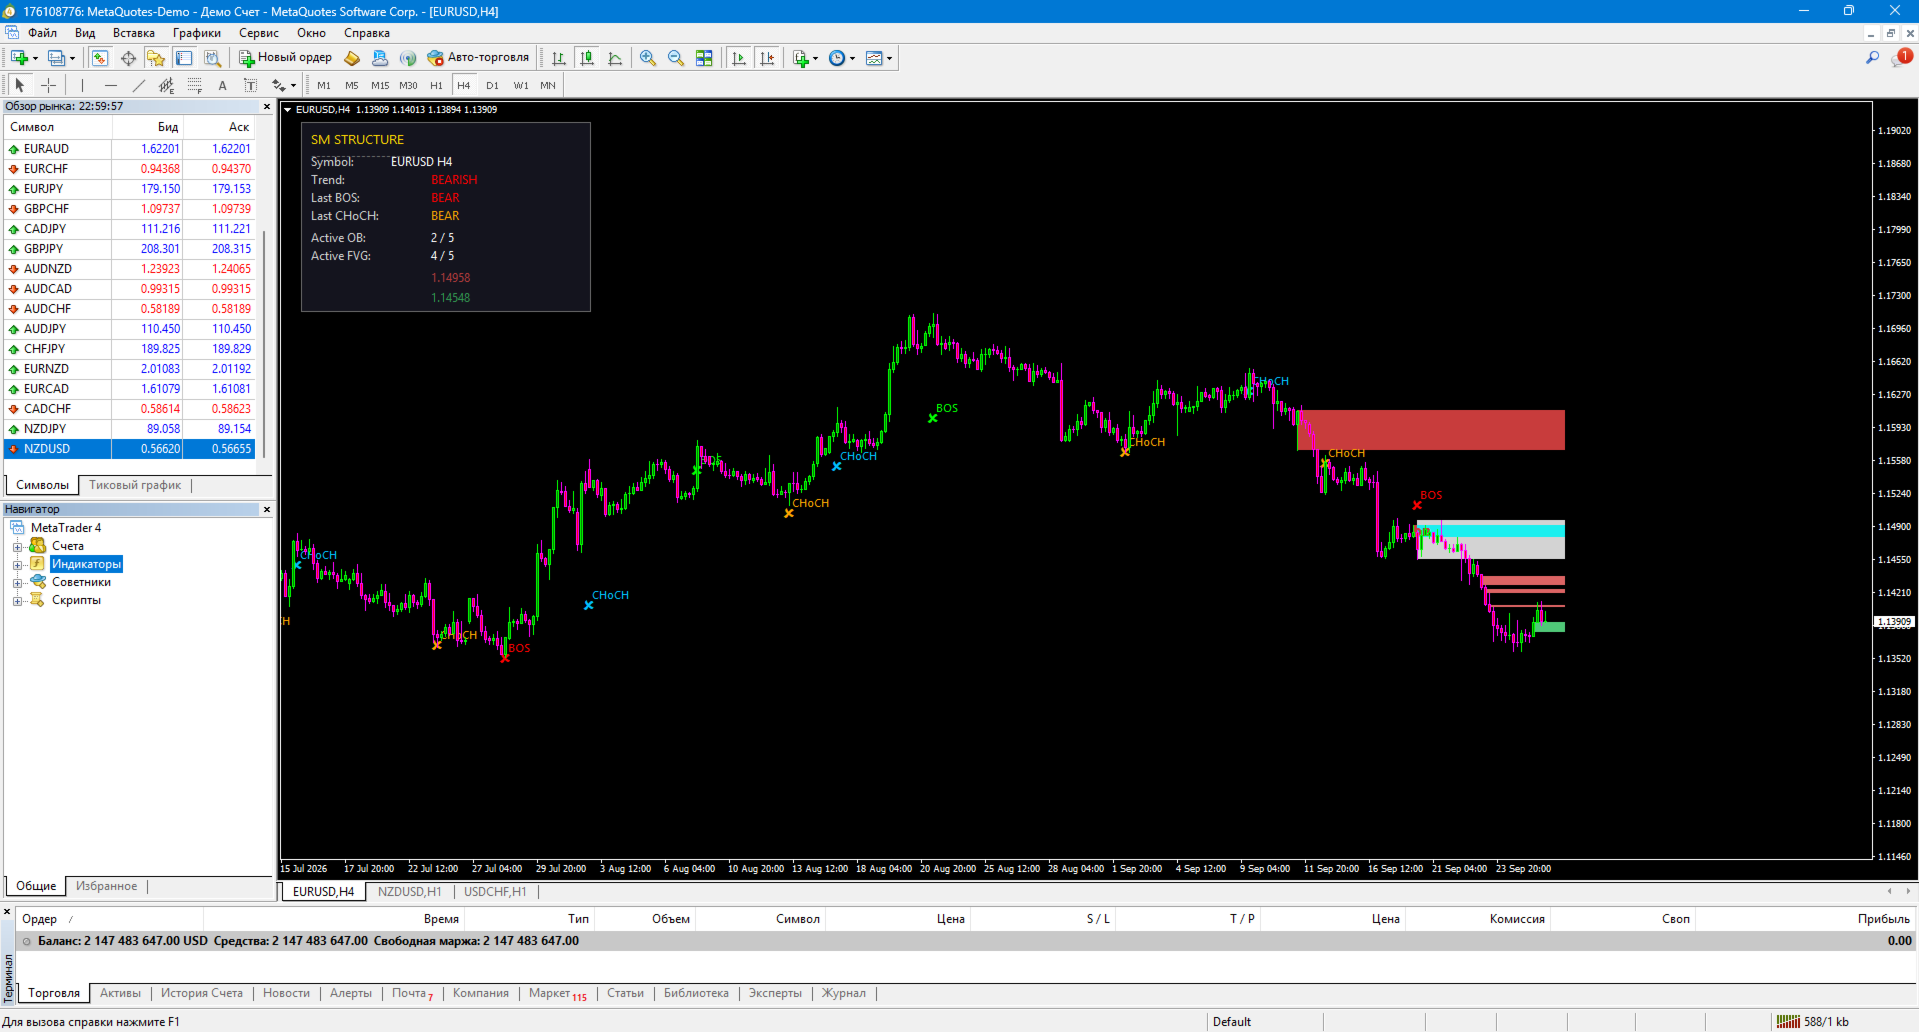
SM Structure PR is a professional indicator for MetaTrader 4 that automatically identifies market structure using Smart Money Concepts (SMC) and ICT methodology. It detects BOS (Break of Structure), CHoCH (Change of Character), Order Blocks, Fair Value Gaps (FVG) and Premium/Discount zones — all in one tool.

Built by a trader with 12 years of live experience. Helps see market structure the way institutional players see it, and find entries in the direction of "smart money".

🎯 What the indicator shows

Market structure:

  • ✅ BOS (Break of Structure) — trend-following structure break

  • 🔄 CHoCH (Change of Character) — first reversal signal

  • 📊 Swing High / Low — key structural points

Smart Money zones:

  • 🟩 Order Blocks — zones where institutional capital opened positions

  • 🟦 FVG (Fair Value Gaps) — imbalances that price typically fills

  • 🔴 Premium zone — upper half of the range (expensive)

  • 🟢 Discount zone — lower half of the range (cheap)

Dashboard:

  • Current symbol and timeframe

  • Trend direction (BULLISH / BEARISH / NEUTRAL)

  • Last BOS and CHoCH

  • Active OB and FVG counts

  • Premium and Discount levels

✨ Key features

📈 Automatic structure detection

The indicator finds swings, marks BOS and CHoCH automatically — no manual chart marking needed. Everything updates in real time.

🎯 Order Blocks with mitigation

Order Blocks are identified as the last opposite candle before the impulse. The indicator tracks mitigation — when price breaks through the zone, it fades or hides (configurable).

📊 Fair Value Gaps (FVG)

Classic three-candle imbalances with a minimum size in points. Active FVGs are highlighted with fill, mitigated ones become faded.

⚖️ Premium / Discount zones

Automatic identification of the upper (Premium) and lower (Discount) halves of the range between the latest significant swings. Classic ICT approach: buy in Discount, sell in Premium.

🚫 Anti-clutter protection

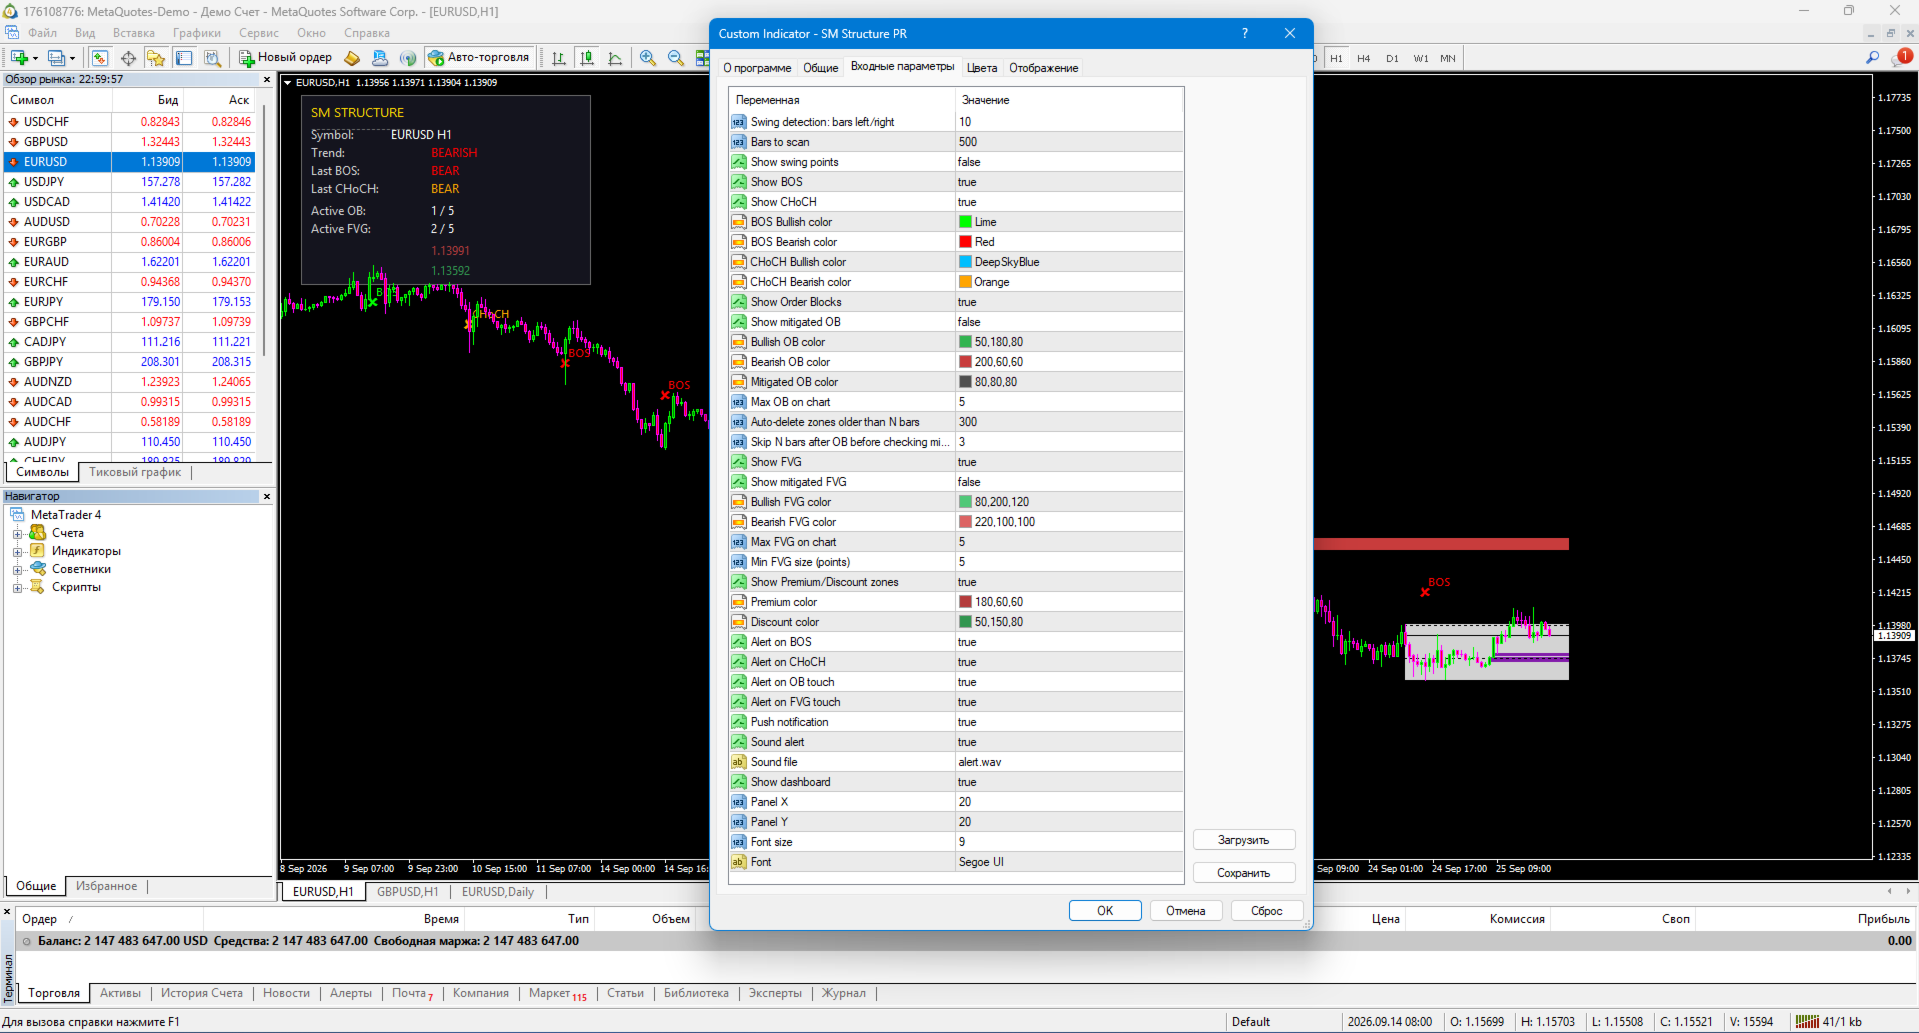
  • Max active OB and FVG (default 5 each)

  • Auto-delete zones older than N bars

  • Skips impulse bars during mitigation check — no false triggers

🔔 Alerts

  • Popup alert

  • Push notification to mobile MT4

  • Sound alert

  • Separate alerts for BOS, CHoCH, OB touch and FVG touch

🎨 Flexible settings

  • Colors and widths of all elements

  • Show/hide swings, mitigated zones

  • Configure number of displayed zones

  • Disable any element

🌍 Cross-platform

Unified logic for MetaTrader 4. Identical signals — can be used on both platforms in parallel.

🛠️ How to use

1. Installation

  • Copy SMStructure.ex4 to MQL4/Indicators/ (MT4)

  • Restart the terminal

  • Drag the indicator onto the chart

2. Tuning by instrument

Instrument SwingBars MinFVGPoints MaxOB MaxFVG
EURUSD, GBPUSD 10 5 5 5
XAUUSD (gold) 10 50 5 5
BTCUSD, ETHUSD 12 500 5 5
US500, NAS100 10 20 5 5

3. Trading scenarios

  • BOS up → bullish trend, buy on retrace to OB or FVG below

  • BOS down → bearish trend, sell on retrace to OB or FVG above

  • CHoCH → possible reversal, wait for confirmation (new BOS)

  • Price in Discount + bullish OB → strong buy signal

  • Price in Premium + bearish OB → strong sell signal

  • FVG + OB in same zone → high-probability zone

4. Recommended timeframes

  • M5–M15 — scalping and intraday

  • H1–H4 — swing trading

  • D1 — medium-term trading

📋 Implementation notes

  • Pure MQL4 — no DLLs, no external dependencies

  • No repaint — signals are stable after bar close

  • Works on any instrument: Forex, crypto, metals, indices, stocks

  • All timeframes: M1 to MN

  • Optimized performance

  • Multilingual interface (planned)

⚠️ Important warning

SM Structure is not a trading system. It's a market structure analysis tool. The indicator doesn't provide 100% buy/sell signals — it shows zones of institutional interest and current structure state.

Using the indicator does not guarantee profit. All trading decisions are made by the trader.

🏆 About the developer

Created by Musa Khunarikov — trader with 12 years of live experience (Forex, stocks, MOEX, metals). 51 certifications from "Finam" training center in trading, algo trading and MetaTrader 4.5 .

Services: EA development, indicators, panels, trading system audit.

📞 Support

30 days of free support after purchase. Bug fixes within 48 hours.

추천 제품
Major Support and Resistance Indicator
Ahmad Ar Abedalaziz Alazaizeh
This indicator filters the Zigzag indicator to calculate the main support and resistance levels. Variables minimum gap between peaks : is the distance (GAP) between the peaks of the Zigzag peaks sensitivity : Minimum number of nearby peaks look back: it means that it has to test the last 50 peaks in the Zigzag object name perfix: a prefix for level’s line name on chart
FREE
RelicusRoad Daily Pivots는 MetaTrader 4와 MetaTrader 5용 일간 피벗 포인트 지표로, 전일 범위를 Fibonacci 레벨로 나누고 마이너스 100퍼센트부터 플러스 200퍼센트까지 위아래로 연장합니다. 고전적인 floor pivot 대신, 직전에 완료된 범위를 저가가 0%, 고가가 100%인 척도로 다룹니다. 열아홉 개의 레벨이 차트 오른쪽 가장자리에 촘촘한 색상 마커로 표시되므로, 오늘 움직임의 크기를 전일 범위의 일부 또는 배수로 읽을 수 있습니다. 작동 방식 지표는 직전에 완료된 기준 기간의 고가와 저가를 가져와 그 범위의 각 비율마다 레벨을 배치합니다: level = low + ratio x (high - low). 주말 봉은 건너뛰므로 월요일의 기준은 마지막 거래일입니다. 기준 기간은 차트 시간대에서 정해집니다. 내부 구간, 회색: 0%, 23.6%, 38.2%, 50.0%, 61.8%, 78.6%, 100%. 상단 구간, 초록: +123
FREE
UPD1 Fibo Levels
Vitaliy Kuznetsov
5 (3)
표시기는 지정된 수의 양초를 분석하고 고가를 기준으로 피보나치 수준을 표시합니다. 레벨이 재정렬되기 때문에 범위의 오른쪽에 관심이 있습니다. 가격은 레벨을 자화하고 터치에 반응합니다. 이 도구를 사용하여 수정 후 추세 진입점을 찾습니다. 왼쪽에서 레벨이 완벽하게 상승한 것을 보면 극한 지점에서 움직임의 끝을 발견했다고 가정할 수 있습니다. 모든 선은 버퍼 또는 개체를 통해 그려집니다(선택 사항). 입력 매개변수. Bars Count - 계산 범위. Visual Button - 버튼 표시(활성화/비활성화). Corner - 버튼 앵커 각도. X indent - 픽셀의 수평 패딩. Y indent - 픽셀의 수직 패딩. Label Visual - 디스플레이 레벨 레이블. Label Font Size   - 글꼴 크기. Label Shift Bars   - 비문의 들여쓰기(촛불의 수). Label Tooltip   - 레벨 위의 커서 아래에 텍스트 표시. Draw Lines  
FREE
Wa Candle Timer MT4
Wachinou Lionnel Pyrrhus Sovi Guidi
5 (1)
Wa Candle Timer MT4는 MT4 차트에서 다음 캔들이 형성되기까지 남은 시간을 표시하는 강력하고 사용자 친화적인 지표입니다. 이 도구는 트레이더가 캔들 마감 시간을 인식하고 더 나은 거래 결정을 내릴 수 있도록 도와줍니다. 이제 사용자 정의 비율에 도달했을 때 알림 기능도 지원합니다. 주요 기능:   현재 캔들의 카운트다운 표시   남은 시간이 설정한 비율보다 작아지면 색상 변경   3.00 버전에서 추가됨: 지정된 비율에 도달 시 알림 제공   글꼴 및 색상 완전 커스터마이징 가능   거래의 시간 관리 및 정밀도 향상   사용자 설정 항목:   1️⃣ 임계값 이상일 때의 색상   2️⃣ 임계값 이하일 때의 색상   3️⃣ 글꼴 크기   4️⃣ 글꼴 스타일   5️⃣ 알림 트리거 비율 설정 (예: 80%, 90%, 95%) 이 인디케이터는 정확한 타이밍이 중요한 트레이더들에게 매우 유용하며, 거래 전략을 향상시키는 데 도움을 줍니다.
FREE
Pivot Points Classic and Camarilla 는 클래식 피벗 레벨(P, R1-R3, S1-S3)과 Camarilla 레벨(H1-H4, L1-L4)을 차트에 직접 그려 줍니다. 레벨은 선택한 시간대(기본값 D1)의 이전 기간의 고가, 저가, 종가로 계산되며, 각 기간은 해당 기간 동안 수평선으로 그려지므로 이전 며칠, 몇 주, 몇 달 동안 가격이 레벨에 어떻게 반응했는지 볼 수 있습니다. 기능 클래식 피벗 - 중심 피벗 P와 세 개의 저항선(R1-R3), 세 개의 지지선(S1-S3) Camarilla 피벗 - H1-H4 및 L1-L4의 여덟 개 레벨; Camarilla 트레이더가 가장 주목하는 레벨이므로 H3/L3와 H4/L4는 더 굵게 그려집니다. 클래식에서는 피벗 P와 바깥쪽 레벨 R3/S3가 더 굵습니다 Classic, Camarilla 또는 둘 다 를 같은 차트에 표시; Classic 선은 실선이고 Camarilla 선은 기본적으로 점선 스타일입니다(선 스타일
FREE
This indicators automatically draws the Support and resistances levels for you once you've dropped it on a chart.  It reduces the hustle of drawing and redrawing these levels every time you analysis prices on a chart. With it, all you have to do is dropped it on a chart, adjust the settings to your liking and let the indicator do the rest.  But wait, it gets better; the indicator is absolutely free!  Get the new and improved version here:  https://youtu.be/rTxbPOBu3nY Parameters Time-frame  -> T
FREE
UPD1 Impulse Shadow
Vitaliy Kuznetsov
이 표시기는 변동성에 따라 차트에 큰 그림자를 자동으로 검색하고 표시합니다. 그림자는 웨이브 크기에 따라 추가로 필터링됩니다. 이 알고리즘은 지정된 범위의 그림자에 의해 프랙탈 분석을 분석하고 레벨을 표시합니다. 설정에서,당신은 다중 통화 대시 보드를 활성화 할 수 있습니다. 경고는 현재 일정 또는 전체 대시보드 시트 사이에서 선택됩니다. 큰 그림자에 대한 신호와 프랙탈 레벨을 통과 한 신호는 별도로 켤 수 있습니다. Blog-Link -   Retest and Fake Breakout with UPD1 . 거래 패턴: +트렌드 별 재시험. +거짓 고장. +기타. EURUSD, GBPUSD, XAUUSD, ... M15, M30, H1. 입력 매개변수. 인기 있는. Bars Count – 표시할 막대 수. ATR Period - 변동성을 계산하는 촛대의 수. ATR Coeff Shadow (0 - Off) – 그림자 크기 계수(평균 변동성 촛불에 상대). ATR Coeff
The price is moving between two curve tunnel lines in a trend. The two lines of a tunnel represent support and resistance. In an uptrend, for instance, a trade might be entered at the support of the trend line (shown by the red line in the chart) and exited at resistance of the upper tunnel line (shown by the blue line). Tunnel show trend direction for any timeframe (if you have enough bars on the chart for higher timeframes). Trend, or price tunnel, can be up, down or sideways. If the current p
pivot points using by many traders and pivot levels most of the times are very helpfull . this indicator is a custom with internal parameters. it can show two times pivot (weekly and daily). you can choose periods total for each time showing pivots.( 1 week , 2 week ,...1day , 2day ,...) when use weekly and daily pivots , it can show you many support and resistance zones. if have proposal comment too me for upgrading indicator.

FREE
Auto Fibo Retracement MT4
Nguyen Tuan Son
3.75 (4)
Auto Fibonacci Retracement Indicator — Flexible and Reliable This is not just another Auto Fibonacci Retracement indicator — it’s one of the most flexible and dependable tools available . If you find it useful, please leave a review or comment to support the project. Check out my other helpful tools below: Telegram to MT4 using AI   - AI-Powered Signal Copier Bot Timeframes Trend Scanner    - Scan the trend of assets in difference timeframes with multiple indicators Market Trend Scanner   - Scan
FREE
BuySell FibPiv
Huu Tri Nguyen
BuySell FibPiv Fibonacci Pivot Level Indicator with Dynamic Support and Resistance Zones Overview BuySell FibPiv is a Fibonacci pivot-based technical analysis indicator designed to calculate dynamic support and resistance levels using previous session price data. The indicator applies Fibonacci expansion and retracement calculations to generate multiple pivot-based levels for intraday and swing trading analysis. It provides: Central pivot calculation Fibonacci-based support and resistance zones
Peak Trough Analysis is the great tool to detect peaks and troughs in your chart. Peak Trough Analysis tool can use three different peaks and troughs detection algorithm. The three algorithm include the orignal Fractals Indicator by Bill Williams, the Modified Fractals indicator and ZigZag indicator. You can use this peak and trough analysis tool to detect the price pattern made up from Equilibrium Fractal-Wave process. For further usage, there are good guide line on how to use this peak trough
FREE
Multi Timeframe ZigZag Indicator
Salman A A A T Bakhash
5 (2)
Description: This indicator draw ZigZag Line in multiple time frame also search for Harmonic patterns before completion of the pattern. Features: Five instances of ZigZag indicators can be configured to any desired timeframe and inputs. Draw Harmonic pattern before pattern completion. Display Fibonacci retracement ratios. Configurable Fibonacci retracement ratios. Draw AB=CD based on Fibonacci retracement you define. You can define margin of error allowed in Harmonic or Fibonacci calculations
FREE
Raymond Cloudy Day Indicator for MT4 – Pivot-Based Reversal and Trend Levels Raymond Cloudy Day Indicator is a pivot-based level indicator for MetaTrader 4 (MT4). It was developed by Ngo The Hung based on Raymond’s original idea and is designed to give a structured view of potential reversal zones, trend extensions and support/resistance levels directly on the chart. The default settings are optimised for XAUUSD on the H1 timeframe, but the indicator can be tested and adjusted for other symbols
TCL Auto Pivot Points
Stratos Digital (PVT) Ltd
TCL Auto Pivot Points is a daily, weekly, and monthly pivot-point indicator for MetaTrader 4. It calculates classic institutional support and resistance levels (R1 through R3 and S1 through S3) using a choice of four formulas and plots them automatically on the chart. What It Plots The indicator draws seven horizontal lines: the central Pivot Point (P), three Resistance levels (R1, R2, R3) above it, and three Support levels (S1, S2, S3) below. The lines update at the start of each pivot period (
FREE
무료 — ZigZag 스윙 피벗과 이동평균 추세 필터를 하나의 차트에 함께 그립니다. 피벗 돌파 시스템이 거래에 사용하는 피벗 레벨과 추세 배경을 보여줍니다. 금(XAUUSD)에 맞춰 조정했습니다. 완전 무료이며 제한이 없습니다. 차트에서 유용하다고 느끼셨다면 짧은 리뷰가 저희에게 가장 큰 도움이 됩니다. 30초면 충분하며, 다른 트레이더가 이 도구를 발견하는 유일한 경로입니다. 플랫폼: MetaTrader 4 (이 페이지). 피벗 돌파는 더 큰 추세와 같은 방향일 때에만 의미가 있습니다. 이 지표는 확정된 각 스윙 피벗을 표시하고 추세 이동평균을 그려서, 마지막 피벗의 돌파가 추세에 순응하는지 역행하는지를 한눈에 볼 수 있게 합니다. === 무엇을 그리는가 === - 확정된 ZigZag 스윙 고점과 저점(점) — 돌파 시스템이 반응하는 피벗. - 추세 이동평균(기본값 MA 50). === 확정된 피벗은 리페인트하지 않음 === 피벗은 해당 구간의 국지적 극값으로 확정된 후
FREE
SRP (Strong Retracement/Reversal Points) is a powerful and unique support and resistance indicator. It displays the closest important levels which we expect the price retracement/reversal! If all level are broken from one side, it recalculates and draws new support and resistance levels, so the levels might be valid for several days depending on the market! Key Features You can use it in all time-frames smaller than daily! Displays closest significant support and resistance levels Update the le
FREE
Pivot Points MT4
KEENBASE SOFTWARE SOLUTIONS
KT Pivot Points는 최신 데이터를 기반으로 일간, 주간, 월간 피벗 레벨을 차트에 자동으로 표시합니다. 피벗 포인트는 외환 시장을 포함한 기술적 분석에서 널리 사용되는 지표입니다. 주요 기능 가격이 피벗 레벨에 도달하면 알림을 전송합니다.  각 피벗 레벨 종류별로 완전한 사용자 지정이 가능합니다.   일간, 주간, 월간 피벗 레벨을 깔끔하게 표시합니다. CPU 자원을 적게 사용하여 빠르게 계산됩니다. 차트상의 다른 지표들과 호환됩니다. 피벗 포인트란? 피벗 포인트는 전일의 고가, 저가, 종가의 평균을 이용하여 계산됩니다.  이 계산된 피벗 포인트를 기반으로 향후의 지지 및 저항 수준을 예측할 수 있으며, 이는 해당 수준 근처에서의 가격 움직임을 판단하는 데 도움이 됩니다. 일반적으로 가격이 피벗 포인트 위에서 거래되면 강세 심리를, 아래에서 거래되면 약세 심리를 나타냅니다. 피벗 계산식 피벗 레벨을 계산하기 위해 전일, 주간 또는 월간의 고가, 저가, 종가 데이터를
Clever Trend Swing Levels
Carlos Forero
4.22 (9)
Description: The indicator measures, through the zigzag indicator, the levels of trend or correction. It shows in the chart the levels of each low or high detected. KEY LINKS:   How to Install  –  Frequent Questions  -  All Products  How is this indicator useful? This indicator determines, depending on Zigzag parameter if a trend is beginning, developing, or ending This indicator determines the direction of the trend Components Levels as positive or negative numbers, depending on the direction
FREE
-- 간단하지만 효과적입니다. 역전 지표 - 무엇인가요? 슈퍼트렌드(SuperTrend) 논리와 지수 곡선 기술을 결합한 추세 추종 오버레이 지표입니다. 추세 방향을 감지하고 차트에 동적 채널을 그리며, 추세가 반전될 때 실시간 알림을 보냅니다. 어떻게 작동하나요? 지표는 ATR과 슈퍼트렌드 계수를 사용해 지수형 기준선을 계산합니다. 가격이 이 기준선 위나 아래로 마감되면 추세 반전이 확인됩니다. 녹색 화살표는 매수 추세 시작을, 빨간색 화살표는 매도 추세 시작을 표시합니다. 주요 기능: ATR 기반 동적 채널을 적용한 지수 추세 기준선 녹색/적색으로 구분된 추세선 및 채워진 채널 추세 반전 시 매수/매도 화살표 신호 내장 알림: 팝업, 푸시 알림, 이메일, 소리 중복 알림 방지 (바당 하나의 알림) 완전 커스터마이징 가능: 색상, 선 두께, 화살표 크기, 채널 폭 지연 없는 깔끔한 차트 오버레이 입력값: 지수 추세율, 슈퍼트렌드 계수, ATR 기간, 채널 폭 토글 기능
FREE
Necessary for traders: tools and indicators Waves automatically calculate indicators, channel trend trading Perfect trend-wave automatic calculation channel calculation , MT4 Perfect trend-wave automatic calculation channel calculation , MT5 Local Trading copying Easy And Fast Copy , MT4 Easy And Fast Copy , MT5 Local Trading copying For DEMO Easy And Fast Copy , MT4 DEMO Easy And Fast Copy , MT5 DEMO The homeopathic indicator is also called the CCI indicator. The CCI indicator was proposed
FREE
Harmonic Pattern Plus MT4
Young Ho Seo
4.44 (18)
Introduction Harmonic Patterns are best used to predict potential turning point. Traditionally, Harmonic Pattern was identified manually connecting peaks and troughs points in the chart. Manual harmonic pattern detection is painfully tedious and not suitable for everyone. You are often exposed under subjective pattern identification with manual pattern detection. To avoid these limitations, Harmonic Pattern Plus was designed to automate your harmonic pattern detection process. The functionality
Liquidity Grab X — Liquidity Sweep & Grab Detector (MT4 & MT5) Liquidity Grab X automatically detects buyside and sellside liquidity sweeps (stop-hunts) at swing pivots and classifies each grab by strength — helping you spot exhaustion moves and potential reversal zones in real time, with instant push notifications to your phone. Full Description Liquidity Grab X is a free rule-based indicator for MetaTrader 4 and MetaTrader 5 that identifies liquidity grabs — moments where price sweeps above a
FREE
MP Demark Pivot Levels
Pierre Ksachikian
4 (1)
This indicator is stand alone version from  MP Pivot Levels  (All in one) containing Demark's Pivots. Calculations:     PP = X / 4     R1 = X / 2 - LOWprev     S1 = X / 2 - HIGHprev Uses: When the pair currency price may change the direction of movement. Possible constraints of support and resistance that creates plateaus for the currency pair prices. Tendency identification by comparing the present prices according to current day's pivot point and also the prior day's pivot points. ____________
FREE
Pivot Trend
Harun Celik
5 (2)
Pivot trend indicator is a trend indicator that uses standard pivot calculation and some indicators. The purpose of the indicator is to calculate the possible trends using the pivot point. And to give the user an idea about trend direction. You can use this display as a trend indicator. Or with other indicators suitable for your strategy. Features The green bar represents the upward trend. The red bar represents the downward trend. The blue pivot point represents the upward trend. The yellow pi
Trend formation channel is a set of lines. The two central lines of the indicator represent moving averages of the specified type and period, they also form a small channel. The large channel is formed - the central lines of the indicator plus / minus the standard deviation estimate, multiplied by the coefficient selected by the user. The basic rule for plotting is that about 5% of prices should be outside these lines, and 95% - inside. If the price crosses the upper or lower line too often, th
BeST_ Classic Pivot Points is an MT4 Indicator that is based on the widely known and definitely classic Pivot Point of a market prices activity. A pivot point is calculated as an average of significant prices (high,low,close) from the performance of a market in the prior trading period. If the market in the following period trades above the pivot point it is usually evaluated as a bullish sentiment, whereas trading below the pivot point is seen as bearish. A pivot point and the associated suppo
FREE
Convenient drawing of parabolic channels by four points (two lower and two upper extremums). Additional control keys: N (New) - Start drawing a new channel. C (Clear) - Deletes the current channel. By default, the current channel is the last channel. But you can click on the line of any channel to make it current. Click on the gear in the upper right corner to set some parameters for all channels or the current channel. All work is visible from the animated Gif. Channels are saved when the time
FREE
ZigZag on average
Valeriy Medvedev
4.5 (2)
This is a well-known ZigZag indicator. But it differs by the fact that its plot is based on values of the middle line which is set by a user. It can display Andrews’ Pitchfork and standard or Bobokus Fibo levels. NO REPAINTING. Parameters Period МА — middle line period. Default value is 34. Minimum value is 4. Maximum value is set at your discretion. Used to calculate price - base price to calculate the middle line. The averaging method - method of smoothing the middle line. Turning pitchfork —
FREE
Aura Mini Candle Timer - Smart Interactive Edition Aura Mini Candle Timer는 차트의 공간을 최소한으로 차지하면서 다중 타임프레임(MTF)의 남은 캔들 마감 시간과 현재 캔들의 방향성을 직관적으로 표시해 주는 경량화된 타이머 지표입니다. 이 지표의 가장 큰 특징은 상호작용(Interactive)입니다. 번거롭게 지표 설정창을 열 필요 없이, 차트 위에 표시된 타이머 패널을 마우스로 클릭하는 것만으로 7개의 주요 타임프레임을 실시간으로 탐색할 수 있습니다. [주요 기능] 온차트 원클릭 타임프레임 순환 (One-Click Cycle): 타이머 패널을 클릭할 때마다 타임프레임이 M1 M5 M15 M30 H1 H4 D1 순서로 즉시 변경됩니다. 독립적인 타임프레임 추적: 현재 보고 있는 차트의 주기와 관계없이, 타이머에 설정된 특정 타임프레임의 마감 시간과 진행 방향을 독립적으로 모니터링할 수 있습니다. 캔들 방
FREE
이 제품의 구매자들이 또한 구매함
Quant Direction
Georgios Kalomoiropoulos
Quant Direction 은 3D 시장 분석 도구입니다. 다양한 매개변수에 걸쳐 정확한 백분율 편차를 계산하면서 완벽하게 객관적인 알고리즘 기반 시장 분석을 제공합니다. 첨단 AI 기반 모델링 도구와 엄격한 테스트를 거쳐 개발된 이 알고리즘은 타의 추종을 불허하는 정확도로 시장을 분석합니다. 플랫폼에서 모든 통화쌍 또는 금융 상품을 분석할 수 있습니다. 단기 거래, 데이 트레이딩, 스윙 트레이딩 등 어떤 유형의 거래를 하든 Quant Direction은 최적의 선택입니다. 운영자가 되는 것의 진정한 이점 퀀트 디렉션의 진정한 장점은 감정, 눈의 피로, 과도한 분석을 완전히 배제한다는 점입니다. 더 이상 수십 개의 차트를 일일이 살펴보며 방향을 찾거나 자신의 판단에 끊임없이 의문을 품을 필요가 없습니다. 이 시스템은 8개의 시간 간격(5개월에서 수개월까지)을 밀리초 단위로 처리합니다. 특정 시점의 주요 시장 참여자를 정확하게 식별하여 항상 성공 확률이 가장 높은 방향으로 거래할
Hidden Cycles
Lev Vladimirovic Marushkin
5 (1)
The Only 100% Universal Tool! Stop trading against nature! This is your chance to secure the only indicator rooted in the absolute laws that govern the entire universe. Most tools guess—this one reveals the truth. Buy another toy or buy the truth. Your choice... Based on Universal Laws — NOT Some Guy’s Algorithm: Let the market adjust to the Hidden Cycles Geometry — not the other way around. Most indicators are based on a man-made formula. They often lag, fail over time, or need constant re-o
Super Signal – Skyblade Edition 전문가용 노리페인트 / 노래그 트렌드 신호 시스템, 뛰어난 승률 제공 | MT4 / MT5용 1분, 5분, 15분과 같은 낮은 타임프레임에서 가장 좋은 성능을 보입니다. 핵심 기능: Super Signal – Skyblade Edition은 추세 매매를 위해 설계된 스마트 신호 시스템입니다. 이 시스템은 다중 필터 로직을 활용하여, 명확한 방향성과 실질적인 모멘텀이 수반된 고품질 추세만을 감지합니다. 이 시스템은 고점 또는 저점을 예측하지 않으며 , 다음 세 가지 조건이 모두 충족될 때만 신호를 발생시킵니다: 명확한 추세 방향 강화되는 모멘텀 건전한 변동성 구조 또한, 시장 세션 기반의 유동성 분석을 통해 신호의 신뢰성과 타이밍을 더욱 향상시킵니다. 신호 특성: 모든 화살표 신호는 100% 리페인트 없음 / 지연 없음 신호가 한 번 발생하면 고정되며, 깜빡이거나 사라지지 않음 차트 상의 시각적 화살표, 정보 패널, 팝업 알
Neuro Poseidon MT4
Daria Rezueva
4.74 (46)
Neuro Poseidon is a new indicator by Daria Rezueva. It combines precise trading signals with adaptive TP/SL levels - creating best possible trades as a result! Message me and get  Neuro Poseidon Assistant  as a gift to automize your trading process! What makes it stand out? 1. Proven profitability on all assets and timeframes 2. Only confirmed BUY and SELL signals present on the chart 3. Adaptive TP & SL levels generated by the software for each trade 4. Easy to understand - suitable for all
Gold Channel XAUUSD
Paulo Rocha
5 (4)
Gold Channel is a volatility-based indicator, developed with a specific timing algorithm for the XAUUSD pair, which consists of finding possible corrections in the market. This indicator shows two outer lines, an inner line (retracement line) and an arrow sign, where the theory of the channel is to help identify overbought and oversold conditions in the market. The market price will generally fall between the boundaries of the channel. If prices touch or move outside the channel it is a tradi
현재 30% 할인 ! 초보자 또는 전문가 트레이더를 위한 최고의 솔루션! 이 대시보드 소프트웨어는 28개의 통화 쌍에서 작동합니다. 2가지 주요 지표(Advanced Currency Strength 28 및 Advanced Currency Impulse)를 기반으로 합니다. 전체 Forex 시장에 대한 훌륭한 개요를 제공합니다. 고급 통화 강도 값, 통화 이동 속도 및 모든(9) 시간대의 28 Forex 쌍에 대한 신호를 보여줍니다. 추세 및/또는 스캘핑 기회를 정확히 파악하기 위해 차트의 단일 지표를 사용하여 전체 시장을 볼 수 있을 때 거래가 어떻게 개선될지 상상해 보십시오! 잠재적인 거래를 식별하고 확인하면서 강력한 통화와 약한 통화를 더욱 쉽게 식별할 수 있도록 이 지표에 기능을 내장했습니다. 이 표시기는 통화의 강세 또는 약세가 증가 또는 감소하는지 여부와 모든 시간대에서 수행되는 방식을 그래픽으로 보여줍니다. 추가된 새로운 기능은 현재 시장 조건 변화에 적응하는
Supply and Demand Dashboard PRO
Bernhard Schweigert
4.81 (21)
현재 30% 할인! 이 대시보드는 여러 기호와 최대 9개의 타임프레임에서 작동하는 매우 강력한 소프트웨어입니다. 주요 지표(최상의 리뷰: 고급 공급 수요)를 기반으로 합니다.   Advanced Supply Demand 대시보드는 훌륭한 개요를 제공합니다. 다음과 같이 표시됩니다.  영역 강도 등급을 포함하여 필터링된 공급 및 수요 값, 영역에 대한/및 영역 내 Pips 거리, 중첩된 영역을 강조 표시하고 모든 (9) 시간 프레임에서 선택한 기호에 대해 4가지 종류의 경고를 제공합니다. 그것은 당신의 개인적인 필요에 맞게 고도로 구성 가능합니다! 당신의 혜택! 모든 트레이더에게 가장 중요한 질문: 시장에 진입하기에 가장 좋은 수준은 무엇입니까? 최고의 성공 기회와 위험/보상을 얻으려면 강력한 공급/수요 영역 내 또는 그 근처에서 거래를 시작하십시오. 손절매를 위한 최적의 장소는 어디입니까? 가장 안전하려면 강력한 수요/공급 구역 아래/위에 정류장을 두십시오.
Miraculous Indicator Binary & Forex v3 StrategySafe Miraculous Indicator Binary & Forex v3 StrategySafe 는 명확한 신호, 강력한 확인 도구, 그리고 Binary 및 Forex 시장에서 사용할 수 있는 체계적인 거래 방식을 원하는 트레이더를 위한 전문 지표입니다. v3 버전에는 MIR Dashboard, Miraculous Confirmation Dashboard, GANN Law, Square of 9 레벨, GANN 각도, 그리고 더욱 강화된 Forex 모드가 포함되어 있습니다. 주요 기능 Binary 모드와 Forex 모드를 하나의 지표에서 지원. MIR Dashboard로 빠른 시장 흐름 확인. Miraculous Confirmation Dashboard로 진입 신호 확인. Forex 분석을 위한 GANN Law drawing lines. Square of 9 라인, 레벨, 방향 표시. 1x1 G
Dinapoli Package MT4
Samil Bozuyuk
5 (1)
All in One package includes the  Oscillator Predictor ,  MACD Predictor ,  Thrust Scanner  and  Advanced Fibonacci  indicators which are mandatory for applying  Dinapoli  trade plans.  Please visit below links for detailed explanations of indicators. Advanced Fibonacci Indicator =>  https://www.mql5.com/en/market/product/52834 Thrust Scanner Indicator => https://www.mql5.com/en/market/product/52830 Overbought /Oversold Predictor indicator => https://www.mql5.com/en/market/product/52621 Macd P
BTMM State Engine Pro MT4
Garry James Goodchild
BTMM State Engine Pro by G-Labs — Beat The Market Maker indicator for MetaTrader 4. Asian session range, London and New York kill zones, level progression (L1/L2/L3), peak formation detection (PFH/PFL), entry signals, and a multi-pair scanner from one chart. Stop scanning charts one pair at a time. The State Engine tracks the BTMM daily cycle automatically — Asian box, room boundaries, level blocks, peak formations, and filtered entries — while the scanner dashboard shows level, peak status,
KURAMA GOLD SIGNAL PRO (MT4) — 7중 필터 · 자동 TP/SL · 품질 점수 · 시그널 기록 저장 | XAUUSD 완전 트레이딩 시스템 자동 주문이 필요하다면 MT5 EA 버전도 있습니다 Gold Signal Pro EA with Auto TP SL는 GOLD M5/M15용 내장 Gold Signal Pro 엔진, 신호 선택, 자동 주문, TP/SL 및 위험 설정을 제공하는 별매 MT5 EA입니다. 신호 확인과 자동 실행을 선택할 수 있습니다. 단독 실행되며 본 지표 구매에 포함되지 않고 MT4에서는 동작하지 않습니다. EA 기능·패널·가격 보기 실시간 리페인트 없음. 시그널이 나타나는 순간 화살표, 진입, TP, SL이 그 자리에 고정되어 이후 절대 움직이지 않습니다. 여러분이 거래하는 것은 바로 이 실시간 시그널입니다. 그리고 v7.20에서는 실제로 발신된 모든 시그널이 자동 저장되어 재시작 후에도 정확히 복원됩니다. 구
GoldRush Trend Arrow Signal
Kirk Lee Holloway
5 (2)
GoldRush 트렌드 화살표 신호 GoldRush 트렌드 화살표 신호 지표는 XAU/USD 시장에서 고속 단기 스캘핑 트레이더를 위해 설계된 정밀한 실시간 트렌드 분석을 제공합니다. 1분 시간대에 특화되어 설계된 이 도구는 명확한 진입점을 표시하는 방향성 화살표를 제공하여 스캘퍼들이 변동성이 높은 시장 환경에서도 자신 있게 거래할 수 있도록 합니다. 이 지표는 PRIMARY 및 SECONDARY 경고 화살표로 구성됩니다. PRIMARY 신호는 추세 방향의 변화를 나타내는 흰색과 검은색 방향성 화살표이며, SECONDARY 신호는 PRIMARY 화살표가 지시하는 방향을 확인하고 잠재적인 거래 진입점을 표시하는 파란색과 빨간색 화살표입니다. 참고: 추세 방향이 변경된 후 PRIMARY 경고 화살표가 단 하나만 표시될 경우, 다수의 SECONDARY 파란색/빨간색 화살표가 표시될 수 있음을 유의해야 합니다. SECONDARY 신호는 신호 기준을 충족하는 어떤 캔들 이후에도 표시
JSL Orderflow Footprint turns every candle into a price ladder that shows how much volume traded on the bid and on the ask at each price level. It highlights diagonal imbalances, stacked imbalance zones, absorption at candle extremes, cumulative delta (CVD), delta divergence and the daily session volume profile, then combines five of these order-flow conditions into a 0–100 confluence score. A signal is only issued on bar close when the score is high, clearly one-sided and confirmed by the candl
Dynamic Forex28 Navigator
Bernhard Schweigert
4.43 (7)
Dynamic Forex28 Navigator - 차세대 외환 거래 도구. 현재 49% 할인. Dynamic Forex28 Navigator는 오랫동안 인기 있는 지표의 진화형으로, 세 가지의 힘을 하나로 결합했습니다. 고급 통화 Strength28 지표(695개 리뷰) + 고급 통화 IMPULSE with ALERT(520개 리뷰) + CS28 콤보 신호(보너스). 지표에 대한 자세한 정보 https://www.mql5.com/en/blogs/post/758844 차세대 Strength 지표는 무엇을 제공합니까?  원래 지표에서 좋아했던 모든 것이 새로운 기능과 더 높은 정확도로 강화되었습니다. 주요 기능: 독점적인 통화 Strength 공식.  모든 시간대에 걸쳐 부드럽고 정확한 강도선. 추세와 정확한 진입을 식별하는 데 이상적입니다. 역동적인 시장 피보나치 수준(시장 피보나치).  이 지표에만 있는 고유한 기능. 가격 차트가 아닌 통화 강도에 피보나치가 적용됩니다.
IQ Gold Gann Levels
INTRAQUOTES
5 (5)
Presenting one-of-a-kind Gann Indicator for XAUUSD IQ Gold Gann Levels is a non-repainting, precision tool designed exclusively for XAUUSD intraday trading. It uses W.D. Gann’s square root method to plot real-time support and resistance levels, helping traders spot high-probability entries with confidence and clarity. William Delbert Gann (W.D. Gann) was an exceptional market analyst whose trading technique was based on a complex blend of mathematics, geometry, astrology, and ancient calculation
OrderFlow Absorption – MT4용 전문 델타 & 흡수 신호 인디케이터 OrderFlow Absorption으로 진정한 오더플로우 분석의 힘을 경험하세요. MetaTrader 4를 위한 궁극의 델타 히스토그램 및 흡수 신호 인디케이터입니다. 가격 움직임의 이면에서 실제로 무슨 일이 일어나는지 알고 싶은 트레이더를 위해 설계된 이 도구는, 시장을 움직이는 숨겨진 매수/매도 압력과 흡수 이벤트를 드러냅니다. 주요 기능 델타 히스토그램 시각화:   매수와 매도 압력을 색상별 히스토그램으로 즉시 확인할 수 있습니다. 흡수 신호 감지:   고급 로직으로 강세 및 약세 흡수 이벤트를 식별하여 반전 신호를 미리 알려줍니다. 차트 마커:   흡수 신호가 차트에 직접 표시되어 시각적으로 쉽게 확인할 수 있습니다. 팝업 알림:   새로운 흡수 신호가 발생하면 실시간으로 알림을 받을 수 있습니다. 사용자 지정 임계값:   약한 신호는 필터링하고, 확률이 높은 기회에 집중할 수 있습니다.
PTS Precision Index Oscillator V2
PrecisionTradingSystems
5 (1)
프리시전 트레이딩 시스템의 로저 메드칼프에 의한 프리시전 인덱스 오실레이터 (Pi-Osc) 버전 2는 차트에 신속하게 로드되도록 주의 깊게 다시 코딩되었으며 경험을 향상시키기 위해 몇 가지 다른 기술적 개선 사항이 통합되었습니다. Pi-Osc는 정확한 거래 타이밍 신호를 제공하도록 개발되었으며 시장이 모든 사람의 스톱을 청산하기 위해 가야 하는 극도의 고갈 지점을 찾는 데 목적이 있습니다. 이 제품은 극단적인 지점이 어디에 있는지 알고 있는 고전적인 문제를 해결하며 트레이더로서의 삶을 훨씬 간단하게 만듭니다. 이것은 업계 표준 오실레이터와는 상당히 다른 강력한 차이점을 가지고 있는 고도로 복잡한 합의 지표입니다. 사용하는 기능 중 일부는 수요 지수, 자금 흐름, RSI, 스토캐스틱, 패턴 인식, 거래량 분석, 표준 편차 극단점 및 다양한 길이에서 위와 유사한 변형을 갖습니다. 미숙한 눈에는 다른 오실레이터와 비슷해 보일 수 있지만 RSI 또는 모멘텀과 같은 다른 오실레이
Beast Super Signal
Florian Zuercher
4.73 (90)
수익성 있는 거래 기회를 쉽게 식별하는 데 도움이 되는 강력한 외환 거래 지표를 찾고 계십니까? Beast Super Signal보다 더 이상 보지 마십시오. 사용하기 쉬운 이 추세 기반 지표는 시장 상황을 지속적으로 모니터링하여 새로운 개발 추세를 찾거나 기존 추세에 뛰어들 수 있습니다. Beast Super Signal은 모든 내부 전략이 정렬되고 서로 100% 합류할 때 매수 또는 매도 신호를 제공하므로 추가 확인이 필요하지 않습니다. 신호 화살표 알림을 받으면 구매 또는 판매하기만 하면 됩니다. 구매 후 비공개 VIP 그룹에 추가되도록 저에게 메시지를 보내주세요! (전체 제품 구매만 해당). 최신 최적화된 세트 파일을 구입한 후 저에게 메시지를 보내주세요. MT5 버전은   여기에서 사용할 수 있습니다. 여기에서   Beast Super Signal EA를 받으세요. 최신 결과를 보려면 댓글 섹션을 확인하세요! Beast Super Signal은 1:1, 1:2
ORB Seeker
Marcela Goncalves De Oliveira
4 (1)
한정 수량 판매 및 제품 희소성 유지를 위한 특별 가격입니다! 단돈 599달러! 구매 후 저에게 연락 주시면 보너스 ORB Seeker EA와 개인 최적화 설정 파일을 보내드립니다. 깔끔한 세션 브레이크아웃을 자신감 있게 활용하세요! ORB Seeker는 정확성, 단순성, 유연성 및 명확한 차트 구조를 원하는 트레이더를 위해 개발된 전문적인 시가 범위 돌파(ORB) 지표입니다. 이 프로그램은 모든 금융 상품에 대해 장전 거래 또는 사용자 지정 세션 범위를 자동으로 표시하고, 진입, 손절매, 목표 수익 및 선택적으로 50% 부분 목표 수익 수준을 포함한 명확한 돌파 신호를 제공합니다. 모든 계산은 실시간으로 차트에 직접 표시됩니다. 런던 개장, 뉴욕 세션, 아시아 세션 또는 사용자 지정 시장 시간대를 선택하여 거래하세요. ORB Seeker는 사용자가 선택한 세션 시간에 맞춰 작동하므로 시장 범위, 돌파 수준 및 거래 레벨을 정확하게 확인할 수 있습니다. 모든 구매 시 ORB Se
Introduction Excessive Momentum Indicator is the momentum indicator to measure the excessive momentum directly from raw price series. Hence, this is an extended price action and pattern trading. Excessive Momentum Indicator was originally developed by Young Ho Seo. This indicator demonstrates the concept of Equilibrium Fractal Wave and Practical Application at the same time. Excessive Momentum detects the market anomaly. Excessive momentum will give us a lot of clue about potential reversal and
Elliott Wave Trend MT4
Young Ho Seo
4 (7)
Elliott Wave Trend was designed for the scientific wave counting. This tool focuses to get rid of the vagueness of the classic Elliott Wave Counting using the guideline from the template and pattern approach. In doing so, firstly Elliott Wave Trend offers the template for your wave counting. Secondly, it offers Wave Structural Score to assist to identify accurate wave formation. It offers both impulse wave Structural Score and corrective wave Structure Score. Structural Score is the rating to sh
Owl smart levels
Sergey Ermolov
4.26 (38)
추세를 따라 거래할 때 가장 어려운 점은 레벨을 찾는 것이 아니라, 어디에서 진입이 실제로 유효한지를 이해하는 것입니다. 가격은 종종 레벨에 반응하지만 움직임이 이어지지 않는 경우가 많으며, 이는 잘못된 진입이나 기회 상실로 이어집니다. Owl Smart Levels는 단순히 레벨만 표시하는 것이 아니라 , 시장 구조와 되돌림을 기반으로 형성된 구간을 보여줍니다. 이를 통해 진입 포인트를 다르게 평가할 수 있으며 일부 잘못된 신호를 피할 수 있습니다. Owl Smart Levels 시스템 구성 Owl Smart Levels 는 단순한 레벨 표시가 아니라, 각 요소가 서로 보완하는 완전한 트레이딩 모델 입니다. 구성 요소: Owl Smart Levels (지표) 추세 방향, 되돌림 구간, 그리고 사전에 정의된 진입, StopLoss, TakeProfit 레벨을 표시 시스템 가이드 실제 거래에서 신호를 어떻게 활용할지 설명: 어떤 상황을 고려하고 어떤 상황을 건너뛸지, 그리고 거래
Congestioni
Stefano Frisetti
5 (1)
This indicator is very usefull to TRADE Trading Ranges and helps identify the following TREND. Every Trader knows that any market stay 80% of the time in trading ranges and only 20% of the time in TREND; this indicator has been built to help traders trade trading ranges. Now instead of waiting for the next TREND, You can SWING TRADE on trading ranges with this simple yet very effective indicator. TRADING with CONGESTIONI INDICATOR: The CONGESTIONI Indicator identify a new trading range and ale
I have been trading for some time now and always find it a difficulty remembering the timing of the various market opening hours at the other part of the world (especially, when it comes to daylight saving), but could not find any decent indicator online that could help. And it is for this reason that gives birth to this indicator, which I have spent much time, effort and thinking. As many already know that opening of a certain marketplace, depending on which currency pair, has an impact on the
Introduction to Fractal Pattern Scanner Fractal Indicator refers to the technical indicator that makes use of the fractal geometry found in the financial market. Fractal Pattern Scanner is the advanced Fractal Indicator that brings the latest trading technology after the extensive research and development work in the fractal geometry in the financial market. The most important feature in Fractal Pattern Scanner is the ability to measure the turning point probability as well as the trend probabi
IQ FX Gann Levels
INTRAQUOTES
5 (3)
IQ FX Gann Levels a precision trading indicator based on W.D. Gann’s square root methods . It plots real-time, non-repainting support and resistance levels to help traders confidently spot intraday and scalping opportunities with high accuracy. William Delbert Gann (W.D. Gann) was an exceptional market analyst, whose trading technique was based on a complex blend of mathematics, geometry, astrology, and ancient mathematics which proved to be extremely accurate. We don't offer free or bonus indic
Smart Market Structure Pro by G-Labs — ICT and Smart Money Concepts toolkit with built-in multi-symbol scanner for MetaTrader 5. Break of structure, change of character, order blocks, fair value gaps, liquidity sweeps, premium and discount zones, ICT sessions, confluence scoring, AI trade ideas, and a traffic-light scanner across up to 30 pairs and four timeframes from one chart. Map SMC and ICT on the active chart while the built-in scanner monitors your full watchlist. Each cell shows BUY, SE
TPA True Price Action indicator reveals the true price action of the market makers through 100% non-repainting signals (except early signals mode) strictly at the close of a candle! TPA shows entries and re-entries, every time the bulls are definitely stronger than the bears and vice versa. Not to confuse with red/green candles. The shift of power gets confirmed at the earliest stage and is ONE exit strategy of several. There are available now two free parts of the TPA User Guide for our custom
ECM Elite Channel is a volatility-based indicator, developed with a specific time algorithm, which consists of finding possible corrections in the market. This indicator shows two outer lines, an inner line (retracement line) and an arrow sign, where the channel theory is to help identify overbought and oversold conditions in the market. The market price will generally fall between the boundaries of the channel. If prices touch or move outside the channel, it's a trading opportunity. The ind
Titan Z-Score Pro v3.2 Sürüm Notları: Kurumsal UI/UX Yeniden Tasarımı: Performans kokpitleri ve MTF matrisleri ana harita köşelerine taşındı, böylece tertemiz, dağınıklıktan arındırılmış bir alt pencere görünümü sağlandı. Canlı Kazanma Oranı ve Geri Dönüş Kokpiti: Ortalama geri dönüş başarı oranının ve kazanılan ortalama piplerin gerçek zamanlı takibi eklendi. Çok Zaman Dilimi Z-Puan Matrisi: Ana tabloya doğrudan görsel olarak 5 zaman dilimli (M5'ten D1'e) bir durum ızgarası entegre edildi. Yeni
제작자의 제품 더 보기
Like the logic of this tool? Explore the full ecosystem of professional indicators and utilities, built by a trader for traders: All author's products in MQL5 Market: https://www.mql5.com/en/users/musa1994/seller Trading philosophy and details: https://developer-mql4-mql5.netlify.app/ Liquidity + Volume Pro is a professional MetaTrader 4 indicator that combines liquidity and volume analysis into one system. Detects level sweeps, filters by volume, scores signal strength, and builds Supp
️ This is a FREE version of the tool. Developed by a practicing trader with 12 years of live trading experience (verified tax records, 51 Finam certificates). Looking for professional trading solutions (Volume Profile, SMC, Risk Manager)? Author's full lineup of PRO indicators: https://www.mql5.com/en/users/musa1994/seller Official website and portfolio: https://developer-mql4-mql5.netlify.app/ VolumeAnalysis is a professional library designed to integrate advanced volume analysis into y
FREE
MACrossoverEA KH
Musa Khunarikov
️ This is a FREE version of the tool. Developed by a practicing trader with 12 years of live trading experience (verified tax records, 51 Finam certificates). Looking for professional trading solutions (Volume Profile, SMC, Risk Manager)? Author's full lineup of PRO indicators: https://www.mql5.com/en/users/musa1994/seller Official website and portfolio: https://developer-mql4-mql5.netlify.app/ MA Crossover EA - advisor at the intersection of moving averages The advisor opens trades when
FREE
RoundLevelss
Musa Khunarikov
️ This is a FREE version of the tool. Developed by a practicing trader with 12 years of live trading experience (verified tax records, 51 Finam certificates). Looking for professional trading solutions (Volume Profile, SMC, Risk Manager)? Author's full lineup of PRO indicators: https://www.mql5.com/en/users/musa1994/seller Official website and portfolio: https://developer-mql4-mql5.netlify.app/ RoundLevelss — Psychological Round Levels with Auto-Adaptive Step for MetaTrader 4 Round price
FREE
RoundLevelsX
Musa Khunarikov
️ This is a FREE version of the tool. Developed by a practicing trader with 12 years of live trading experience (verified tax records, 51 Finam certificates). Looking for professional trading solutions (Volume Profile, SMC, Risk Manager)? Author's full lineup of PRO indicators: https://www.mql5.com/en/users/musa1994/seller Official website and portfolio: https://developer-mql4-mql5.netlify.app/ RoundLevelsX — Psychological Round Levels with Auto-Adaptive Step for MetaTrader 5 Round price
FREE
️ This is a FREE version of the tool. Developed by a practicing trader with 12 years of live trading experience (verified tax records, 51 Finam certificates). Looking for professional trading solutions (Volume Profile, SMC, Risk Manager)? Author's full lineup of PRO indicators: https://www.mql5.com/en/users/musa1994/seller Official website and portfolio: https://developer-mql4-mql5.netlify.app/ VolumeMonitorUtility is a service utility for the MetaTrader 5 terminal that displays key volum
FREE
️ This is a FREE version of the tool. Developed by a practicing trader with 12 years of live trading experience (verified tax records, 51 Finam certificates). Looking for professional trading solutions (Volume Profile, SMC, Risk Manager)? Author's full lineup of PRO indicators: https://www.mql5.com/en/users/musa1994/seller Official website and portfolio: https://developer-mql4-mql5.netlify.app/ Retail Sentiment MT4 Retail Sentiment is a professional information indicator for MetaTrader 4
FREE
RelativeVolumeKH
Musa Khunarikov
️ This is a FREE version of the tool. Developed by a practicing trader with 12 years of live trading experience (verified tax records, 51 Finam certificates). Looking for professional trading solutions (Volume Profile, SMC, Risk Manager)? Author's full lineup of PRO indicators: https://www.mql5.com/en/users/musa1994/seller Official website and portfolio: https://developer-mql4-mql5.netlify.app/ Relative Volume — Relative Volume Indicator This indicator displays current volume as a perce
FREE
️ This is a FREE version of the tool. Developed by a practicing trader with 12 years of live trading experience (verified tax records, 51 Finam certificates). Looking for professional trading solutions (Volume Profile, SMC, Risk Manager)? Author's full lineup of PRO indicators: https://www.mql5.com/en/users/musa1994/seller Official website and portfolio: https://developer-mql4-mql5.netlify.app/ Retail Sentiment MT5 Retail Sentiment is a professional information indicator for MetaTrader 5
FREE
️ This is a FREE version of the tool. Developed by a practicing trader with 12 years of live trading experience (verified tax records, 51 Finam certificates). Looking for professional trading solutions (Volume Profile, SMC, Risk Manager)? Author's full lineup of PRO indicators: https://www.mql5.com/en/users/musa1994/seller Official website and portfolio: https://developer-mql4-mql5.netlify.app/ SpreadMonitor is a professional MetaTrader 5 indicator that colorizes candles by spread level a
FREE
️ This is a FREE version of the tool. Developed by a practicing trader with 12 years of live trading experience (verified tax records, 51 Finam certificates). Looking for professional trading solutions (Volume Profile, SMC, Risk Manager)? Author's full lineup of PRO indicators: https://www.mql5.com/en/users/musa1994/seller Official website and portfolio: https://developer-mql4-mql5.netlify.app/ SpreadMonitor is a professional indicator for MetaTrader 4 that color-codes candlesticks based
FREE
Like the logic of this tool? Explore the full ecosystem of professional indicators and utilities, built by a trader for traders: All author's products in MQL5 Market: https://www.mql5.com/en/users/musa1994/seller Trading philosophy and details: https://developer-mql4-mql5.netlify.app/ Professional VolumeProfile is a professional indicator for MetaTrader 4 that builds a volume profile by price directly on the chart: it shows POC (Point of Control), VAH/VAL (boundaries of the value zone)
Like the logic of this tool? Explore the full ecosystem of professional indicators and utilities, built by a trader for traders: All author's products in MQL5 Market: https://www.mql5.com/en/users/musa1994/seller Trading philosophy and details: https://developer-mql4-mql5.netlify.app/ Professional Delta Volume is a professional indicator for MetaTrader 4 and MetaTrader 5 that shows the difference between buy and sell volume (Delta Volume) and cumulative delta. Helps to see who dominates
MTFDashboardX
Musa Khunarikov
Like the logic of this tool? Explore the full ecosystem of professional indicators and utilities, built by a trader for traders: All author's products in MQL5 Market: https://www.mql5.com/en/users/musa1994/seller Trading philosophy and details: https://developer-mql4-mql5.netlify.app/ MTF DashboardX MTF DashboardX is a professional scanner panel for MetaTrader 5 that shows market structure state across multiple symbols and timeframes in one window. Automatically detects BOS (Break of St
VolatilityProX
Musa Khunarikov
Like the logic of this tool? Explore the full ecosystem of professional indicators and utilities, built by a trader for traders: All author's products in MQL5 Market: https://www.mql5.com/en/users/musa1994/seller Trading philosophy and details: https://developer-mql4-mql5.netlify.app/ VolatilityProX is a professional indicator for MetaTrader 4 that combines three tools in one: Adaptive Supertrend — adaptive trend line Daily Range — yesterday's High/Low Pivot Points — classic R1, R2, S1,
Like the logic of this tool? Explore the full ecosystem of professional indicators and utilities, built by a trader for traders: All author's products in MQL5 Market: https://www.mql5.com/en/users/musa1994/seller Trading philosophy and details: https://developer-mql4-mql5.netlify.app/ Risk Manager Panel is a professional trading panel for MetaTrader 4 that automatically calculates lot size based on risk and manages trades in one click. No more manual lot calculation — the panel does it
Like the logic of this tool? Explore the full ecosystem of professional indicators and utilities, built by a trader for traders: All author's products in MQL5 Market: https://www.mql5.com/en/users/musa1994/seller Trading philosophy and details: https://developer-mql4-mql5.netlify.app/ Divergence Indicator Pro X is a professional divergence indicator for MetaTrader 4 that automatically detects divergences between price and oscillator right on the chart. Full MT5-version functionality, ad
VolumeProfileCVD
Musa Khunarikov
Like the logic of this tool? Explore the full ecosystem of professional indicators and utilities, built by a trader for traders: All author's products in MQL5 Market: https://www.mql5.com/en/users/musa1994/seller Trading philosophy and details: https://developer-mql4-mql5.netlify.app/ Volume Profile + CVD is a professional volume analysis indicator for MetaTrader 4 that displays volume distribution by price levels and cumulative volume delta. Full MT5-version functionality, adapted for
Like the logic of this tool? Explore the full ecosystem of professional indicators and utilities, built by a trader for traders: All author's products in MQL5 Market: https://www.mql5.com/en/users/musa1994/seller Trading philosophy and details: https://developer-mql4-mql5.netlify.app/ SLTPManager is a professional automatic Stop Loss and Take Profit manager with an interactive panel for MetaTrader 4, which instantly sets protection and profit-taking levels for every new trade. You will
Like the logic of this tool? Explore the full ecosystem of professional indicators and utilities, built by a trader for traders: All author's products in MQL5 Market: https://www.mql5.com/en/users/musa1994/seller Trading philosophy and details: https://developer-mql4-mql5.netlify.app/ A professional Volume Profile indicator for MetaTrader 5. Builds a horizontal histogram of volume distribution by price levels and identifies key zones of institutional interest. Created by a practicing tr
Like the logic of this tool? Explore the full ecosystem of professional indicators and utilities, built by a trader for traders: All author's products in MQL5 Market: https://www.mql5.com/en/users/musa1994/seller Trading philosophy and details: https://developer-mql4-mql5.netlify.app/ Liquidity + Volume Pro is a professional MetaTrader 5 indicator that combines liquidity analysis with volume filtering into a single trading system. It detects sweeps of key levels, filters them by volume,
SM Structure
Musa Khunarikov
Like the logic of this tool? Explore the full ecosystem of professional indicators and utilities, built by a trader for traders: All author's products in MQL5 Market: https://www.mql5.com/en/users/musa1994/seller Trading philosophy and details: https://developer-mql4-mql5.netlify.app/ SM Structure is a professional indicator for MetaTrader 5 that automatically identifies market structure using Smart Money Concepts (SMC) and ICT methodology. It detects BOS (Break of Structure), CHoCH (Ch
Like the logic of this tool? Explore the full ecosystem of professional indicators and utilities, built by a trader for traders: All author's products in MQL5 Market: https://www.mql5.com/en/users/musa1994/seller Trading philosophy and details: https://developer-mql4-mql5.netlify.app/ Professional Delta Volume is a professional indicator MetaTrader 5 that shows the difference between buy and sell volume (Delta Volume) and cumulative delta. Helps to see who dominates the market — buyers
MTFDashboard
Musa Khunarikov
Like the logic of this tool? Explore the full ecosystem of professional indicators and utilities, built by a trader for traders: All author's products in MQL5 Market: https://www.mql5.com/en/users/musa1994/seller Trading philosophy and details: https://developer-mql4-mql5.netlify.app/ MTF Dashboard is a professional scanner panel for MetaTrader 5 that shows market structure state across multiple symbols and timeframes in one window. Automatically detects BOS (Break of Structure) and CHo
VolatilityPro
Musa Khunarikov
Like the logic of this tool? Explore the full ecosystem of professional indicators and utilities, built by a trader for traders: All author's products in MQL5 Market: https://www.mql5.com/en/users/musa1994/seller Trading philosophy and details: https://developer-mql4-mql5.netlify.app/ VolatilityPro is a professional indicator for MetaTrader 5 that combines three tools in one: Adaptive Supertrend — adaptive trend line Daily Range — yesterday's High/Low Pivot Points — classic R1, R2, S1,
Like the logic of this tool? Explore the full ecosystem of professional indicators and utilities, built by a trader for traders: All author's products in MQL5 Market: https://www.mql5.com/en/users/musa1994/seller Trading philosophy and details: https://developer-mql4-mql5.netlify.app/ Risk Manager PanelX is a professional trading panel for MetaTrader 5 that automatically calculates lot size based on risk and manages trades in one click. No more manual lot calculation or opening trades t
Like the logic of this tool? Explore the full ecosystem of professional indicators and utilities, built by a trader for traders: All author's products in MQL5 Market: https://www.mql5.com/en/users/musa1994/seller Trading philosophy and details: https://developer-mql4-mql5.netlify.app/ Divergence Indicator Pro is a professional divergence indicator for MetaTrader 5 that automatically detects divergences between price and oscillator right on the chart. No more manual pivot hunting or chec
VolumeProfileCVDX
Musa Khunarikov
Like the logic of this tool? Explore the full ecosystem of professional indicators and utilities, built by a trader for traders: All author's products in MQL5 Market: https://www.mql5.com/en/users/musa1994/seller Trading philosophy and details: https://developer-mql4-mql5.netlify.app/ Volume Profile + CVD is a professional volume analysis indicator for MetaTrader 5 that displays volume distribution by price levels and cumulative volume delta. The indicator answers two key trader questio
SLTPManager
Musa Khunarikov
Like the logic of this tool? Explore the full ecosystem of professional indicators and utilities, built by a trader for traders: All author's products in MQL5 Market: https://www.mql5.com/en/users/musa1994/seller Trading philosophy and details: https://developer-mql4-mql5.netlify.app/ SLTPManager is a professional automatic Stop Loss and Take Profit manager with an interactive panel for MetaTrader 5, which instantly sets protection and profit-taking levels for every new trade. You will
Bressert Cycle Signals Like the logic of this tool? All author's products: https://www.mql5.com/ru/users/musa1994/seller Trading philosophy: https://developer-mql4-mql5.netlify.app/ Bressert Cycle Signals (BCS) is a professional cyclical indicator for MT5, adapting Walter Bressert's methodology. It combines oscillator phase analysis with precise "Setup & Trigger" entry mechanics, displaying signals directly on candlesticks. What the indicator shows Bressert Oscillator (subwindow):
필터:
리뷰 없음
리뷰 답변