SM Structure PR

💡 Like the logic of this tool?

Explore the full ecosystem of professional indicators and utilities, built by a trader for traders:

👉 All author's products in MQL5 Market: https://www.mql5.com/en/users/musa1994/seller

🌐 Trading philosophy and details: https://developer-mql4-mql5.netlify.app/

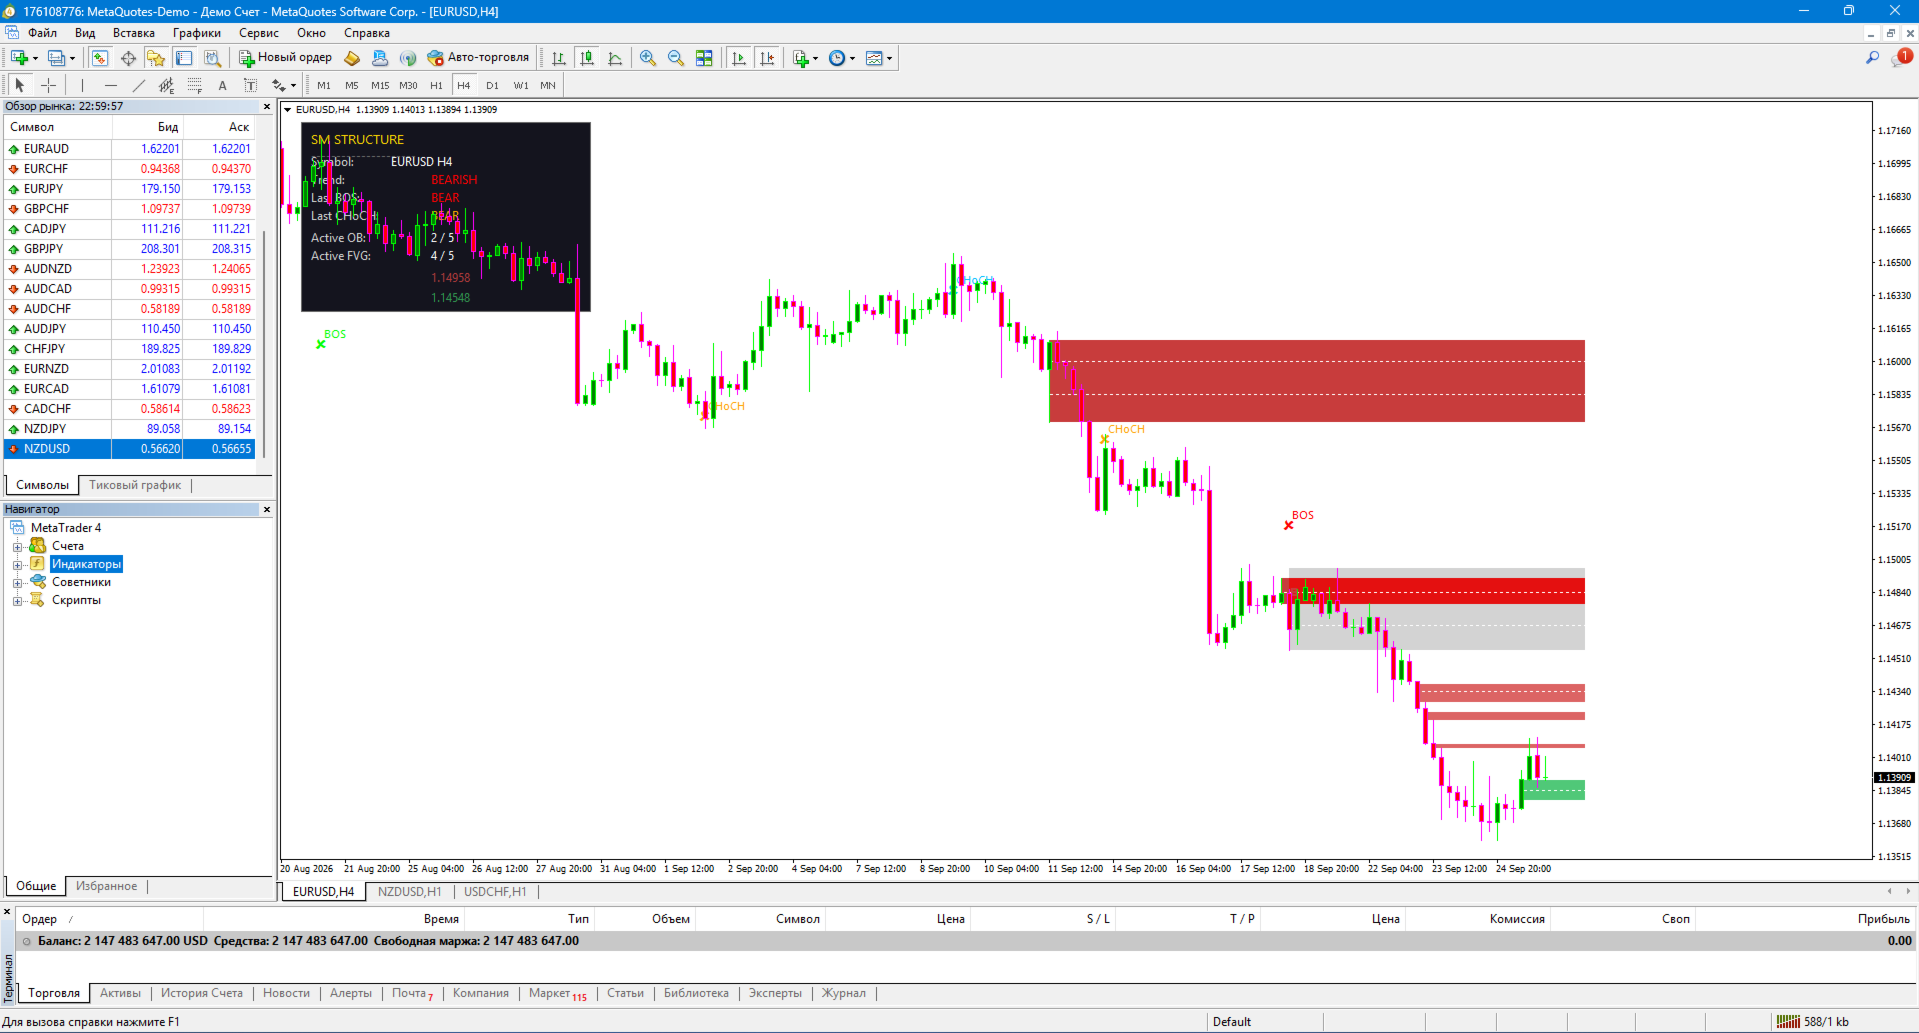
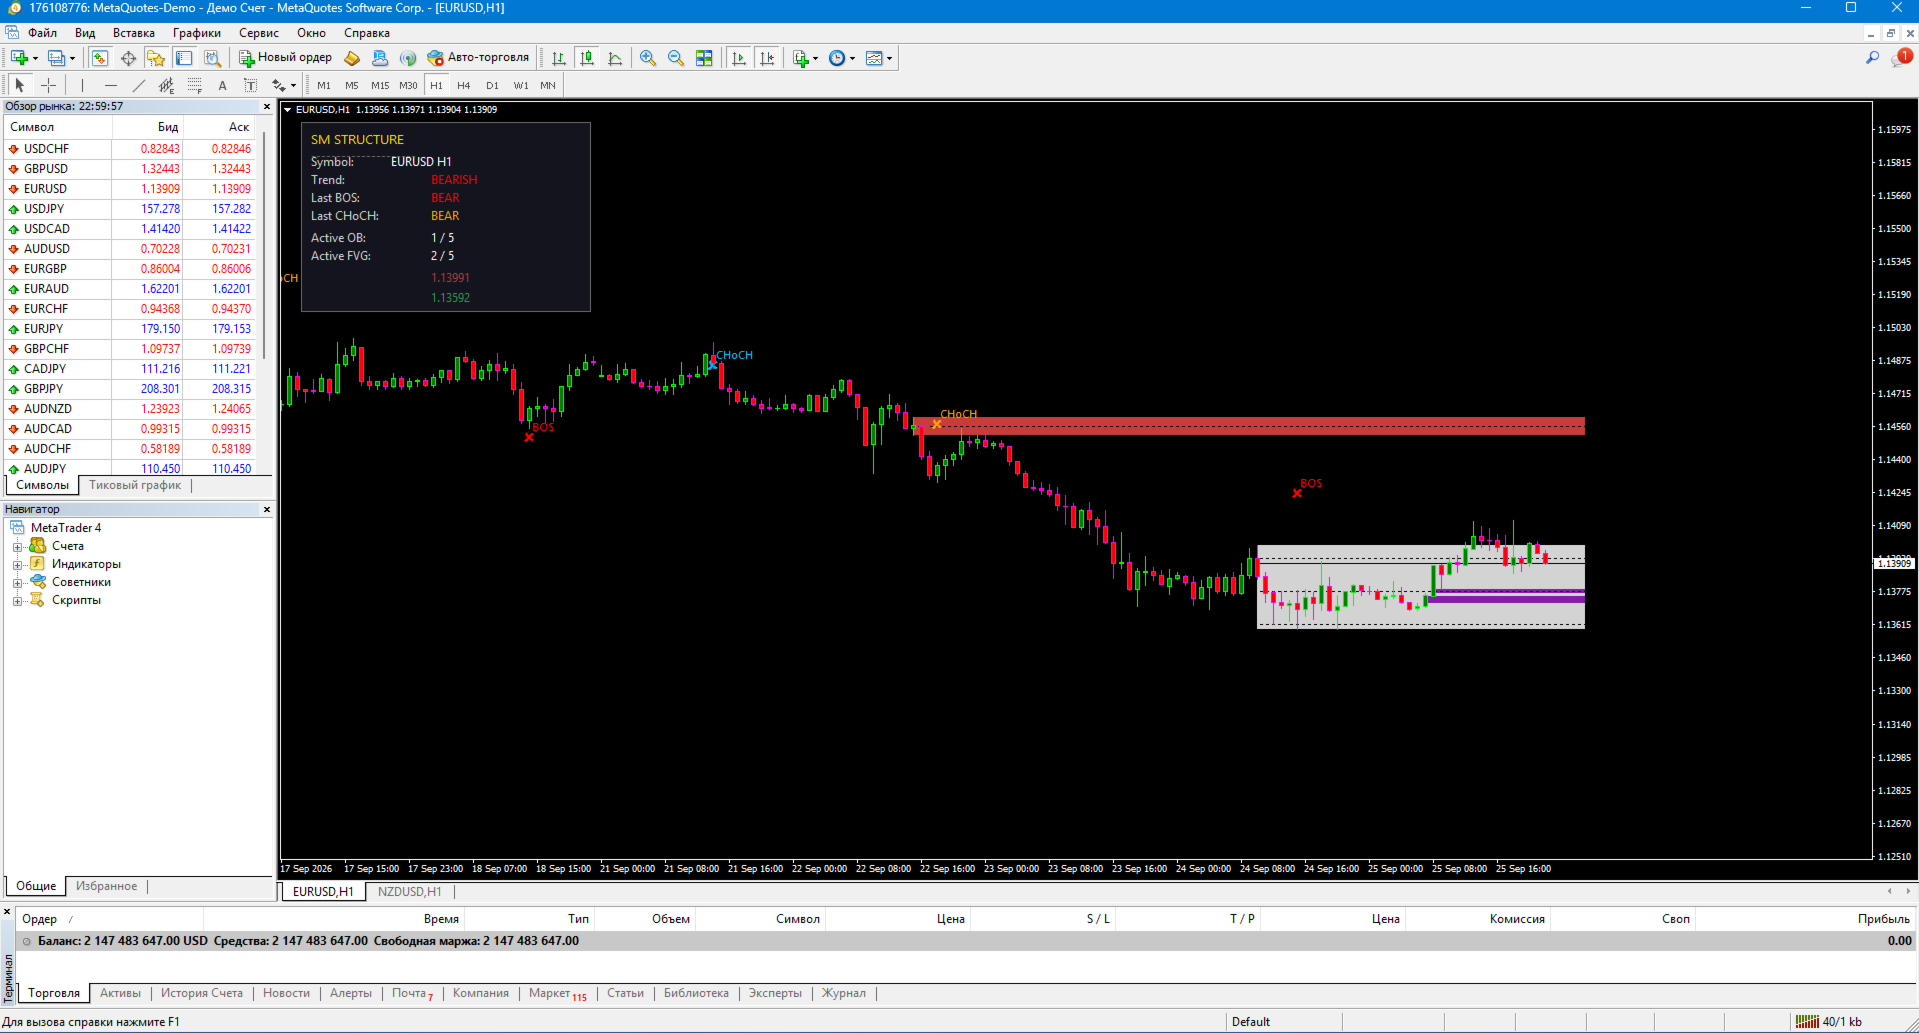
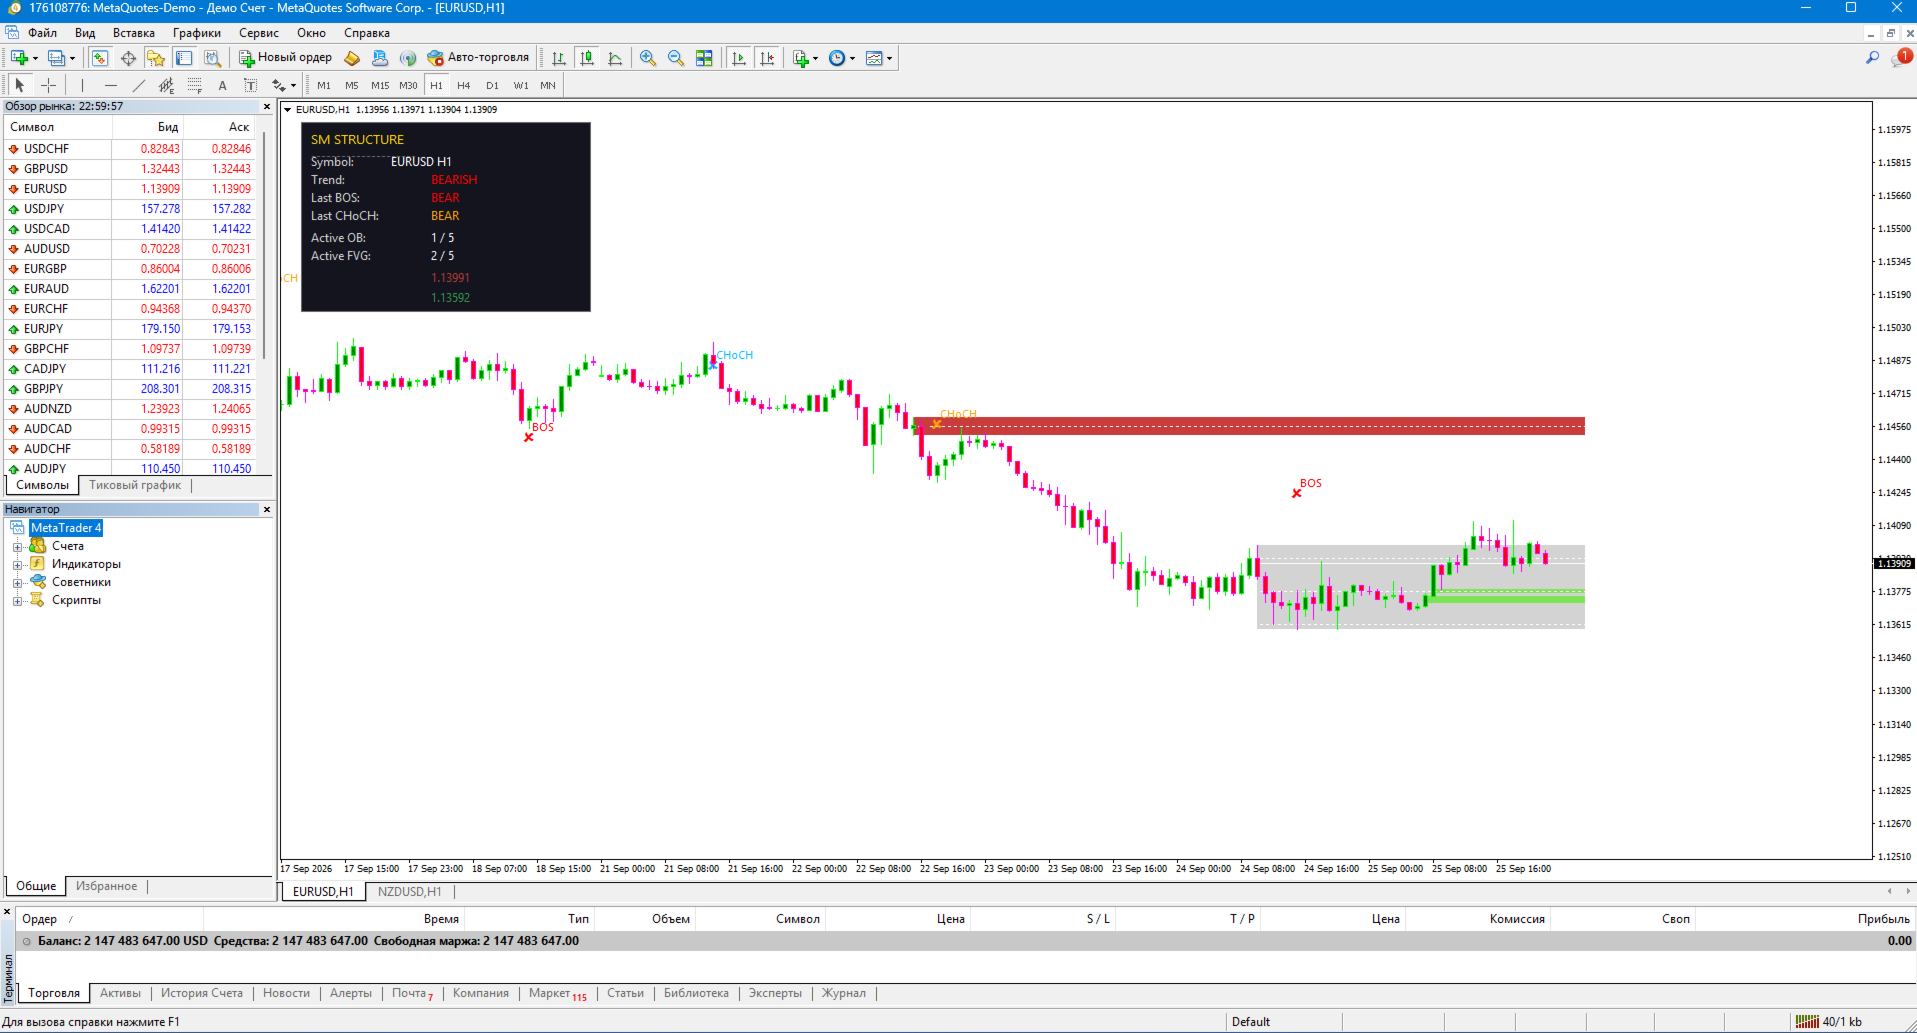
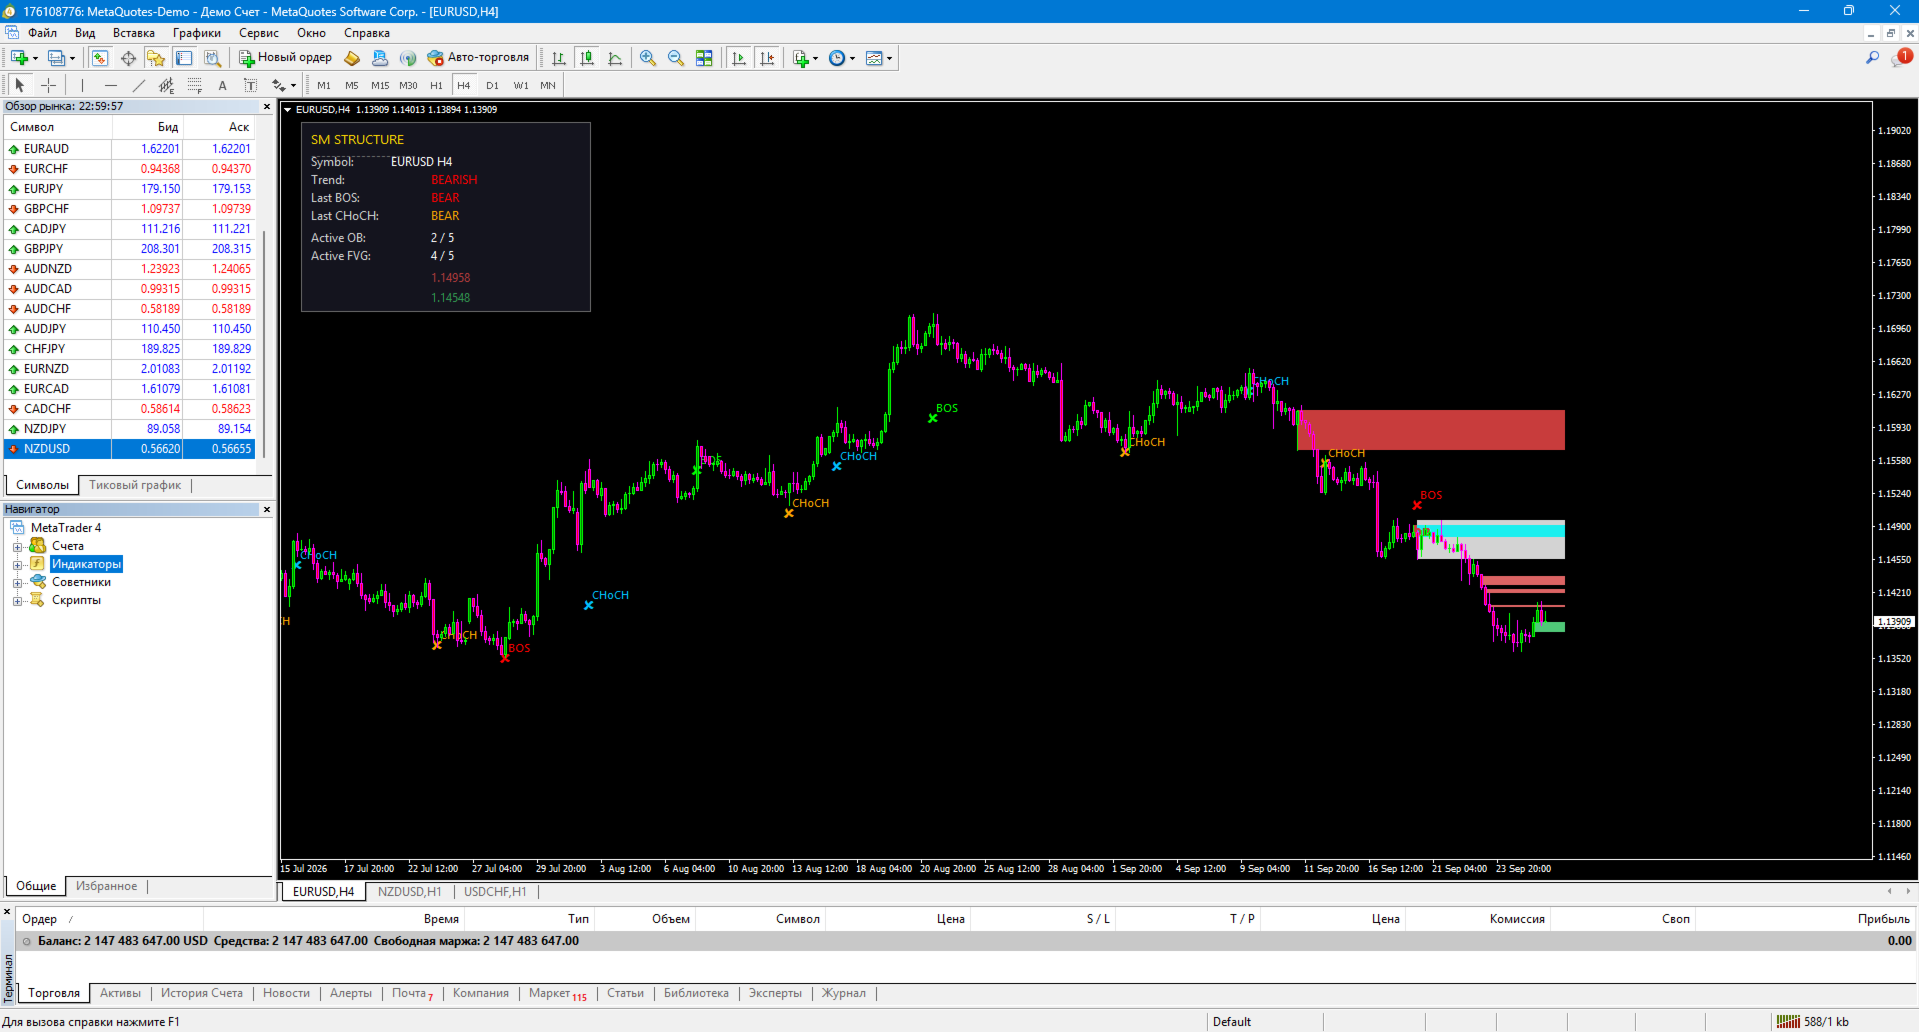
SM Structure PR is a professional indicator for MetaTrader 4 that automatically identifies market structure using Smart Money Concepts (SMC) and ICT methodology. It detects BOS (Break of Structure), CHoCH (Change of Character), Order Blocks, Fair Value Gaps (FVG) and Premium/Discount zones — all in one tool.

Built by a trader with 12 years of live experience. Helps see market structure the way institutional players see it, and find entries in the direction of "smart money".

🎯 What the indicator shows

Market structure:

  • ✅ BOS (Break of Structure) — trend-following structure break

  • 🔄 CHoCH (Change of Character) — first reversal signal

  • 📊 Swing High / Low — key structural points

Smart Money zones:

  • 🟩 Order Blocks — zones where institutional capital opened positions

  • 🟦 FVG (Fair Value Gaps) — imbalances that price typically fills

  • 🔴 Premium zone — upper half of the range (expensive)

  • 🟢 Discount zone — lower half of the range (cheap)

Dashboard:

  • Current symbol and timeframe

  • Trend direction (BULLISH / BEARISH / NEUTRAL)

  • Last BOS and CHoCH

  • Active OB and FVG counts

  • Premium and Discount levels

✨ Key features

📈 Automatic structure detection

The indicator finds swings, marks BOS and CHoCH automatically — no manual chart marking needed. Everything updates in real time.

🎯 Order Blocks with mitigation

Order Blocks are identified as the last opposite candle before the impulse. The indicator tracks mitigation — when price breaks through the zone, it fades or hides (configurable).

📊 Fair Value Gaps (FVG)

Classic three-candle imbalances with a minimum size in points. Active FVGs are highlighted with fill, mitigated ones become faded.

⚖️ Premium / Discount zones

Automatic identification of the upper (Premium) and lower (Discount) halves of the range between the latest significant swings. Classic ICT approach: buy in Discount, sell in Premium.

🚫 Anti-clutter protection

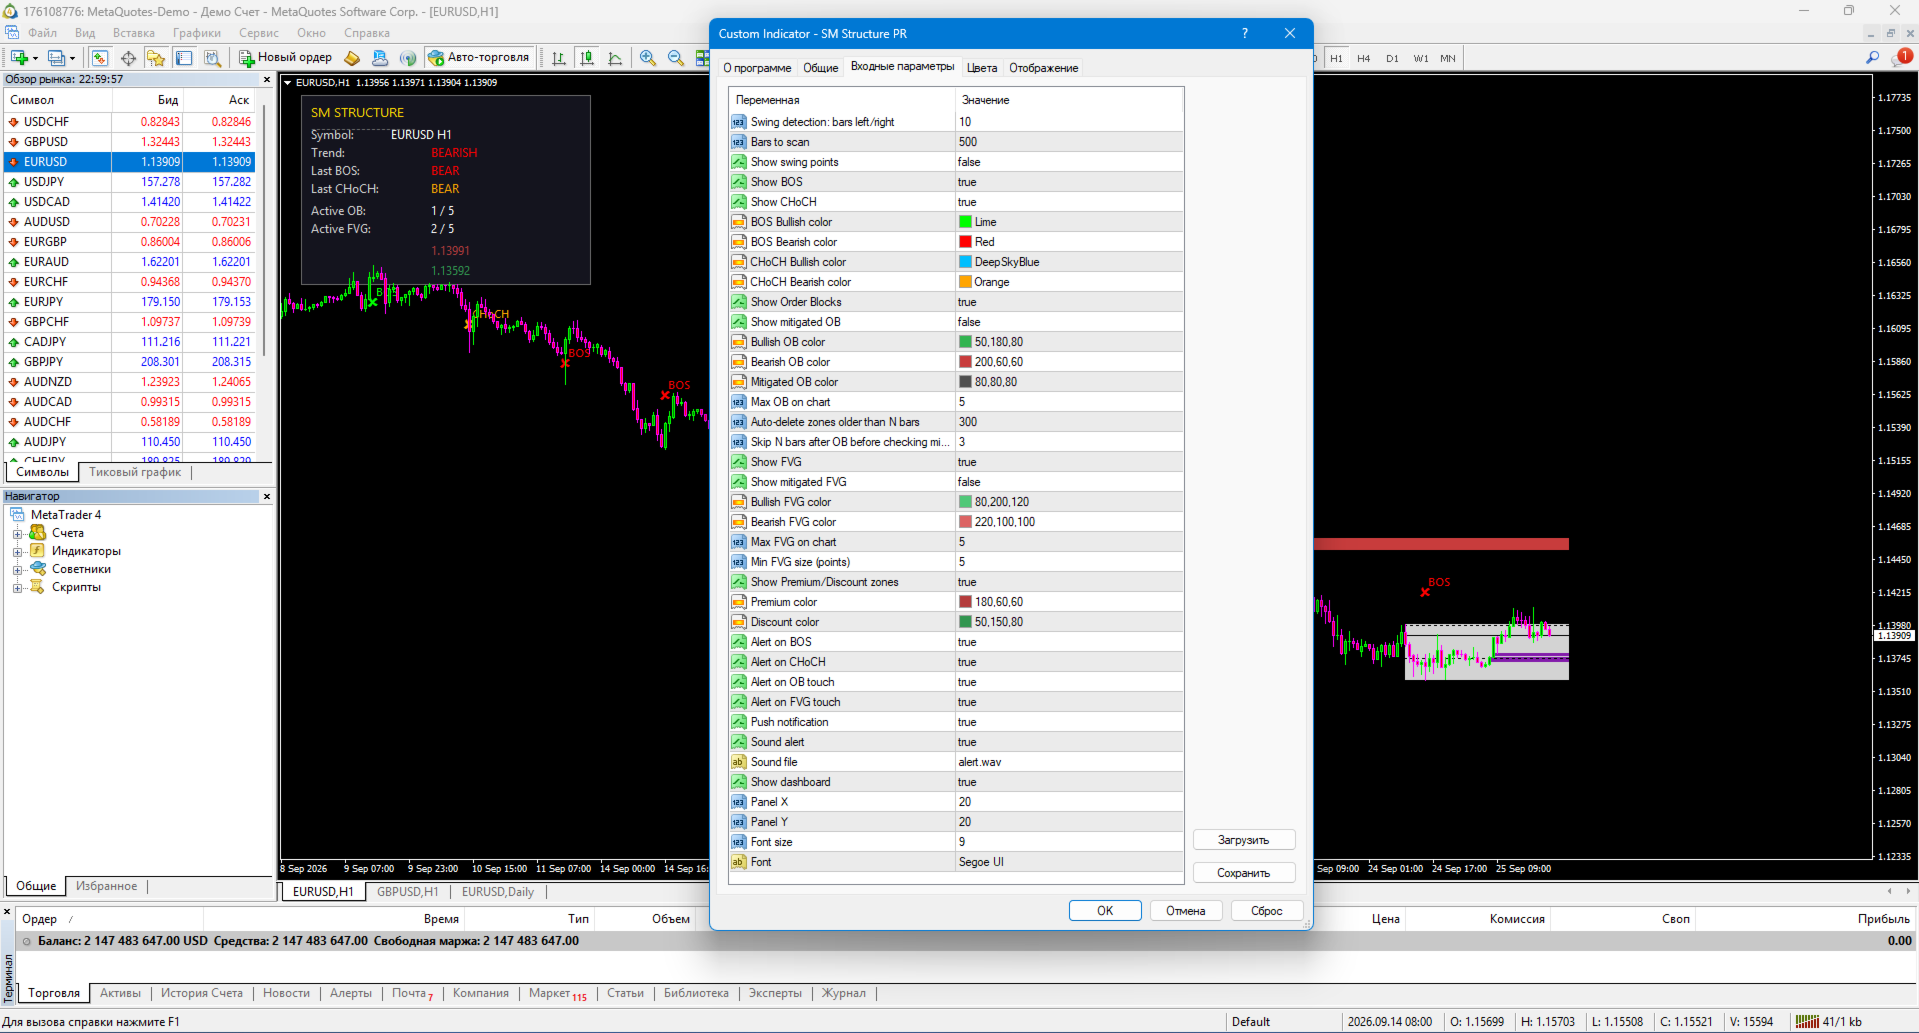
  • Max active OB and FVG (default 5 each)

  • Auto-delete zones older than N bars

  • Skips impulse bars during mitigation check — no false triggers

🔔 Alerts

  • Popup alert

  • Push notification to mobile MT4

  • Sound alert

  • Separate alerts for BOS, CHoCH, OB touch and FVG touch

🎨 Flexible settings

  • Colors and widths of all elements

  • Show/hide swings, mitigated zones

  • Configure number of displayed zones

  • Disable any element

🌍 Cross-platform

Unified logic for MetaTrader 4. Identical signals — can be used on both platforms in parallel.

🛠️ How to use

1. Installation

  • Copy SMStructure.ex4 to MQL4/Indicators/ (MT4)

  • Restart the terminal

  • Drag the indicator onto the chart

2. Tuning by instrument

Instrument SwingBars MinFVGPoints MaxOB MaxFVG
EURUSD, GBPUSD 10 5 5 5
XAUUSD (gold) 10 50 5 5
BTCUSD, ETHUSD 12 500 5 5
US500, NAS100 10 20 5 5

3. Trading scenarios

  • BOS up → bullish trend, buy on retrace to OB or FVG below

  • BOS down → bearish trend, sell on retrace to OB or FVG above

  • CHoCH → possible reversal, wait for confirmation (new BOS)

  • Price in Discount + bullish OB → strong buy signal

  • Price in Premium + bearish OB → strong sell signal

  • FVG + OB in same zone → high-probability zone

4. Recommended timeframes

  • M5–M15 — scalping and intraday

  • H1–H4 — swing trading

  • D1 — medium-term trading

📋 Implementation notes

  • Pure MQL4 — no DLLs, no external dependencies

  • No repaint — signals are stable after bar close

  • Works on any instrument: Forex, crypto, metals, indices, stocks

  • All timeframes: M1 to MN

  • Optimized performance

  • Multilingual interface (planned)

⚠️ Important warning

SM Structure is not a trading system. It's a market structure analysis tool. The indicator doesn't provide 100% buy/sell signals — it shows zones of institutional interest and current structure state.

Using the indicator does not guarantee profit. All trading decisions are made by the trader.

🏆 About the developer

Created by Musa Khunarikov — trader with 12 years of live experience (Forex, stocks, MOEX, metals). 51 certifications from "Finam" training center in trading, algo trading and MetaTrader 4.5 .

Services: EA development, indicators, panels, trading system audit.

📞 Support

30 days of free support after purchase. Bug fixes within 48 hours.

推荐产品
Major Support and Resistance Indicator
Ahmad Ar Abedalaziz Alazaizeh
This indicator filters the Zigzag indicator to calculate the main support and resistance levels. Variables minimum gap between peaks : is the distance (GAP) between the peaks of the Zigzag peaks sensitivity : Minimum number of nearby peaks look back: it means that it has to test the last 50 peaks in the Zigzag object name perfix: a prefix for level’s line name on chart
FREE
RelicusRoad Daily Pivots 是适用于 MetaTrader 4 和 MetaTrader 5 的日内枢轴价位指标,将前一日区间划分为斐波那契价位,并向上下两侧延伸,范围从负 100% 到正 200%。 指标不采用经典的地板枢轴公式,而是把前一个已完成的区间当作一把刻度尺,最低价为 0%,最高价为 100%。图表右侧以紧凑的彩色标记打印出十九个价位,因此今日行情的大小可以直接读作昨日区间的分数或倍数。 工作原理 指标取前一个已完成参考周期的最高价与最低价,并在该区间的每个比例处放置一个价位:价位 = 最低价 + 比例 x(最高价 − 最低价)。周末的 K 线会被跳过,因此周一的参考是上一个交易日。参考周期由图表周期决定。 Inside set, gray:0%、23.6%、38.2%、50.0%、61.8%、78.6% 与 100%。 Above set, green:+123.6%、+138.2%、+150.0%、+161.8%、+178.6% 与 +200%。 Below set, red:-23.6%、-38.2%、-50.0%、-61.8%、-78.6% 与
FREE
UPD1 Fibo Levels
Vitaliy Kuznetsov
5 (3)
该指标分析指定数量的蜡烛并根据高低绘制斐波那契水平。 由于级别正在重新排列,我们对范围的右侧感兴趣。 价格会吸引水平并对触摸做出反应。 使用此工具在修正后找到趋势入口点。 如果在左边我们看到水平已经完美上升,那么我们可以假设我们已经在极值点找到了运动的终点。 所有线条都通过缓冲区或对象绘制(可选)。 输入参数 。 Bars Count - 计算范围 。 Visual Button - 按钮显示(启用/禁用) 。 Corner - 按钮锚定角度 。 X indent - 以像素为单位的水平填充 。 Y indent - 以像素为单位的垂直填充 。 Label Visual - 显示级别标签 。 Label Font Size   - 字体大小 。 Label Shift Bars   - 在酒吧的铭文的缩进 。 Label Tooltip   - 在关卡上方的光标下显示文本 。 Draw Lines   -  使用缓冲区或对象绘制 。 Box Visual   - 启用/禁用框视觉 。 Box Width   - 箱线粗细 。 Box Style   - 框线样式  。 Le
FREE
Wa Candle Timer MT4
Wachinou Lionnel Pyrrhus Sovi Guidi
5 (1)
Wa Candle Timer MT4 是一款强大且用户友好的指标,用于在 MT4 图表中显示当前蜡烛结束前的剩余时间。它帮助交易者把握蜡烛的关闭时间,以便更好地进行交易和决策。该工具现已更新,加入了用户自定义的百分比提醒功能,让交易更高效。 主要功能:   显示当前蜡烛的倒计时   剩余时间低于设置百分比时更改颜色   v3.00 新增:倒计时达到指定百分比时触发提醒   字体和颜色完全可自定义   提升交易中的时间管理和精准度   可自定义设置:   1️⃣ 高于阈值的颜色   2️⃣ 低于阈值的颜色   3️⃣ 字体大小   4️⃣ 字体样式   5️⃣ 提醒触发百分比(例如:80%、95% 等) 该指标适合所有依赖于蜡烛时间控制的交易者,帮助您把握每一个关键时机。
FREE
Pivot Points Classic and Camarilla 直接在图表上绘制经典枢轴点位(P、R1-R3、S1-S3)和 Camarilla 位(H1-H4、L1-L4)。这些价位根据所选时间周期(默认 D1)上一个周期的最高价、最低价和收盘价计算,每个周期都会在其适用的时间段上绘制一条水平线,因此您可以看到价格在之前的几天、几周或几个月对这些价位的反应。 功能 经典枢轴点 - 中心枢轴 P,以及三个阻力位(R1-R3)和三个支撑位(S1-S3) Camarilla 枢轴点 - 八个价位 H1-H4 和 L1-L4;H3/L3 和 H4/L4 绘制得更粗,因为这是 Camarilla 交易者最关注的价位;在经典模式中,枢轴 P 和外侧价位 R3/S3 更粗 经典、Camarilla 或两者同时显示 在同一图表上;经典线条为实线,Camarilla 线条默认使用虚线样式(线条样式可在输入参数中更改) 任意来源时间周期 - 日内图表上显示日线枢轴点,更大周期的图表上显示周线或月线枢轴点 过往周期历史 - 1 到 200 个周期,便于研究价格在这些价位附近的表现 价位根据上一个已收
FREE
This indicators automatically draws the Support and resistances levels for you once you've dropped it on a chart.  It reduces the hustle of drawing and redrawing these levels every time you analysis prices on a chart. With it, all you have to do is dropped it on a chart, adjust the settings to your liking and let the indicator do the rest.  But wait, it gets better; the indicator is absolutely free!  Get the new and improved version here:  https://youtu.be/rTxbPOBu3nY Parameters Time-frame  -> T
FREE
UPD1 Impulse Shadow
Vitaliy Kuznetsov
该指标根据波动率自动搜索并显示图表上的大阴影。 阴影被波的大小额外过滤. 该算法通过指定范围内的阴影分析分形分解并显示水平。 在设置中,您可以启用多币种仪表板。 警报在当前计划或整个仪表板工作表之间进行选择。 大阴影和那些已经突破分形水平的信号可以单独打开。 Blog-Link -   Retest and Fake Breakout with UPD1 。 交易模式: +按趋势重新测试 +假故障 +其他 EURUSD, GBPUSD, XAUUSD, ... M15, M30, H1 。 输入参数 。 主要 。 Bars Count – 要显示的条数 。 ATR Period - 计算波动性的烛台数量 。 ATR Coeff Shadow (0 - Off) – 阴影大小系数(相对于平均波动蜡烛) 。 ATR Coeff Impulse (0 - Off) – 波大小系数(仅在超过指定系数的波中搜索的阴影的滤波器,其中1是平均计算波) 。 Max Line Length - 以酒吧为单位的最大水平长度 。 Min Line Length - 以酒吧为单位的最小水平长度 。
The price is moving between two curve tunnel lines in a trend. The two lines of a tunnel represent support and resistance. In an uptrend, for instance, a trade might be entered at the support of the trend line (shown by the red line in the chart) and exited at resistance of the upper tunnel line (shown by the blue line). Tunnel show trend direction for any timeframe (if you have enough bars on the chart for higher timeframes). Trend, or price tunnel, can be up, down or sideways. If the current p
pivot points using by many traders and pivot levels most of the times are very helpfull . this indicator is a custom with internal parameters. it can show two times pivot (weekly and daily). you can choose periods total for each time showing pivots.( 1 week , 2 week ,...1day , 2day ,...) when use weekly and daily pivots , it can show you many support and resistance zones. if have proposal comment too me for upgrading indicator.

FREE
Auto Fibo Retracement MT4
Nguyen Tuan Son
3.75 (4)
Auto Fibonacci Retracement Indicator — Flexible and Reliable This is not just another Auto Fibonacci Retracement indicator — it’s one of the most flexible and dependable tools available . If you find it useful, please leave a review or comment to support the project. Check out my other helpful tools below: Telegram to MT4 using AI   - AI-Powered Signal Copier Bot Timeframes Trend Scanner    - Scan the trend of assets in difference timeframes with multiple indicators Market Trend Scanner   - Scan
FREE
BuySell FibPiv
Huu Tri Nguyen
BuySell FibPiv Fibonacci Pivot Level Indicator with Dynamic Support and Resistance Zones Overview BuySell FibPiv is a Fibonacci pivot-based technical analysis indicator designed to calculate dynamic support and resistance levels using previous session price data. The indicator applies Fibonacci expansion and retracement calculations to generate multiple pivot-based levels for intraday and swing trading analysis. It provides: Central pivot calculation Fibonacci-based support and resistance zones
Peak Trough Analysis is the great tool to detect peaks and troughs in your chart. Peak Trough Analysis tool can use three different peaks and troughs detection algorithm. The three algorithm include the orignal Fractals Indicator by Bill Williams, the Modified Fractals indicator and ZigZag indicator. You can use this peak and trough analysis tool to detect the price pattern made up from Equilibrium Fractal-Wave process. For further usage, there are good guide line on how to use this peak trough
FREE
Multi Timeframe ZigZag Indicator
Salman A A A T Bakhash
5 (2)
Description: This indicator draw ZigZag Line in multiple time frame also search for Harmonic patterns before completion of the pattern. Features: Five instances of ZigZag indicators can be configured to any desired timeframe and inputs. Draw Harmonic pattern before pattern completion. Display Fibonacci retracement ratios. Configurable Fibonacci retracement ratios. Draw AB=CD based on Fibonacci retracement you define. You can define margin of error allowed in Harmonic or Fibonacci calculations
FREE
Raymond Cloudy Day Indicator for MT4 – Pivot-Based Reversal and Trend Levels Raymond Cloudy Day Indicator is a pivot-based level indicator for MetaTrader 4 (MT4). It was developed by Ngo The Hung based on Raymond’s original idea and is designed to give a structured view of potential reversal zones, trend extensions and support/resistance levels directly on the chart. The default settings are optimised for XAUUSD on the H1 timeframe, but the indicator can be tested and adjusted for other symbols
TCL Auto Pivot Points
Stratos Digital (PVT) Ltd
TCL Auto Pivot Points is a daily, weekly, and monthly pivot-point indicator for MetaTrader 4. It calculates classic institutional support and resistance levels (R1 through R3 and S1 through S3) using a choice of four formulas and plots them automatically on the chart. What It Plots The indicator draws seven horizontal lines: the central Pivot Point (P), three Resistance levels (R1, R2, R3) above it, and three Support levels (S1, S2, S3) below. The lines update at the start of each pivot period (
FREE
免费 — ZigZag 摆动枢轴点加上移动平均趋势过滤器,绘制在同一图表上。它显示枢轴突破系统所依据的枢轴水平和趋势背景。针对黄金(XAUUSD)调校。 完全免费,无任何限制。如果它在您的图表上派上用场,一条简短的评价对我们帮助最大——只需30秒,这也是其他交易者发现这款工具的唯一途径。 平台: MetaTrader 4(本页面)。 枢轴突破只有在顺应更大趋势的方向时才有意义。本指标标记每一个确认的摆动枢轴,并绘制一条趋势移动平均线,让你一眼就能看出上一个枢轴的突破是顺势还是逆势。 === 它绘制什么 === - 已确认的 ZigZag 摆动高点和低点(圆点)——突破系统所响应的枢轴。 - 趋势移动平均线(默认 MA 50)。 === 已确认枢轴不重绘 === 只有当一个枢轴被确认为其窗口内的局部极值后才会绘制出来。已确认的枢轴不会移动。(与所有 ZigZag 一样,最近仍在形成的那一段是临时的,直到出现新的极值加以确认——这是摆动检测的固有特性,而非缺陷。) === 设置 === - ZZDepth(默认 12)、ZZDev(默认 5)、ZZBackstep(默认 3):
FREE
SRP (Strong Retracement/Reversal Points) is a powerful and unique support and resistance indicator. It displays the closest important levels which we expect the price retracement/reversal! If all level are broken from one side, it recalculates and draws new support and resistance levels, so the levels might be valid for several days depending on the market! Key Features You can use it in all time-frames smaller than daily! Displays closest significant support and resistance levels Update the le
FREE
Pivot Points MT4
KEENBASE SOFTWARE SOLUTIONS
KT Pivot Points 会根据最新市场数据自动在图表上绘制每日、每周和每月的枢轴点位。这是外汇市场中广泛使用的技术分析工具之一,用于识别潜在的支撑和阻力区域。 功能特点 当价格触及枢轴点时发送提醒。  每种枢轴点类型都支持全面自定义。   无须复杂设置即可显示日线、周线和月线的枢轴点位。 占用 CPU 资源极少,计算速度快。 可与图表上的其他指标兼容使用。 什么是枢轴点 枢轴点是通过上一交易日(或交易周期)的最高价、最低价和收盘价计算出的平均值。  通过计算得出的枢轴点可以预测未来的支撑和阻力位,帮助判断价格在这些关键水平附近的走势。 通常认为,如果价格高于枢轴点,市场情绪偏多;反之,则偏空。 枢轴点计算公式 我们使用前一天、一周或一个月的最高价、最低价和收盘价来计算枢轴点水平。 P = (H + L + C) / 3 R1 = P + (P − L) = 2×P − L S1 = P − (H − P) = 2×P − H R2 = P + (H − L) S2 = P − (H − L) R3 = H + 2×(P − L) = R1 + (H − L) S3 =
Clever Trend Swing Levels
Carlos Forero
4.22 (9)
描述: 该指标通过之字形指标衡量趋势或修正水平。 它在图表中显示了检测到的每个低或高电平。 该指标有何用处? 该指标根据之字形参数确定趋势是开始,发展还是结束 该指标确定趋势的方向 组件 水平为正数或负数,取决于趋势的方向和回撤的数量。 其他建议指标 CEF计数水平旨在通过以下指标来工作和补充其信号: 一般指标 选择最佳货币进行交易(CEF点差货币点差) 趋势指标 确定趋势级别(CEF计数级别)(实际指标) 确定趋势强度(CEF趋势力) 信号工具 完整的策略信号指示器(CEF Scalper Pro) 查找订单块模式(CEF订单块信号) 查找市场市场格局(CEF TDI Pro信号) 其他非常有用的工具 确定范围扩展或收缩的概率(CEF范围预测器)
FREE
-- 简单而有效。 反转指标 - 是什么? 一种结合超级趋势逻辑与指数曲线技术的趋势跟随叠加指标。它能识别趋势方向,在图表上绘制动态通道,并在趋势反转时发送实时警报。 工作原理 该指标通过ATR与超级趋势因子计算指数基准线。当价格收盘突破该基准线时,确认趋势反转。绿色箭头标记买入趋势启动,红色箭头标记卖出趋势启动。 功能特性: 基于ATR的指数趋势基准线与动态通道 绿色/红色趋势线及填充通道 趋势反转时的买入/卖出箭头信号 内置警报:弹窗、推送通知、邮件、声音 重复警报防护(每根K线仅触发一次警报) 完全可定制:颜色、线条粗细、箭头尺寸、通道宽度 无延迟的简洁图表叠加层 输入参数: 指数速率、超级趋势因子、ATR周期、通道宽度 开关控制:通道填充、箭头、各警报类型 所有视觉元素支持全色系定制 最佳适用场景:任意品种、任意周期。适用于外汇、指数、大宗商品及加密货币图表。
FREE
交易实用必备工具指标 波浪自动计算指标,通道趋势交易 完美的趋势-波浪自动计算通道计算 , MT4版本 完美的趋势-波浪自动计算通道计算 , MT5版本 本地跟单复制交易 Easy And Fast Copy , MT4版本 Easy And Fast Copy , MT5版本 本地跟单复制交易 模拟试用 Easy And Fast Copy , MT4 模拟账号运行 Easy And Fast Copy , MT5 模拟账号运行 顺势指标又叫CCI指标,CCI指标是 美国 股市 技术分析   家唐纳德·蓝伯特(Donald Lambert)于20世纪80年代提出的,专门测量股价、外汇或者贵 金属 交易是否已超出常态分布范围。属于超买超卖类指标中较特殊的一种。波动于正无穷大和负无穷大之间。但是,又不需要以0为中轴线,这一点也和波动于正无穷大和负无穷大的指标不同。 相对强弱指标RSI是根据一定时期内上涨点数和下跌点数之和的比率制作出的一种技术曲线。能够反映出市场在一定时期内的景气程度。由威尔斯.威尔德(Welles Wilder)最早应用于期货买卖,后来人们发现在众多的图表技术分析中,
FREE
Harmonic Pattern Plus MT4
Young Ho Seo
4.44 (18)
Introduction Harmonic Patterns are best used to predict potential turning point. Traditionally, Harmonic Pattern was identified manually connecting peaks and troughs points in the chart. Manual harmonic pattern detection is painfully tedious and not suitable for everyone. You are often exposed under subjective pattern identification with manual pattern detection. To avoid these limitations, Harmonic Pattern Plus was designed to automate your harmonic pattern detection process. The functionality
Liquidity Grab X — Liquidity Sweep & Grab Detector (MT4 & MT5) Liquidity Grab X automatically detects buyside and sellside liquidity sweeps (stop-hunts) at swing pivots and classifies each grab by strength — helping you spot exhaustion moves and potential reversal zones in real time, with instant push notifications to your phone. Full Description Liquidity Grab X is a free rule-based indicator for MetaTrader 4 and MetaTrader 5 that identifies liquidity grabs — moments where price sweeps above a
FREE
MP Demark Pivot Levels
Pierre Ksachikian
4 (1)
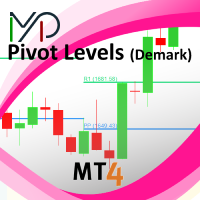
This indicator is stand alone version from  MP Pivot Levels  (All in one) containing Demark's Pivots. Calculations:     PP = X / 4     R1 = X / 2 - LOWprev     S1 = X / 2 - HIGHprev Uses: When the pair currency price may change the direction of movement. Possible constraints of support and resistance that creates plateaus for the currency pair prices. Tendency identification by comparing the present prices according to current day's pivot point and also the prior day's pivot points. ____________
FREE
Pivot Trend
Harun Celik
5 (2)
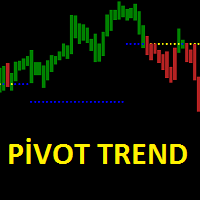
Pivot trend indicator is a trend indicator that uses standard pivot calculation and some indicators. The purpose of the indicator is to calculate the possible trends using the pivot point. And to give the user an idea about trend direction. You can use this display as a trend indicator. Or with other indicators suitable for your strategy. Features The green bar represents the upward trend. The red bar represents the downward trend. The blue pivot point represents the upward trend. The yellow pi
Trend formation channel is a set of lines. The two central lines of the indicator represent moving averages of the specified type and period, they also form a small channel. The large channel is formed - the central lines of the indicator plus / minus the standard deviation estimate, multiplied by the coefficient selected by the user. The basic rule for plotting is that about 5% of prices should be outside these lines, and 95% - inside. If the price crosses the upper or lower line too often, th
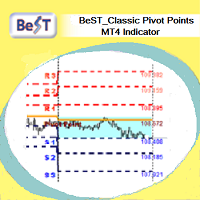
BeST_ Classic Pivot Points is an MT4 Indicator that is based on the widely known and definitely classic Pivot Point of a market prices activity. A pivot point is calculated as an average of significant prices (high,low,close) from the performance of a market in the prior trading period. If the market in the following period trades above the pivot point it is usually evaluated as a bullish sentiment, whereas trading below the pivot point is seen as bearish. A pivot point and the associated suppo
FREE
Convenient drawing of parabolic channels by four points (two lower and two upper extremums). Additional control keys: N (New) - Start drawing a new channel. C (Clear) - Deletes the current channel. By default, the current channel is the last channel. But you can click on the line of any channel to make it current. Click on the gear in the upper right corner to set some parameters for all channels or the current channel. All work is visible from the animated Gif. Channels are saved when the time
FREE
ZigZag on average
Valeriy Medvedev
4.5 (2)
This is a well-known ZigZag indicator. But it differs by the fact that its plot is based on values of the middle line which is set by a user. It can display Andrews’ Pitchfork and standard or Bobokus Fibo levels. NO REPAINTING. Parameters Period МА — middle line period. Default value is 34. Minimum value is 4. Maximum value is set at your discretion. Used to calculate price - base price to calculate the middle line. The averaging method - method of smoothing the middle line. Turning pitchfork —
FREE
Aura Mini 蜡烛计时器 - 智能交互版 Aura Mini 蜡烛计时器是一款轻量级指标,它以极小的图表空间占用,直观地显示多个时间周期 (MTF) 的剩余蜡烛时间和当前蜡烛方向。 该指标的核心功能在于其交互性。无需打开指标设置窗口,您只需点击图表上的计时器面板,即可实时切换 7 个主要时间周期。 [主要功能] 一键切换时间周期:每次点击计时器面板,时间周期将按以下顺序立即切换:M1 M5 M15 M30 H1 H4 D1。 独立时间周期追踪:无论当前图表的时间周期如何,您都可以独立监控计时器上选定的特定时间周期的收盘时间和方向。 基于K线方向的动态颜色:面板背景颜色会根据所选时间周期的当前价格(收盘价)和开盘价(开盘价)进行直观调整。 阳线:深绿色 阴线:砖红色 价格线追踪界面:计时器面板会自动调整其垂直(Y轴)位置,以与当前买入价线对齐。它简洁地显示在图表右侧边缘,不会遮挡您的交易视野。 轻量级且优化:旨在最大限度地减少图表和电脑资源占用,即使同时应用于多个图表也能确保流畅运行。 [输入参数] X轴偏移(距右侧的距离):调整计
FREE
该产品的买家也购买
Quant Direction
Georgios Kalomoiropoulos
Quant Direction 是一款三维市场分析工具。它通过同时计算多个维度上的精确百分比偏差,提供完全客观的、基于算法的市场分析视角。该算法采用先进的人工智能建模工具开发,并经过全面测试,旨在以独特的精准度解读市场。它可以分析您平台上的任何货币对或金融工具。 无论您是短线 交易者、日内 交易者还是波段交易者,Quant Direction 都是您的理想之选。 交易者的真正优势 Quant Direction 的真正优势在于彻底消除情绪、屏幕疲劳和过度思考。它无需手动点击十几个图表来寻找方向并反复质疑自己的偏好,引擎即可在几毫秒内即时处理 8 个时间周期(从 5 个月到月线)。它能准确告诉你任何时刻谁在掌控市场,确保你始终朝着概率最高的方向进行交易。 市场分析的三个维度 该算法将市场分为三个不同的交易维度,为您提供完整的宏观和微观视角: 超短线交易分析: 捕捉即时、快速的动量变化和较低时间框架的执行点。 日内分析: 识别真实的、潜在的每日方向性偏差。 波动分析: 专注于宏观趋势,确保您不会与大盘机构的走势背道而驰。 独家评分引擎 Quant Direction 的底层采用了一套
Hidden Cycles
Lev Vladimirovic Marushkin
5 (1)
The Only 100% Universal Tool! Stop trading against nature! This is your chance to secure the only indicator rooted in the absolute laws that govern the entire universe. Most tools guess—this one reveals the truth. Buy another toy or buy the truth. Your choice... Based on Universal Laws — NOT Some Guy’s Algorithm: Let the market adjust to the Hidden Cycles Geometry — not the other way around. Most indicators are based on a man-made formula. They often lag, fail over time, or need constant re-o
Super Signal – Skyblade Edition 專業級無重繪 / 無延遲趨勢信號系統,擁有卓越勝率 | 適用於 MT4 / MT5 在較低的時間週期上效果最佳,例如 1 分鐘、5 分鐘與 15 分鐘圖表。 核心特色: Super Signal – Skyblade Edition 是一套專為趨勢交易設計的智能信號系統。 其採用多重濾波邏輯,僅篩選出具有明確方向性、動能強勁且波動結構健康的走勢進場點。 本系統 不預測高點或低點 ,只有在同時滿足以下三項條件時才會觸發交易信號: 趨勢方向明確 動能持續增強 波動率結構穩定 此外,系統還結合市場流動性分析,以進一步提升信號的準確性與觸發時機。 信號特性: 所有箭頭信號皆為 100% 無重繪,無延遲 信號一旦出現即固定於圖表,不會閃爍或消失 提供圖表箭頭、資訊面板、彈出通知、聲音提示及推播訊息 支援 EA 呼叫(Buffer 輸出),可整合至自動化交易或信號跟單系統 提供預設參數模板,免調整即可使用,適合新手快速上手 總結: Super Signal – Skyblade Edition 是一款邏輯清晰、穩定高效的專業趨勢型
Neuro Poseidon MT4
Daria Rezueva
4.74 (46)
Neuro Poseidon is a new indicator by Daria Rezueva. It combines precise trading signals with adaptive TP/SL levels - creating best possible trades as a result! Message me and get  Neuro Poseidon Assistant  as a gift to automize your trading process! What makes it stand out? 1. Proven profitability on all assets and timeframes 2. Only confirmed BUY and SELL signals present on the chart 3. Adaptive TP & SL levels generated by the software for each trade 4. Easy to understand - suitable for all
Gold Channel XAUUSD
Paulo Rocha
5 (4)
Gold Channel is a volatility-based indicator, developed with a specific timing algorithm for the XAUUSD pair, which consists of finding possible corrections in the market. This indicator shows two outer lines, an inner line (retracement line) and an arrow sign, where the theory of the channel is to help identify overbought and oversold conditions in the market. The market price will generally fall between the boundaries of the channel. If prices touch or move outside the channel it is a tradi
目前八折优惠! 对任何新手或专家交易者来说都是最好的解决方案! 这个仪表板软件适用于28种货币对。它基于我们的两个主要指标(高级货币强度28和高级货币冲动)。它对整个外汇市场提供了一个伟大的概述。它显示高级货币强度值,货币运动速度和28个外汇对在所有(9)时间段的信号。想象一下,当你可以使用图表上的单一指标观察整个市场,以确定趋势和或剥头皮的机会时,你的交易将得到改善 我们已经在这个指标中建立了一些功能,使你更容易识别强势和弱势货币,同时识别和确认潜在的交易。该指标以图形方式显示货币的强势或弱势是增加还是减少,以及它在所有时间段的表现。 增加的新功能是动态市场斐波那契水平,它适应当前的市场条件变化,这是一个已经在我们的高级货币强度28和高级货币冲动指标中使用的成熟的加分项。 在交易时,总是将弱势货币和强势货币配对,这个新指标将帮助你做到这一点。 用户手册:点击这里  https://www.mql5.com/en/blogs/post/708783 特点  显示每个时间段的ACS28和GAP-speed(冲动)的货币强度值。 列:颜色代码以7种颜色显示货币强度:强势
Supply and Demand Dashboard PRO
Bernhard Schweigert
4.81 (21)
目前八折优惠! 这个仪表板是一个非常强大的软件,可用于多个符号和多达9个时间段。 它是基于我们的主要指标(最佳评论:高级供应需求)。 Advanced Supply Demand 该仪表板提供了一个伟大的概述。它显示。   筛选后的供需值,包括区域强度评级。 区间内和区间外的点位距离。 它突出了嵌套的区域。 在所有(9个)时间段内,它对所选符号发出4种警报。 它是高度可配置的,以满足您的个人需求! 您的利益! 对每个交易者来说,最重要的问题是。 什么是入市的最佳水平? 在强大的供应/需求区域内或附近进入你的交易,以获得最佳的成功机会和风险/回报。 我的止损的最佳位置是哪里? 把你的止损放在强势供应/需求区的下方/上方是最安全的。 我的最佳盈利目标是什么? 你的退出策略和你的进入策略一样重要,了解更高的时间框架图可以帮助你。对于买入,使用下一个供应区作为目标,对于卖出,使用下一个需求区作为目标。在回撤到供应区或需求区时进场,以确保有足够的利润空间,达到更高的时间框架的供应和需求,将增加你的利润。 为什么我们要过滤强区和弱区? 不平衡性越大,价格的变动就
Miraculous Indicator Binary & Forex v3 StrategySafe Miraculous Indicator Binary & Forex v3 StrategySafe 是一款专业交易指标,适合希望获得清晰信号、强大确认工具以及结构化交易方式的 Binary 和 Forex 交易者。 v3 版本加入了 MIR Dashboard、Miraculous Confirmation Dashboard、GANN Law、Square of 9 水平线、GANN 角度以及更强的 Forex 分析模式。 核心功能 同时支持 Binary 和 Forex 交易模式。 MIR Dashboard 可快速读取市场状态。 Miraculous Confirmation Dashboard 用于确认交易机会。 GANN Law drawing lines 用于 Forex 市场结构分析。 Square of 9 线条、方向和关键价格水平。 1x1 GANN Angle 用于判断趋势压力。 Entry Information TP 帮助寻找合理止盈区域。 Strateg
Dinapoli Package MT4
Samil Bozuyuk
5 (1)
All in One package includes the  Oscillator Predictor ,  MACD Predictor ,  Thrust Scanner  and  Advanced Fibonacci  indicators which are mandatory for applying  Dinapoli  trade plans.  Please visit below links for detailed explanations of indicators. Advanced Fibonacci Indicator =>  https://www.mql5.com/en/market/product/52834 Thrust Scanner Indicator => https://www.mql5.com/en/market/product/52830 Overbought /Oversold Predictor indicator => https://www.mql5.com/en/market/product/52621 Macd P
BTMM State Engine Pro MT4
Garry James Goodchild
BTMM State Engine Pro by G-Labs — Beat The Market Maker indicator for MetaTrader 4. Asian session range, London and New York kill zones, level progression (L1/L2/L3), peak formation detection (PFH/PFL), entry signals, and a multi-pair scanner from one chart. Stop scanning charts one pair at a time. The State Engine tracks the BTMM daily cycle automatically — Asian box, room boundaries, level blocks, peak formations, and filtered entries — while the scanner dashboard shows level, peak status,
需要自动下单?另有MT5 EA版本 Gold Signal Pro EA with Auto TP SL是单独销售的MT5 EA,为GOLD M5/M15组合内置Gold Signal Pro引擎、信号筛选、自动下单、自动TP/SL与风险设置。可选择信号查看或自动执行。EA可独立运行,不包含在本指标购买中,也不能在MT4运行。 查看EA功能、面板和价格 KURAMA GOLD SIGNAL PRO(MT4)— 7层过滤 · 自动止盈止损 · 质量评分 · 信号历史保存 | 完整的XAUUSD交易系统 实时不重绘。信号出现的瞬间,箭头、入场、止盈、止损当场锁定,之后绝不移动。你交易的就是这个实时信号。而且在v7.20中,每一个真正发出的信号都会自动保存,并在重启后精确还原。 购买者专属赠品 购买永久授权,即可免费获得 AI Zone Radar(价值$59)+ 完整PDF手册。在产品价格之外,额外附赠价值$59的赠品。购买后在MQL5上给我留言即可。 AI Zone Radar: https://www.mql5
GoldRush Trend Arrow Signal
Kirk Lee Holloway
5 (2)
GoldRush 趨勢箭頭信號 GoldRush 趨勢箭頭信號 指標為 XAU/USD 中的高速、短期短線交易者提供精確、實時的趨勢分析。 專為1分鐘時間框架設計,此工具顯示方向箭頭以明確顯示入場點,使短線交易者能在波動市場中自信操作。 該指標包含主要和次要警示箭頭。主要信號為白色和黑色方向箭頭,用於指示趨勢方向的轉變;次要信號為藍色和紅色箭頭,用於確認主要箭頭指示的方向並提示潛在交易入場點。 注意:當趨勢方向發生變化後僅出現一個主要警報箭頭時,請注意可能會出現多個次要藍/紅箭頭。次要信號將在滿足信號標準的任何蠟燭圖後出現,因此在長期趨勢移動中,螢幕上將顯示大量次要箭頭(如附帶的截圖所示)。您可在設置中開啟或關閉任一箭頭類型。 以下是我使用此指標進行交易的方式: - 對於買入入場,我會耐心等待白箭頭在蠟燭收盤時出現,並在下一根可用蠟燭收盤時出現藍箭頭時進行買入交易。 - 對於賣出入場,我會耐心等待黑箭頭在蠟燭收盤時出現,並在下一根可用蠟燭收盤時出現紅箭頭時進行賣出交易。 - 獲利了結/止損設置由使用者自行負責,但我個人使用最低R:R為1:2,並發現這在倫敦/紐約開盤等
JSL Orderflow Footprint turns every candle into a price ladder that shows how much volume traded on the bid and on the ask at each price level. It highlights diagonal imbalances, stacked imbalance zones, absorption at candle extremes, cumulative delta (CVD), delta divergence and the daily session volume profile, then combines five of these order-flow conditions into a 0–100 confluence score. A signal is only issued on bar close when the score is high, clearly one-sided and confirmed by the candl
Dynamic Forex28 Navigator
Bernhard Schweigert
4.43 (7)
Dynamic Forex28 Navigator - 下一代外汇交易工具。 当前 49% 折扣。 Dynamic Forex28 Navigator 是我们长期流行的指标的演变,将三种功能合二为一: 高级货币强度 28 指标 (695 条评论)+ 高级货币 IMPULSE 带警报 (520 条评论)+ CS28 组合信号(奖励)。 有关指标的详细信息 https://www.mql5.com/en/blogs/post/758844 下一代强度指标提供什么? 您喜欢的原始指标的一切,现在通过新功能和更高的精度进行了增强。 主要特点: 专有货币强度公式。  所有时间范围内的平滑和准确的强度线。 非常适合识别趋势和精确进入。 动态市场斐波那契水平(市场斐波那契)。  此指标独有的独特功能。 斐波那契应用于货币强度,而不是价格图表。 适应实时市场活动以获得准确的反转区域。 实时市场动量。  第 9 行显示市场是活跃还是被动。 对于定时交易至关重要。 全面的警报和显示。  每种货币最强的买入和卖出动量。 ​​28 对的双重动量买入和卖出。 超买/超卖警告外部范围和止损。 反转
IQ Gold Gann Levels
INTRAQUOTES
5 (5)
Presenting one-of-a-kind Gann Indicator for XAUUSD IQ Gold Gann Levels is a non-repainting, precision tool designed exclusively for XAUUSD intraday trading. It uses W.D. Gann’s square root method to plot real-time support and resistance levels, helping traders spot high-probability entries with confidence and clarity. William Delbert Gann (W.D. Gann) was an exceptional market analyst whose trading technique was based on a complex blend of mathematics, geometry, astrology, and ancient calculation
OrderFlow Absorption – 專業級MT4買賣差與吸收訊號指標 釋放真正訂單流分析的力量,OrderFlow Absorption 是MetaTrader 4上最強大的買賣差(Delta)直方圖與吸收訊號指標。專為想看清每一個價格波動背後真相的交易者設計,這個工具揭示了隱藏的買賣壓力與推動市場的吸收事件。 功能特色 買賣差直方圖視覺化:   以清晰的色彩直方圖即時顯示買方與賣方壓力。 吸收訊號偵測:   先進邏輯自動辨識多空吸收事件,及早預警潛在反轉。 圖表標記:   吸收訊號直接標示於主圖表,方便視覺辨識。 彈出式警報:   新吸收訊號出現時即時通知。 自訂門檻:   過濾弱訊號,專注高勝率機會。 資源管理:   高效運算,適用於大型圖表也能流暢運行。 全品種兼容:   適用於任何商品與週期,包括外匯、指數、商品等。 簡易整合:   參數簡單,快速上手與調整。 OrderFlow Absorption 的邏輯說明 OrderFlow Absorption 採用專利演算法,能在沒有完整Tick數據的情況下,估算每根K棒的買賣壓力(Delta)。它分析成交量、價格行為、K
PTS Precision Index Oscillator V2
PrecisionTradingSystems
5 (1)
精密指数振荡器(Pi-Osc)由Precision Trading Systems的Roger Medcalf开发 版本2经过精心重新编码,以在您的图表上加载速度非常快,还加入了一些其他技术改进,以提高体验。 Pi-Osc旨在提供准确的交易定时信号,旨在找到极端的耗尽点,这些点是市场被迫去触及,以清理每个人的止损单。 该产品解决了一个古老的问题,即知道极端点在哪里,这使得交易员的生活变得更加简单。 这是一个高度复杂的共识指标,与行业标准的振荡器相比,具有一些强大的区别。 它使用的一些特征包括需求指数、资金流动、RSI、随机指标、模式识别、成交量分析、标准偏差极端点以及不同长度上述各种变化的分歧。 乍一看,对于未经培训的人来说,它似乎与任何其他振荡器没有什么不同,但当与其他振荡器(如RSI或动量等)相对比时,这个指标的真正威力开始显现。 据我所知,没有其他振荡器可以频繁地精确指出顶部和底部,具有相同的定期效率。 精密指数振荡器由许多不同的数学方程组成,用于测量多个时间框架采样中的价格和成交量变动,从而高度准确地预测趋势可能发生转折的位置。 PTS Pi-Osc V2非
Beast Super Signal
Florian Zuercher
4.73 (90)
正在寻找可以帮助您轻松识别有利可图的交易机会的强大外汇交易指标? Beast Super Signal 就是您的不二之选。 这个易于使用的基于趋势的指标持续监控市场状况,寻找新的发展趋势或跳入现有趋势。当所有内部策略一致且彼此 100% 融合时,Beast Super Signal 会发出买入或卖出信号,无需额外确认。当您收到信号箭头警报时,只需买入或卖出。 购买后给我留言,让我加入我的私人 VIP 群组! (仅限购买完整产品)。 购买后给我发消息以获取最新的优化设置文件。 此处提供 MT5 版本。 在此处 获取 Beast Super Signal EA。 查看评论部分以查看最新结果! Beast Super Signal 根据您偏好的 1:1、1:2 或 1:3 风险回报率建议入场价、止损和获利水平,让您放心交易。这个 Beast Super Signal 是 100% 不可重新绘制的,这意味着它永远不会重新计算或重新绘制,每次都能为您提供可靠的信号。 Beast Super Signal 指标适用于所有时间范围,包括货币对、指数、商品和加密货币对。 Beast Su
ORB Seeker
Marcela Goncalves De Oliveira
4 (1)
特价促销,限量供应,保持产品稀缺性! 仅售 599 美元! 购买后请联系我以获取奖励的 ORB Seeker EA 和个人优化设置文件。 自信地捕捉干净利落的比赛片段! ORB Seeker 是一款专业的开盘区间突破 (ORB) 指标,专为追求准确性、简洁性、灵活性和清晰图表结构的交易者而设计。 它能自动绘制任何交易品种的盘前或自定义交易时段区间,然后给出清晰的突破信号,包括入场点、止损点、止盈点以及可选的50%部分止盈位。所有数据均实时计算并直接显示在图表上。 您可以选择交易伦敦开盘、纽约交易时段、亚洲交易时段,或者您自定义的交易时段。ORB Seeker 会根据您选择的交易时段自动调整,让您精准掌握市场波动范围、突破位和交易位的位置。 每次购买均免费赠送 ORB Seeker EA 智能交易系统。该 EA 系统读取指标的突破信号并可自动下单,您可以选择手动交易,也可以让 EA 系统根据指标的信号逻辑自动处理入场。   为什么选择 ORB Seeker 支持多个交易时段 - 您可以自行设置伦敦、纽约、亚洲或自定义交易时段的盘前交易时间和交易时段。 完整的突破视觉效果 - 交易最高
Introduction Excessive Momentum Indicator is the momentum indicator to measure the excessive momentum directly from raw price series. Hence, this is an extended price action and pattern trading. Excessive Momentum Indicator was originally developed by Young Ho Seo. This indicator demonstrates the concept of Equilibrium Fractal Wave and Practical Application at the same time. Excessive Momentum detects the market anomaly. Excessive momentum will give us a lot of clue about potential reversal and
Elliott Wave Trend MT4
Young Ho Seo
4 (7)
Elliott Wave Trend was designed for the scientific wave counting. This tool focuses to get rid of the vagueness of the classic Elliott Wave Counting using the guideline from the template and pattern approach. In doing so, firstly Elliott Wave Trend offers the template for your wave counting. Secondly, it offers Wave Structural Score to assist to identify accurate wave formation. It offers both impulse wave Structural Score and corrective wave Structure Score. Structural Score is the rating to sh
Owl smart levels
Sergey Ermolov
4.26 (38)
在顺势交易中,主要的难点不在于找到一个水平位,而在于理解哪里才是一个真正有效的入场点。 价格经常对水平位产生反应,但无法延续 движение — 这会导致错误入场或错过行情。 Owl Smart Levels 不仅仅显示水平位 ,还会基于市场结构和回调构建区域。这使你可以以不同的方式评估入场点,并避免一部分虚假信号。 Owl Smart Levels 系统包含什么? Owl Smart Levels 不只是标记水平位,而是一个 完整的交易模型 ,其中每个元素相互配合。 系统包含: Owl Smart Levels(指标) 显示趋势方向、回调区域,以及预定义的入场、止损和止盈水平 系统指南 解释如何在实战中使用信号:哪些情况需要考虑,哪些需要忽略,以及如何管理交易 交易决策清单 帮助你快速评估信号,避免基于“感觉”入场 Owl Helper 辅助EA 简化交易执行和管理 (一键下单) 说明、示例和策略 帮助你快速上手,并在实践中理解系统逻辑 最终,你获得的不是一个单独的工具,而是一个完整的交易框架 —— 从分析到执行。 阅读更多: Owl Smart Levels 如何发展
Congestioni
Stefano Frisetti
5 (1)
This indicator is very usefull to TRADE Trading Ranges and helps identify the following TREND. Every Trader knows that any market stay 80% of the time in trading ranges and only 20% of the time in TREND; this indicator has been built to help traders trade trading ranges. Now instead of waiting for the next TREND, You can SWING TRADE on trading ranges with this simple yet very effective indicator. TRADING with CONGESTIONI INDICATOR: The CONGESTIONI Indicator identify a new trading range and ale
I have been trading for some time now and always find it a difficulty remembering the timing of the various market opening hours at the other part of the world (especially, when it comes to daylight saving), but could not find any decent indicator online that could help. And it is for this reason that gives birth to this indicator, which I have spent much time, effort and thinking. As many already know that opening of a certain marketplace, depending on which currency pair, has an impact on the
Introduction to Fractal Pattern Scanner Fractal Indicator refers to the technical indicator that makes use of the fractal geometry found in the financial market. Fractal Pattern Scanner is the advanced Fractal Indicator that brings the latest trading technology after the extensive research and development work in the fractal geometry in the financial market. The most important feature in Fractal Pattern Scanner is the ability to measure the turning point probability as well as the trend probabi
IQ FX Gann Levels
INTRAQUOTES
5 (3)
IQ FX Gann Levels a precision trading indicator based on W.D. Gann’s square root methods . It plots real-time, non-repainting support and resistance levels to help traders confidently spot intraday and scalping opportunities with high accuracy. William Delbert Gann (W.D. Gann) was an exceptional market analyst, whose trading technique was based on a complex blend of mathematics, geometry, astrology, and ancient mathematics which proved to be extremely accurate. We don't offer free or bonus indic
Smart Market Structure Pro by G-Labs — ICT and Smart Money Concepts toolkit with built-in multi-symbol scanner for MetaTrader 5. Break of structure, change of character, order blocks, fair value gaps, liquidity sweeps, premium and discount zones, ICT sessions, confluence scoring, AI trade ideas, and a traffic-light scanner across up to 30 pairs and four timeframes from one chart. Map SMC and ICT on the active chart while the built-in scanner monitors your full watchlist. Each cell shows BUY, SE
TPA True Price Action indicator reveals the true price action of the market makers through 100% non-repainting signals (except early signals mode) strictly at the close of a candle! TPA shows entries and re-entries, every time the bulls are definitely stronger than the bears and vice versa. Not to confuse with red/green candles. The shift of power gets confirmed at the earliest stage and is ONE exit strategy of several. There are available now two free parts of the TPA User Guide for our custom
ECM Elite Channel is a volatility-based indicator, developed with a specific time algorithm, which consists of finding possible corrections in the market. This indicator shows two outer lines, an inner line (retracement line) and an arrow sign, where the channel theory is to help identify overbought and oversold conditions in the market. The market price will generally fall between the boundaries of the channel. If prices touch or move outside the channel, it's a trading opportunity. The ind
Titan Z-Score Pro v3.2 Sürüm Notları: Kurumsal UI/UX Yeniden Tasarımı: Performans kokpitleri ve MTF matrisleri ana harita köşelerine taşındı, böylece tertemiz, dağınıklıktan arındırılmış bir alt pencere görünümü sağlandı. Canlı Kazanma Oranı ve Geri Dönüş Kokpiti: Ortalama geri dönüş başarı oranının ve kazanılan ortalama piplerin gerçek zamanlı takibi eklendi. Çok Zaman Dilimi Z-Puan Matrisi: Ana tabloya doğrudan görsel olarak 5 zaman dilimli (M5'ten D1'e) bir durum ızgarası entegre edildi. Yeni
作者的更多信息
Like the logic of this tool? Explore the full ecosystem of professional indicators and utilities, built by a trader for traders: All author's products in MQL5 Market: https://www.mql5.com/en/users/musa1994/seller Trading philosophy and details: https://developer-mql4-mql5.netlify.app/ LiquidityVolumePro (MT4) — Smart Money Liquidity & Volume Analysis A professional indicator for MetaTrader 4 that combines liquidity analysis (Smart Money) and volume into a single system. Detects level sw
VolumeAnalysis
Musa Khunarikov
️ This is a FREE version of the tool. Developed by a practicing trader with 12 years of live trading experience (verified tax records, 51 Finam certificates). Looking for professional trading solutions (Volume Profile, SMC, Risk Manager)? Author's full lineup of PRO indicators: https://www.mql5.com/en/users/musa1994/seller Official website and portfolio: https://developer-mql4-mql5.netlify.app/ VolumeAnalysis is a professional library designed to integrate advanced volume analysis into y
FREE
MACrossoverEA KH
Musa Khunarikov
️ This is a FREE version of the tool. Developed by a practicing trader with 12 years of live trading experience (verified tax records, 51 Finam certificates). Looking for professional trading solutions (Volume Profile, SMC, Risk Manager)? Author's full lineup of PRO indicators: https://www.mql5.com/en/users/musa1994/seller Official website and portfolio: https://developer-mql4-mql5.netlify.app/ MA Crossover EA - advisor at the intersection of moving averages The advisor opens trades when
FREE
RoundLevelss
Musa Khunarikov
️ This is a FREE version of the tool. Developed by a practicing trader with 12 years of live trading experience (verified tax records, 51 Finam certificates). Looking for professional trading solutions (Volume Profile, SMC, Risk Manager)? Author's full lineup of PRO indicators: https://www.mql5.com/en/users/musa1994/seller Official website and portfolio: https://developer-mql4-mql5.netlify.app/ RoundLevelss — Psychological Round Levels with Auto-Adaptive Step for MetaTrader 4 Round price
FREE
RoundLevelsX
Musa Khunarikov
️ This is a FREE version of the tool. Developed by a practicing trader with 12 years of live trading experience (verified tax records, 51 Finam certificates). Looking for professional trading solutions (Volume Profile, SMC, Risk Manager)? Author's full lineup of PRO indicators: https://www.mql5.com/en/users/musa1994/seller Official website and portfolio: https://developer-mql4-mql5.netlify.app/ RoundLevelsX — Psychological Round Levels with Auto-Adaptive Step for MetaTrader 5 Round price
FREE
️ This is a FREE version of the tool. Developed by a practicing trader with 12 years of live trading experience (verified tax records, 51 Finam certificates). Looking for professional trading solutions (Volume Profile, SMC, Risk Manager)? Author's full lineup of PRO indicators: https://www.mql5.com/en/users/musa1994/seller Official website and portfolio: https://developer-mql4-mql5.netlify.app/ VolumeMonitorUtility is a service utility for the MetaTrader 5 terminal that displays key volum
FREE
️ This is a FREE version of the tool. Developed by a practicing trader with 12 years of live trading experience (verified tax records, 51 Finam certificates). Looking for professional trading solutions (Volume Profile, SMC, Risk Manager)? Author's full lineup of PRO indicators: https://www.mql5.com/en/users/musa1994/seller Official website and portfolio: https://developer-mql4-mql5.netlify.app/ Retail Sentiment MT4 Retail Sentiment is a professional information indicator for MetaTrader 4
FREE
RelativeVolumeKH
Musa Khunarikov
️ This is a FREE version of the tool. Developed by a practicing trader with 12 years of live trading experience (verified tax records, 51 Finam certificates). Looking for professional trading solutions (Volume Profile, SMC, Risk Manager)? Author's full lineup of PRO indicators: https://www.mql5.com/en/users/musa1994/seller Official website and portfolio: https://developer-mql4-mql5.netlify.app/ Relative Volume — Relative Volume Indicator This indicator displays current volume as a perce
FREE
️ This is a FREE version of the tool. Developed by a practicing trader with 12 years of live trading experience (verified tax records, 51 Finam certificates). Looking for professional trading solutions (Volume Profile, SMC, Risk Manager)? Author's full lineup of PRO indicators: https://www.mql5.com/en/users/musa1994/seller Official website and portfolio: https://developer-mql4-mql5.netlify.app/ Retail Sentiment MT5 Retail Sentiment is a professional information indicator for MetaTrader 5
FREE
️ This is a FREE version of the tool. Developed by a practicing trader with 12 years of live trading experience (verified tax records, 51 Finam certificates). Looking for professional trading solutions (Volume Profile, SMC, Risk Manager)? Author's full lineup of PRO indicators: https://www.mql5.com/en/users/musa1994/seller Official website and portfolio: https://developer-mql4-mql5.netlify.app/ SpreadMonitor is a professional MetaTrader 5 indicator that colorizes candles by spread level a
FREE
️ This is a FREE version of the tool. Developed by a practicing trader with 12 years of live trading experience (verified tax records, 51 Finam certificates). Looking for professional trading solutions (Volume Profile, SMC, Risk Manager)? Author's full lineup of PRO indicators: https://www.mql5.com/en/users/musa1994/seller Official website and portfolio: https://developer-mql4-mql5.netlify.app/ SpreadMonitor is a professional indicator for MetaTrader 4 that color-codes candlesticks based
FREE
Like the logic of this tool? Explore the full ecosystem of professional indicators and utilities, built by a trader for traders: All author's products in MQL5 Market: https://www.mql5.com/en/users/musa1994/seller Trading philosophy and details: https://developer-mql4-mql5.netlify.app/ Professional VolumeProfile is a professional indicator for MetaTrader 4 that builds a volume profile by price directly on the chart: it shows POC (Point of Control), VAH/VAL (boundaries of the value zone)
Like the logic of this tool? Explore the full ecosystem of professional indicators and utilities, built by a trader for traders: All author's products in MQL5 Market: https://www.mql5.com/en/users/musa1994/seller Trading philosophy and details: https://developer-mql4-mql5.netlify.app/ Professional Delta Volume is a professional indicator for MetaTrader 4 and MetaTrader 5 that shows the difference between buy and sell volume (Delta Volume) and cumulative delta. Helps to see who dominates
MTFDashboardX
Musa Khunarikov
Like the logic of this tool? Explore the full ecosystem of professional indicators and utilities, built by a trader for traders: All author's products in MQL5 Market: https://www.mql5.com/en/users/musa1994/seller Trading philosophy and details: https://developer-mql4-mql5.netlify.app/ MTF DashboardX MTF DashboardX is a professional scanner panel for MetaTrader 5 that shows market structure state across multiple symbols and timeframes in one window. Automatically detects BOS (Break of St
VolatilityProX
Musa Khunarikov
Like the logic of this tool? Explore the full ecosystem of professional indicators and utilities, built by a trader for traders: All author's products in MQL5 Market: https://www.mql5.com/en/users/musa1994/seller Trading philosophy and details: https://developer-mql4-mql5.netlify.app/ VolatilityProX is a professional indicator for MetaTrader 4 that combines three tools in one: Adaptive Supertrend — adaptive trend line Daily Range — yesterday's High/Low Pivot Points — classic R1, R2, S1,
Like the logic of this tool? Explore the full ecosystem of professional indicators and utilities, built by a trader for traders: All author's products in MQL5 Market: https://www.mql5.com/en/users/musa1994/seller Trading philosophy and details: https://developer-mql4-mql5.netlify.app/ Risk Manager Panel is a professional trading panel for MetaTrader 4 that automatically calculates lot size based on risk and manages trades in one click. No more manual lot calculation — the panel does it
Like the logic of this tool? Explore the full ecosystem of professional indicators and utilities, built by a trader for traders: All author's products in MQL5 Market: https://www.mql5.com/en/users/musa1994/seller Trading philosophy and details: https://developer-mql4-mql5.netlify.app/ Divergence Indicator Pro X is a professional divergence indicator for MetaTrader 4 that automatically detects divergences between price and oscillator right on the chart. Full MT5-version functionality, ad
VolumeProfileCVD
Musa Khunarikov
Like the logic of this tool? Explore the full ecosystem of professional indicators and utilities, built by a trader for traders: All author's products in MQL5 Market: https://www.mql5.com/en/users/musa1994/seller Trading philosophy and details: https://developer-mql4-mql5.netlify.app/ Volume Profile + CVD is a professional volume analysis indicator for MetaTrader 4 that displays volume distribution by price levels and cumulative volume delta. Full MT5-version functionality, adapted for
Like the logic of this tool? Explore the full ecosystem of professional indicators and utilities, built by a trader for traders: All author's products in MQL5 Market: https://www.mql5.com/en/users/musa1994/seller Trading philosophy and details: https://developer-mql4-mql5.netlify.app/ SLTPManager is a professional automatic Stop Loss and Take Profit manager with an interactive panel for MetaTrader 4, which instantly sets protection and profit-taking levels for every new trade. You will
Like the logic of this tool? Explore the full ecosystem of professional indicators and utilities, built by a trader for traders: All author's products in MQL5 Market: https://www.mql5.com/en/users/musa1994/seller Trading philosophy and details: https://developer-mql4-mql5.netlify.app/ A professional Volume Profile indicator for MetaTrader 5. Builds a horizontal histogram of volume distribution by price levels and identifies key zones of institutional interest. Created by a practicing tr
Liked the logic of this tool? Explore the full ecosystem of professional indicators and utilities created by a trader for traders: All products by the author on MQL5 Market: https://www.mql5.com/en/users/musa1994/seller Details and trading philosophy: https://developer-mql4-mql5.netlify.app/ LiquidityVolumePro is a professional indicator for MetaTrader 5 that combines liquidity analysis, volume, and trend direction into a single trading system. It finds key level sweeps, filters them
SM Structure
Musa Khunarikov
Like the logic of this tool? Explore the full ecosystem of professional indicators and utilities, built by a trader for traders: All author's products in MQL5 Market: https://www.mql5.com/en/users/musa1994/seller Trading philosophy and details: https://developer-mql4-mql5.netlify.app/ SM Structure is a professional indicator for MetaTrader 5 that automatically identifies market structure using Smart Money Concepts (SMC) and ICT methodology. It detects BOS (Break of Structure), CHoCH (Ch
Like the logic of this tool? Explore the full ecosystem of professional indicators and utilities, built by a trader for traders: All author's products in MQL5 Market: https://www.mql5.com/en/users/musa1994/seller Trading philosophy and details: https://developer-mql4-mql5.netlify.app/ Professional Delta Volume is a professional indicator MetaTrader 5 that shows the difference between buy and sell volume (Delta Volume) and cumulative delta. Helps to see who dominates the market — buyers
MTFDashboard
Musa Khunarikov
Like the logic of this tool? Explore the full ecosystem of professional indicators and utilities, built by a trader for traders: All author's products in MQL5 Market: https://www.mql5.com/en/users/musa1994/seller Trading philosophy and details: https://developer-mql4-mql5.netlify.app/ MTF Dashboard is a professional scanner panel for MetaTrader 5 that shows market structure state across multiple symbols and timeframes in one window. Automatically detects BOS (Break of Structure) and CHo
VolatilityPro
Musa Khunarikov
Like the logic of this tool? Explore the full ecosystem of professional indicators and utilities, built by a trader for traders: All author's products in MQL5 Market: https://www.mql5.com/en/users/musa1994/seller Trading philosophy and details: https://developer-mql4-mql5.netlify.app/ VolatilityPro is a professional indicator for MetaTrader 5 that combines three tools in one: Adaptive Supertrend — adaptive trend line Daily Range — yesterday's High/Low Pivot Points — classic R1, R2, S1,
Like the logic of this tool? Explore the full ecosystem of professional indicators and utilities, built by a trader for traders: All author's products in MQL5 Market: https://www.mql5.com/en/users/musa1994/seller Trading philosophy and details: https://developer-mql4-mql5.netlify.app/ Risk Manager PanelX is a professional trading panel for MetaTrader 5 that automatically calculates lot size based on risk and manages trades in one click. No more manual lot calculation or opening trades t
Like the logic of this tool? Explore the full ecosystem of professional indicators and utilities, built by a trader for traders: All author's products in MQL5 Market: https://www.mql5.com/en/users/musa1994/seller Trading philosophy and details: https://developer-mql4-mql5.netlify.app/ Divergence Indicator Pro is a professional divergence indicator for MetaTrader 5 that automatically detects divergences between price and oscillator right on the chart. No more manual pivot hunting or chec
VolumeProfileCVDX
Musa Khunarikov
Like the logic of this tool? Explore the full ecosystem of professional indicators and utilities, built by a trader for traders: All author's products in MQL5 Market: https://www.mql5.com/en/users/musa1994/seller Trading philosophy and details: https://developer-mql4-mql5.netlify.app/ Volume Profile + CVD is a professional volume analysis indicator for MetaTrader 5 that displays volume distribution by price levels and cumulative volume delta. The indicator answers two key trader questio
SLTPManager
Musa Khunarikov
Like the logic of this tool? Explore the full ecosystem of professional indicators and utilities, built by a trader for traders: All author's products in MQL5 Market: https://www.mql5.com/en/users/musa1994/seller Trading philosophy and details: https://developer-mql4-mql5.netlify.app/ SLTPManager is a professional automatic Stop Loss and Take Profit manager with an interactive panel for MetaTrader 5, which instantly sets protection and profit-taking levels for every new trade. You will
Bressert Cycle Signals Like the logic of this tool? All author's products: https://www.mql5.com/ru/users/musa1994/seller Trading philosophy: https://developer-mql4-mql5.netlify.app/ Bressert Cycle Signals (BCS) is a professional cyclical indicator for MT5, adapting Walter Bressert's methodology. It combines oscillator phase analysis with precise "Setup & Trigger" entry mechanics, displaying signals directly on candlesticks. What the indicator shows Bressert Oscillator (subwindow):
筛选:
无评论
回复评论