ArgosWatch Session Range Breakout Scanner
- ユーティリティ
-
Antonios Kokkalis
 Trader and systems developer. 12 years on MT4, MT5, and NinjaTrader 8.
PUBLISHED WORK
MQL5 Market — ArgosWatch Institutional Prop Suite:
- Prop Challenge Guardian MT5-Daily and maximum drawdown barrier with on-chart SOS danger line and instant lot matrix - バージョン: 2.6
- アクティベーション: 5
────────────────────────────────────────────────────────────────
Compression Scanner MT5 — watches up to 24 symbols for session-range
compression and the expansion that follows, and ranks them by how close
each one is to moving.
Every state it reports has an arithmetic definition, printed below. None
of them is a forecast.
WHAT IT DOES
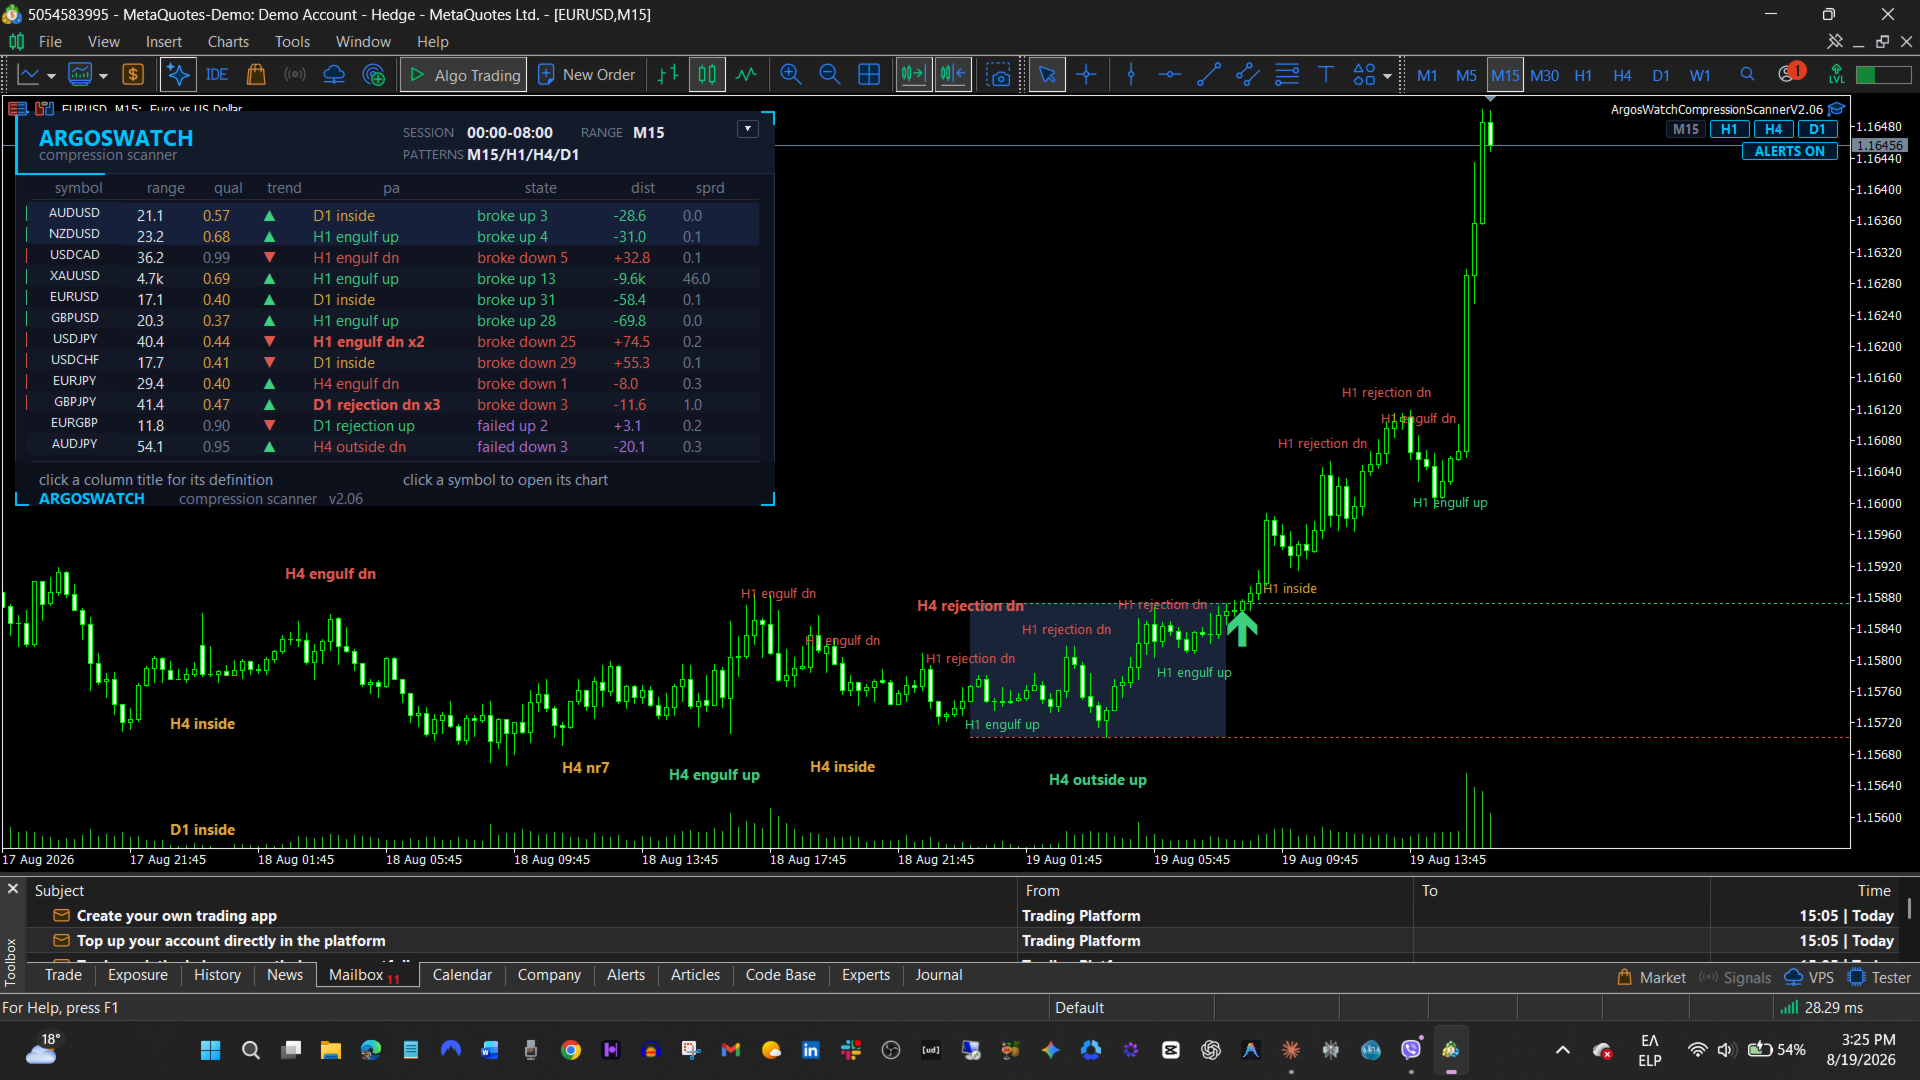
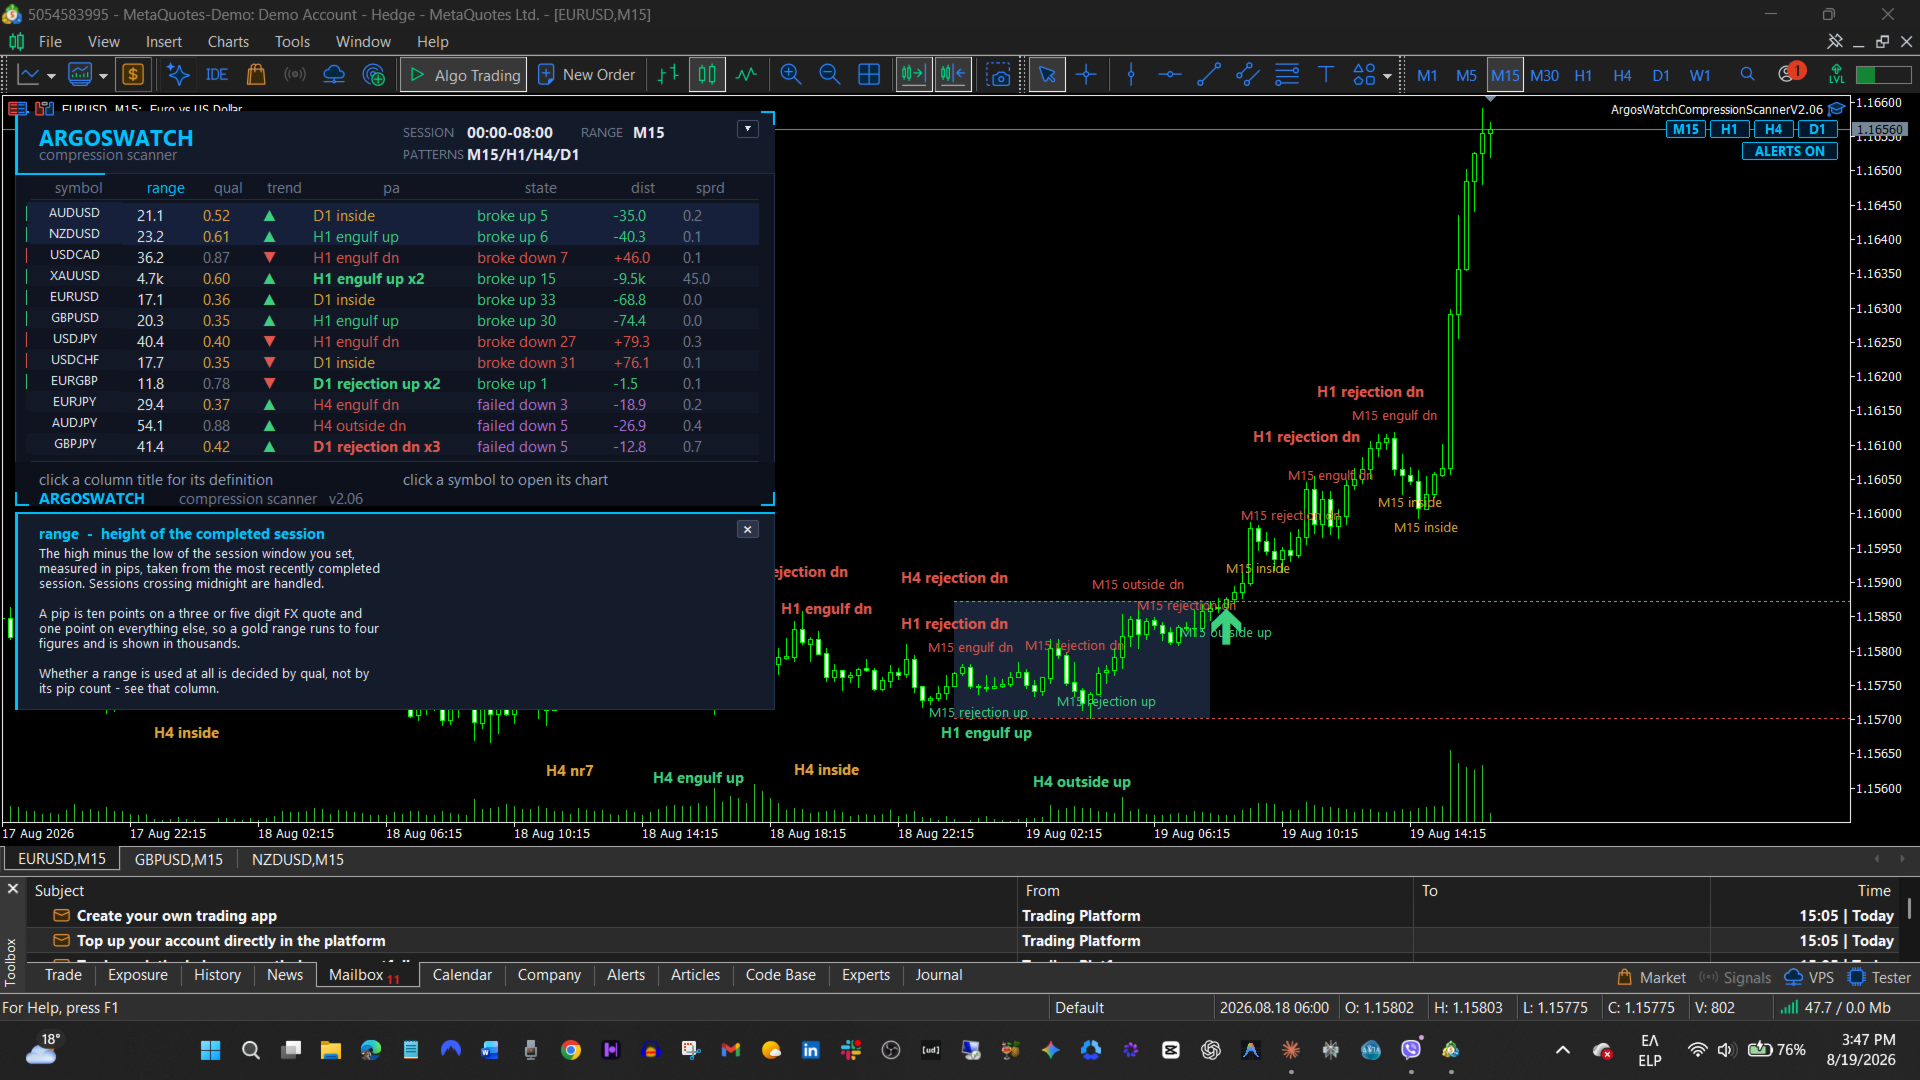
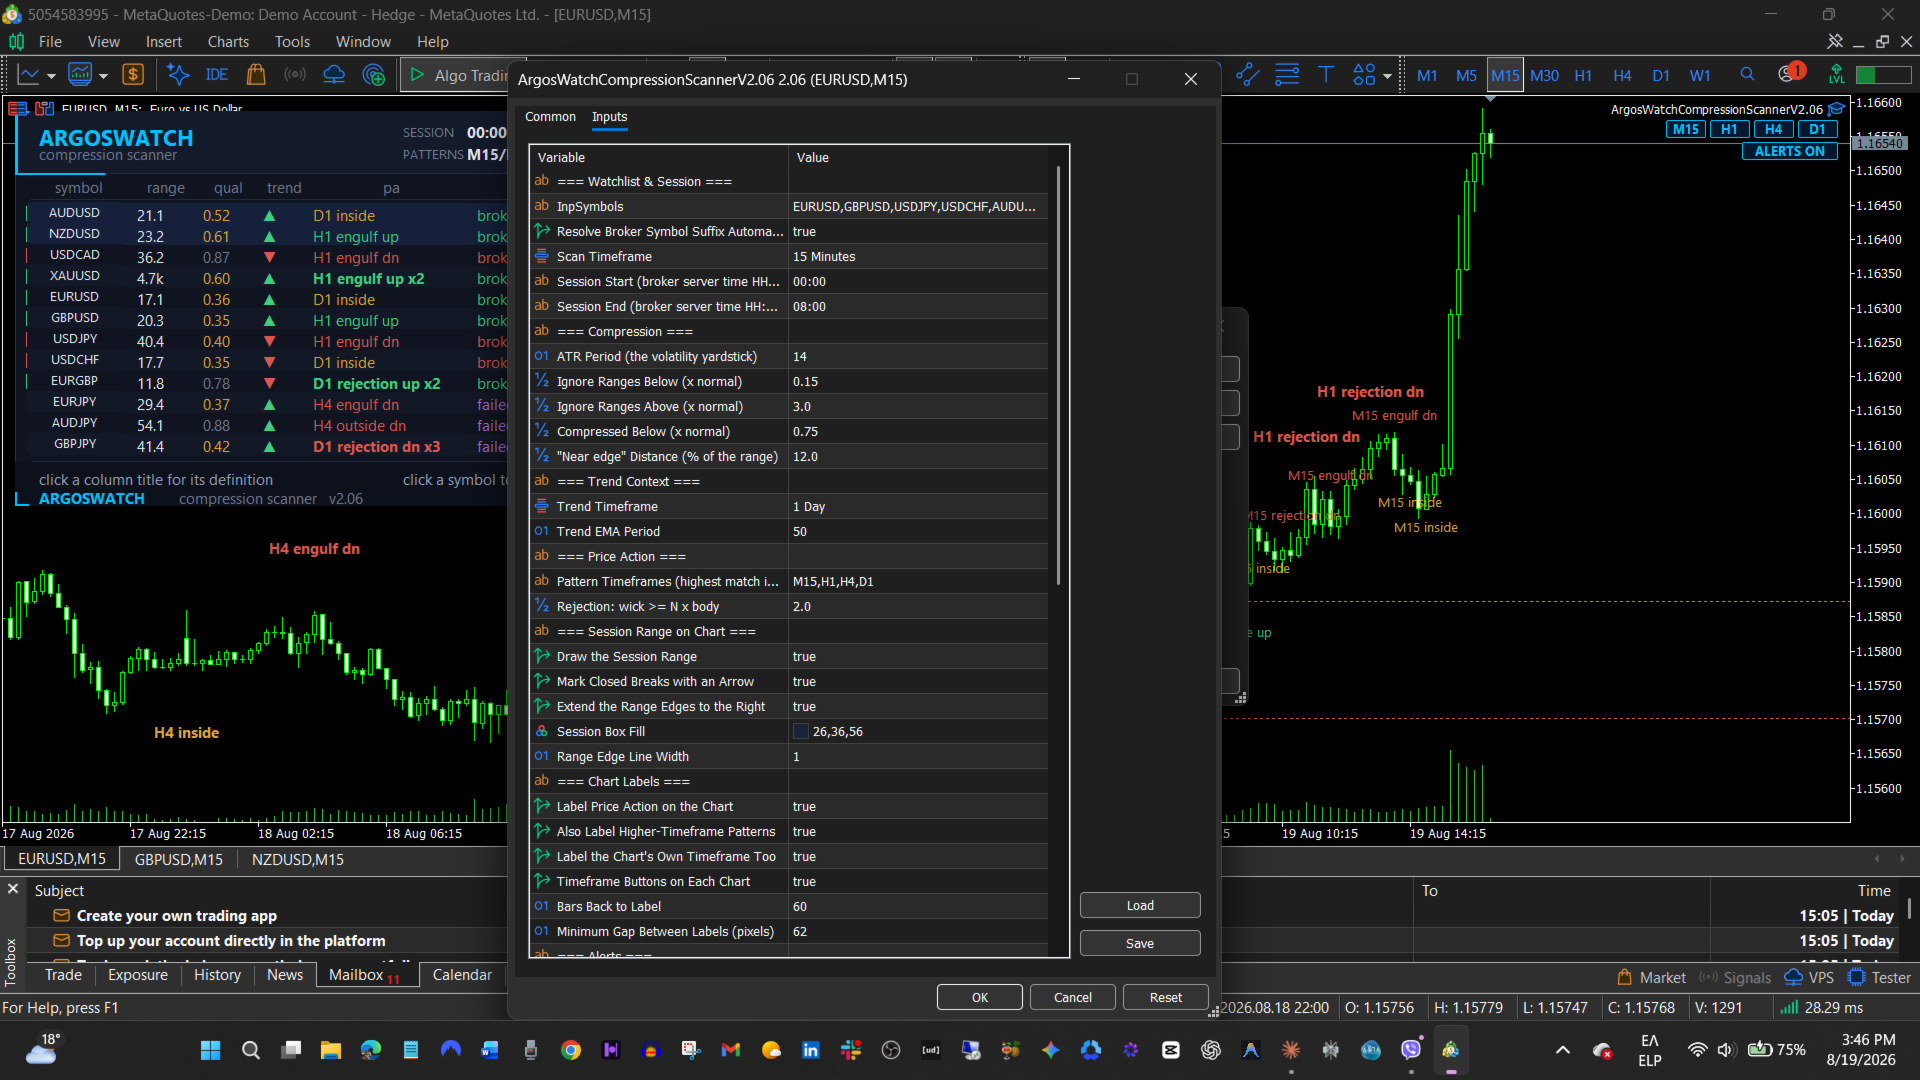
One panel, one chart, up to 24 symbols. For each one it measures the
range of the session window you set, compares that range against what the
symbol normally covers over a window of the same length, reads the price
action on four timeframes, and sorts the table so the row worth looking
at is at the top.
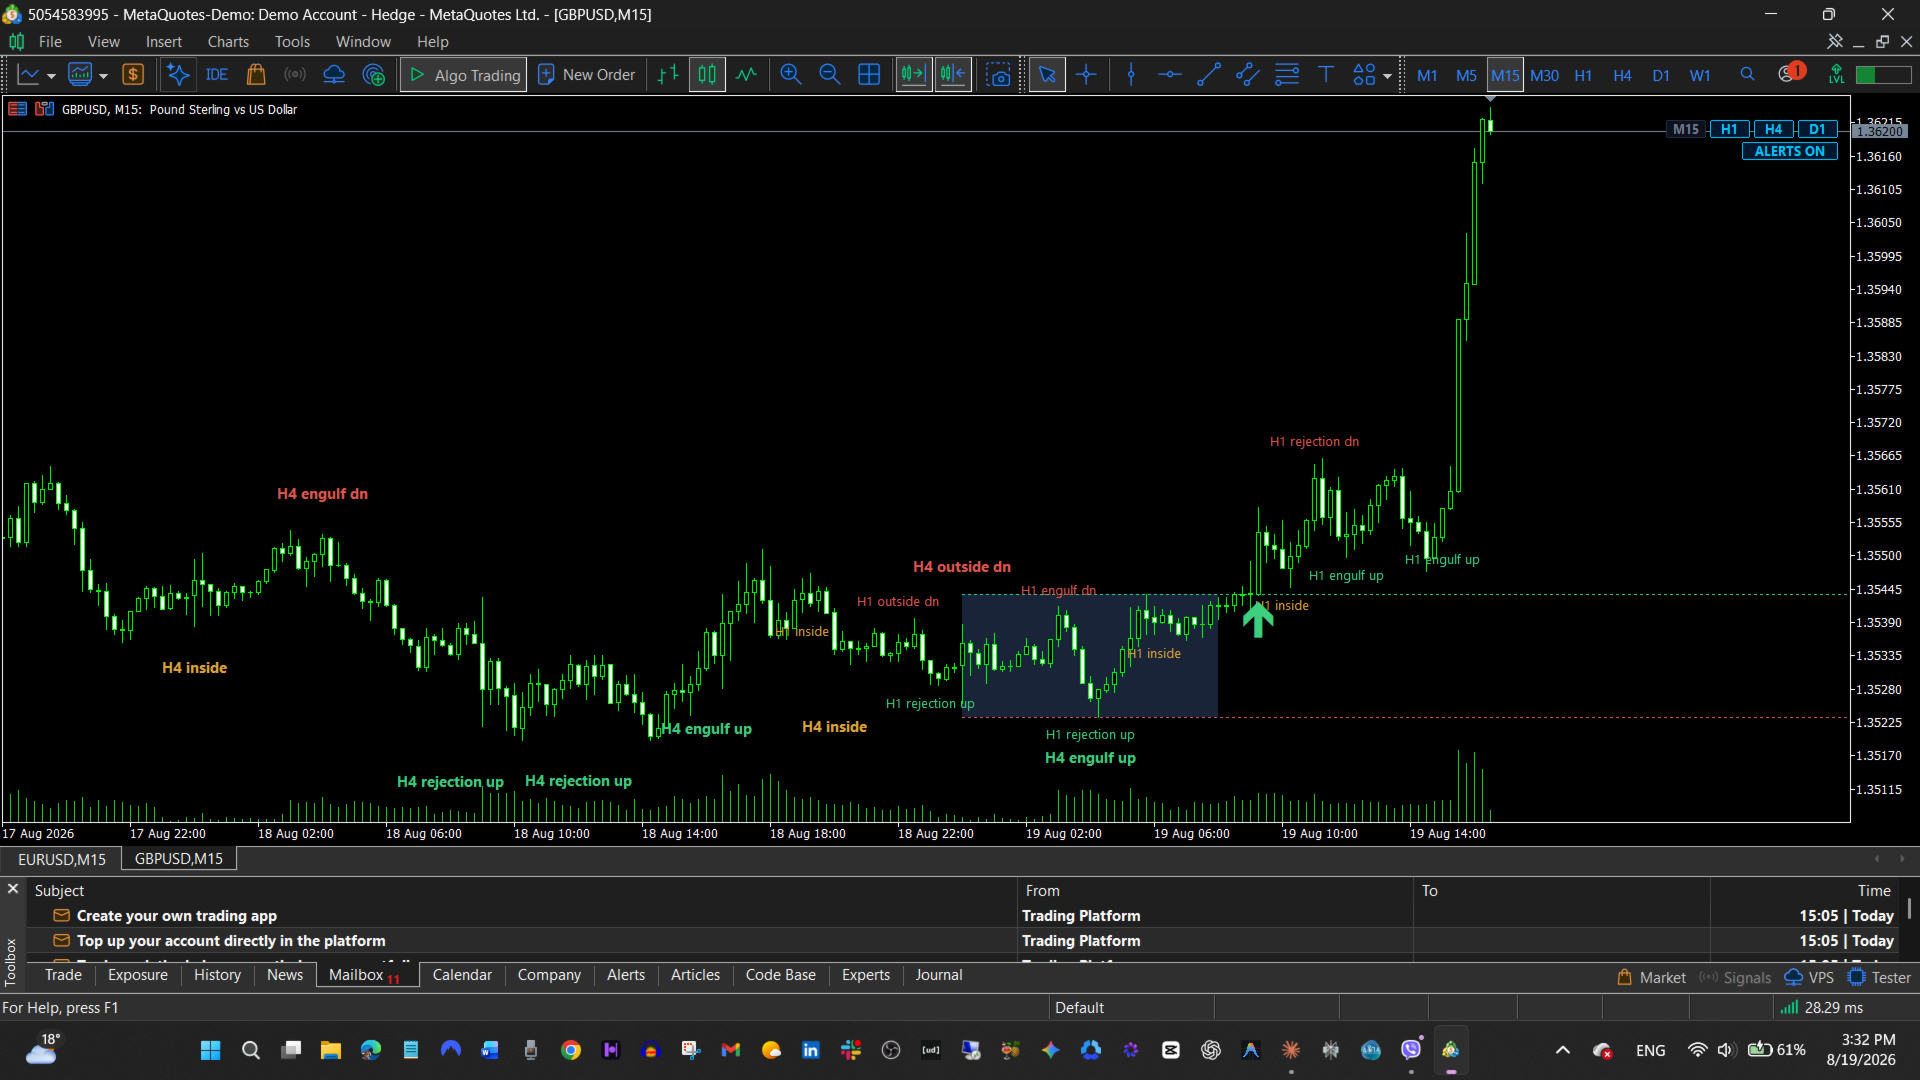
Click a symbol and its chart opens, annotated with the same patterns the
table reports.
THE ARITHMETIC
qual — the range against normal volatility
range / ( ATR x square root of bars in the session )
below 0.75 the session compressed - a tight coil
0.75 - 1.25 ordinary
above 1.25 wider than normal, mostly travel
The square root is what makes the number sit near 1.0 on every symbol,
timeframe and session length, so a 15 pip EURUSD range and a 900 point
gold range are comparable. A filter written in pips for EURUSD throws
gold out of the table entirely.
state — where price is against the range
inside between the two edges
near high within the "near edge" share of the high
near low the same at the low
broke up N a bar closed above the high, N bars ago
broke down N the same below the low
failed up N broke, then closed back inside the range
no range no usable session range - see qual
Breaks are judged on closed bars only. The number is bars since the
break, not minutes.
pa — the pattern, and the timeframe it happened on
Read as: H4 rejection up x2
The timeframe comes first because it is the more important half. A
rejection on M15 is fifteen minutes the next hour can erase; the same
shape on H4 is four hours of participants refusing a price. Not one
signal at two sizes.
One pattern per bar, in this order of priority:
engulf opposite colour, body covers the previous body
outside high above and low below the previous bar
rejection one wick >= 2x the body and >= 1.5x the other
inside high below and low above the previous bar
nr7 narrowest range of the last seven bars
The trailing xN means N timeframes agree.
trend — context, not confirmation
Close versus EMA(50) on D1 by default; both are inputs.
up close above the average
down close below it
flat within a tenth of an ATR of it
It changes the sort order and nothing else.
sprd — the spread, judged against the range
Turns red when the spread is more than a twentieth of the session range -
a threshold that means the same thing on EURUSD and on gold, which a
fixed pip figure does not.
HOW THE RANKING WORKS
break agreeing with the trend 100
break against the trend 80
failed break 70
near an edge, trend agrees 60
near an edge, against 50
inside the range 10 to 30, tightest coil first
Breaks lose one point per bar of age, up to 20, so a fresh break outranks
a stale one. It is a sort order, not advice.
ALERTS
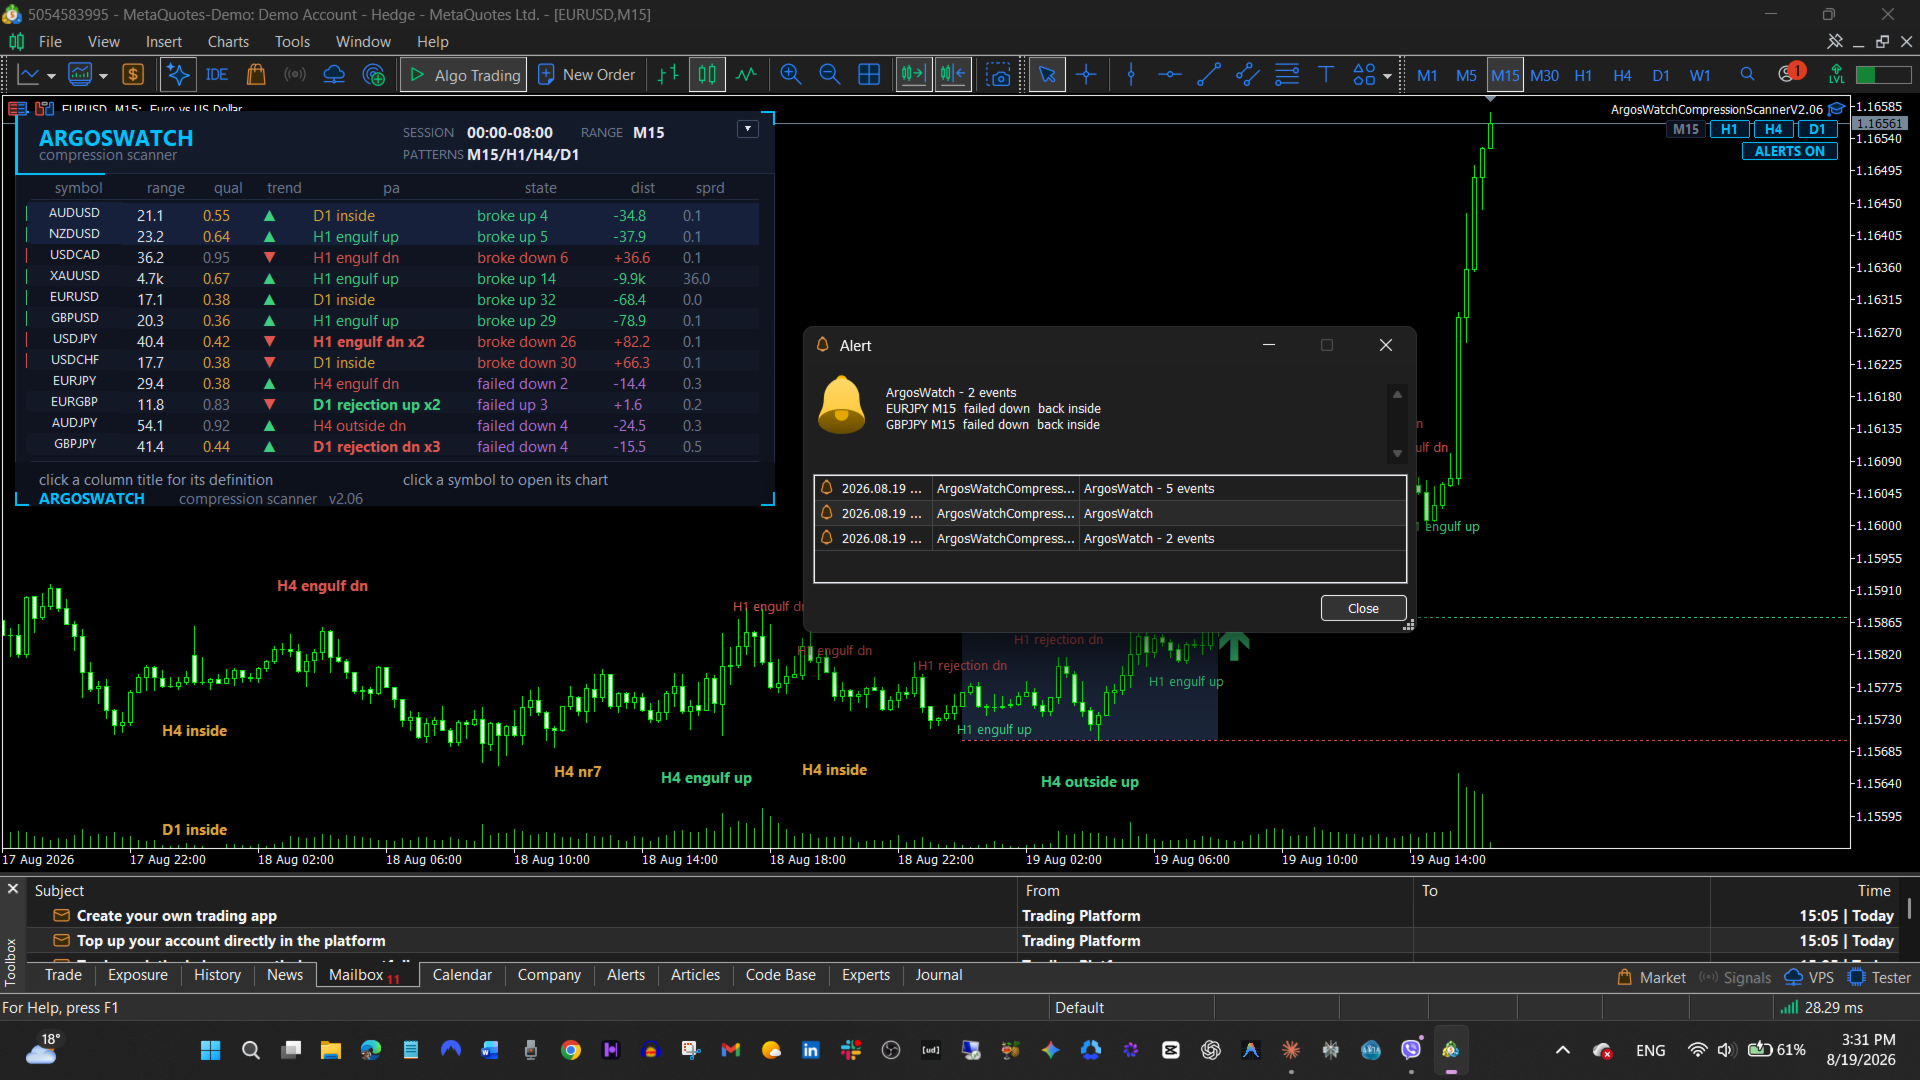
On a closed break, on a failed break, on approach to an edge, and on
pattern confluence across N timeframes. Each fires once per event, never
for something that happened before the tool was attached. Twelve symbols
breaking together ring once and list them.
ON THE CHART
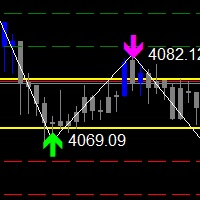
The session range is drawn as a box with its edges extended right. Break
markers are placed only after a bar has closed beyond the level. They do
not appear while the bar is open, they do not move once placed, and they
mark something that has already happened.
Pattern labels carry the timeframe they were read on, with higher
timeframes drawn further from the price.
WHAT IT DOES NOT DO
It does not place orders. It does not modify positions. There is no
OrderSend in the file, no CTrade, no trade include - the class of code
that could open a position is not present.
It is not a trading system and it gives no buy or sell signals. It does
not predict. It reports arithmetic about what has already closed.
It is an Expert Advisor rather than an indicator for one reason: the
Strategy Tester will not load an indicator, so shipped as an indicator
there would be nothing to try before buying.
REQUIREMENTS
MetaTrader 5. Any broker. Broker symbol suffixes are resolved
automatically. Symbols that cannot be opened are named in the Experts
log rather than silently dropped.
────────────────────────────────────────────────────────────────
PART OF THE ARGOSWATCH SERIES
Free:
Smart Session Breakout MT5 / MT4 - the session range on your chart
ArgosWatch Drawdown Meter MT5 - live daily loss and maximum drawdown
ArgosWatch Prop News and Volatility Guard MT5 - news windows, spread
Full tools:
ArgosWatch Session Range Breakout Scanner - 24 symbols, ranked
ArgosWatch Prop Consistency Guard - the rule that fails passed challenges
Prop Challenge Guardian MT5 - risk barrier and lot matrix
────────────────────────────────────────────────────────────────