CRT Scanner Indicator
- インディケータ
- バージョン: 2.4
- アップデート済み: 30 8月 2026
- アクティベーション: 20

THE ULTIMATE CRT SCANNER - YOUR INSTITUTIONAL-GRADE TRADING EDGE
What Is This Trading Masterpiece?
Imagine having a team of professional analysts scanning 40+ instruments across multiple timeframes simultaneously, identifying only the highest-probability setups that align with institutional smart money concepts. That's exactly what this indicator delivers. The CRT Scanner is not just another trading tool – it's your personal market surveillance system that hunts for a specific, powerful price pattern called the "Candle Range Theory" or "2-candle CRT."
This pattern represents one of the most reliable institutional trading signals in existence: a liquidity sweep where price aggressively pierces beyond a key range only to snap back inside, trapping retail traders before reversing in the opposite direction. When you see this happen, you're witnessing smart money manipulating price to fill their orders at better prices. The CRT Scanner automatically detects these setups across all your favorite symbols, validates them against crucial support/resistance zones, and presents you with only the cream-of-the-crop opportunities.
The Science Behind The Magic
The scanner analyzes each two-candle combination looking for a precise mathematical relationship. Candle 1 establishes a range, and Candle 2 must wick beyond that range by at least 15% of the range size while closing back inside. This isn't random noise – it's a deliberate price action pattern that occurs when large institutions are accumulating or distributing positions. The long wick represents manipulation, while the close back inside indicates the true market direction.
For bullish CRT setups, Candle 2 wicks below Candle 1's low and closes inside. This means sellers were trapped as price swept their stops only to reverse and leave them behind. For bearish CRT, the opposite occurs: price wicks above Candle 1's high and closes back inside, trapping eager buyers. By identifying these patterns mechanically, the scanner removes all guesswork and emotional bias from your trading decisions.
The Game-Changing Zone Validation Filter
Here's where this indicator separates itself from every other CRT scanner on the market. Not every CRT formation is tradable – only those that occur at genuine institutional levels carry high probability. The scanner automatically checks if Candle 1's range is positioned within 35% of the Average True Range (ATR) of a demand or supply zone. It identifies swing extremes, order blocks, and unmitigated Fair Value Gaps (FVGs) that major players are watching.
This validation filter is your quality control mechanism. Invalid setups that fail this test are immediately discarded and never reach your dashboard. This means you're never wasting time analyzing random CRT patterns that formed in the middle of nowhere. Every signal you see has been pre-filtered through institutional-grade zone analysis, dramatically increasing your win rate and confidence in every trade you take.
The Multi-Timeframe Confirmation Engine
The indicator doesn't just stop at finding a valid zone CRT on higher timeframes. It then drills down to a lower timeframe for precision entry confirmation using a carefully mapped hierarchy: Weekly charts look at 4-Hour, Daily charts examine 1-Hour, and 4-Hour charts analyze 15-minute timeframes. This multi-layered approach ensures you're trading in the direction of the larger trend while timing entries with surgical precision.
On these lower timeframes, the scanner searches for additional confluence factors that dramatically increase setup probability. It looks for unmitigated Fair Value Gaps that align with the CRT direction, Market Structure Shifts where price breaks recent swing points, and Change in State of Delivery marked by powerful impulse candles. When at least one FVG plus either an MSS or CISD appears, the signal becomes "Ready" for execution.
Your Entry, Stop Loss, and Take Profit Strategy
The indicator provides crystal-clear trade parameters for every confirmed signal. Entry is automatically set at the current close price of the lower timeframe candle when all conditions are met. Your stop loss is intelligently placed at the most recent swing low for bullish trades or swing high for bearish trades on the lower timeframe, giving your trade room to breathe while protecting against false breakdowns.
The take profit is strategically targeted at the opposite extreme of Candle 1's range on the higher timeframe – the true CRT target. This isn't a random profit target; it's the logical destination based on the pattern's geometry. If the calculated target would result in less than 2R reward, the indicator automatically extends it to at least 2R, ensuring you never take a setup with poor risk-reward potential. The result is consistently favorable R:R ratios that can transform your account balance.
The Visual Trading Experience
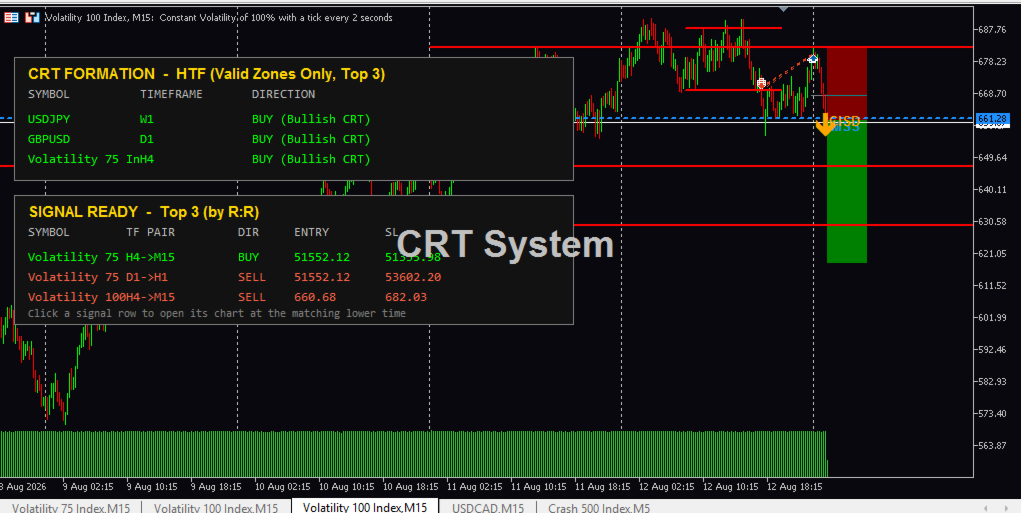
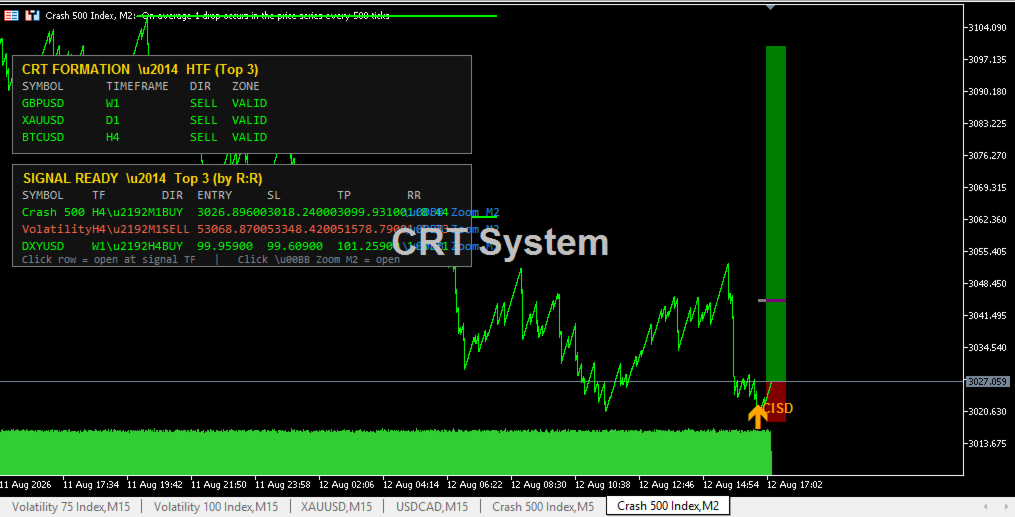
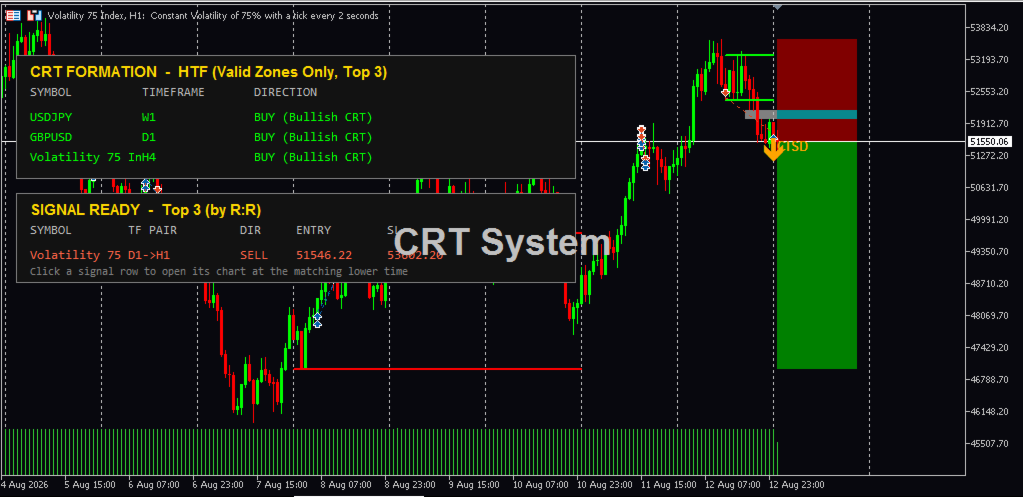
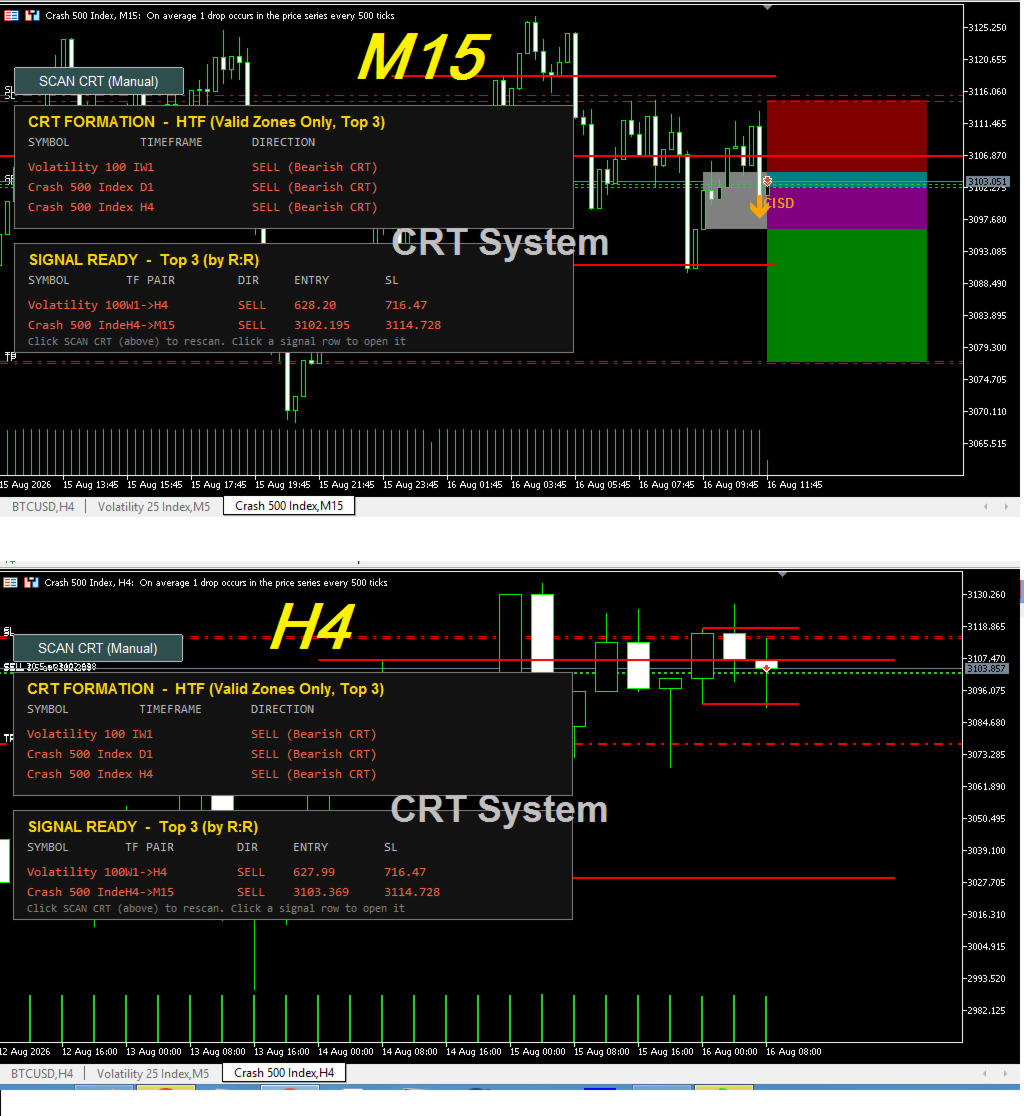
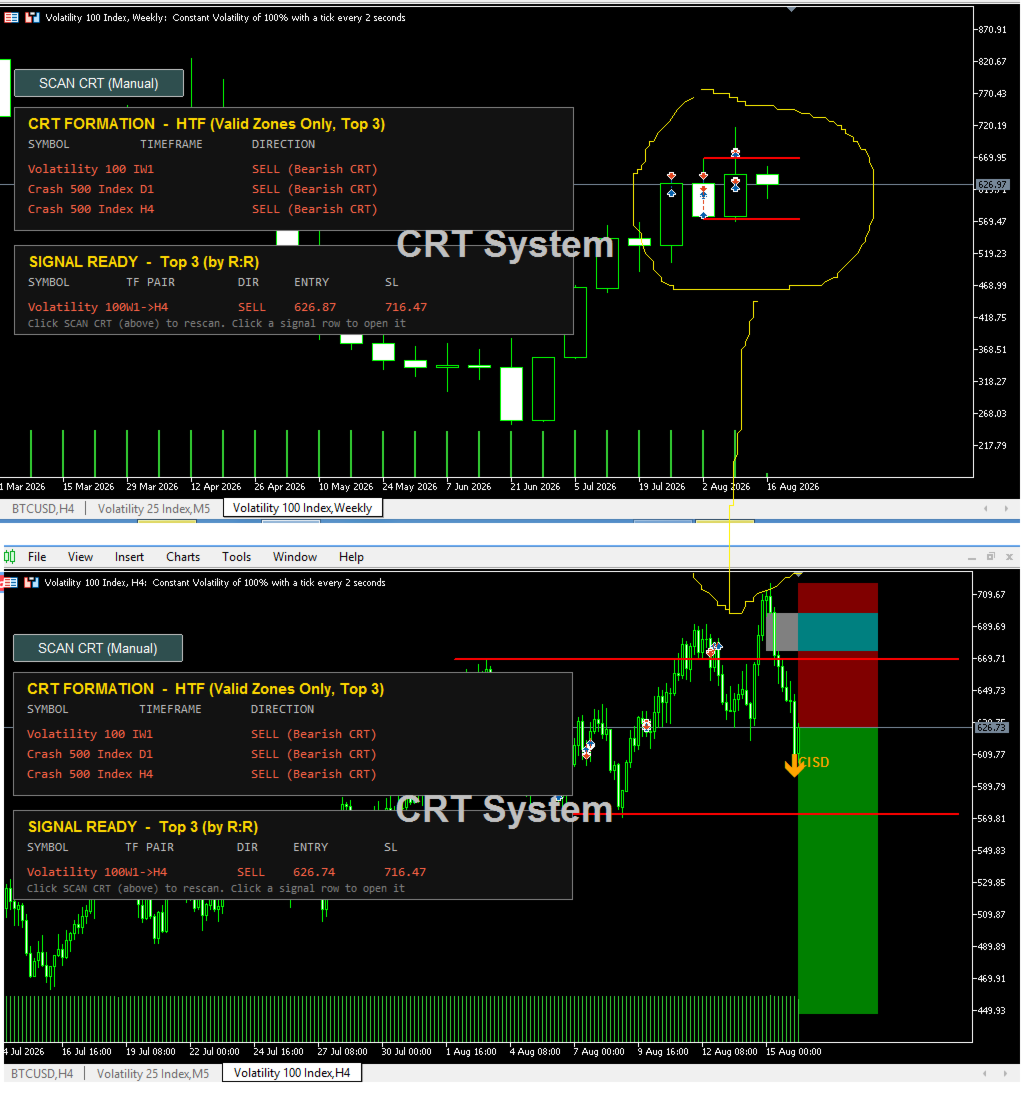
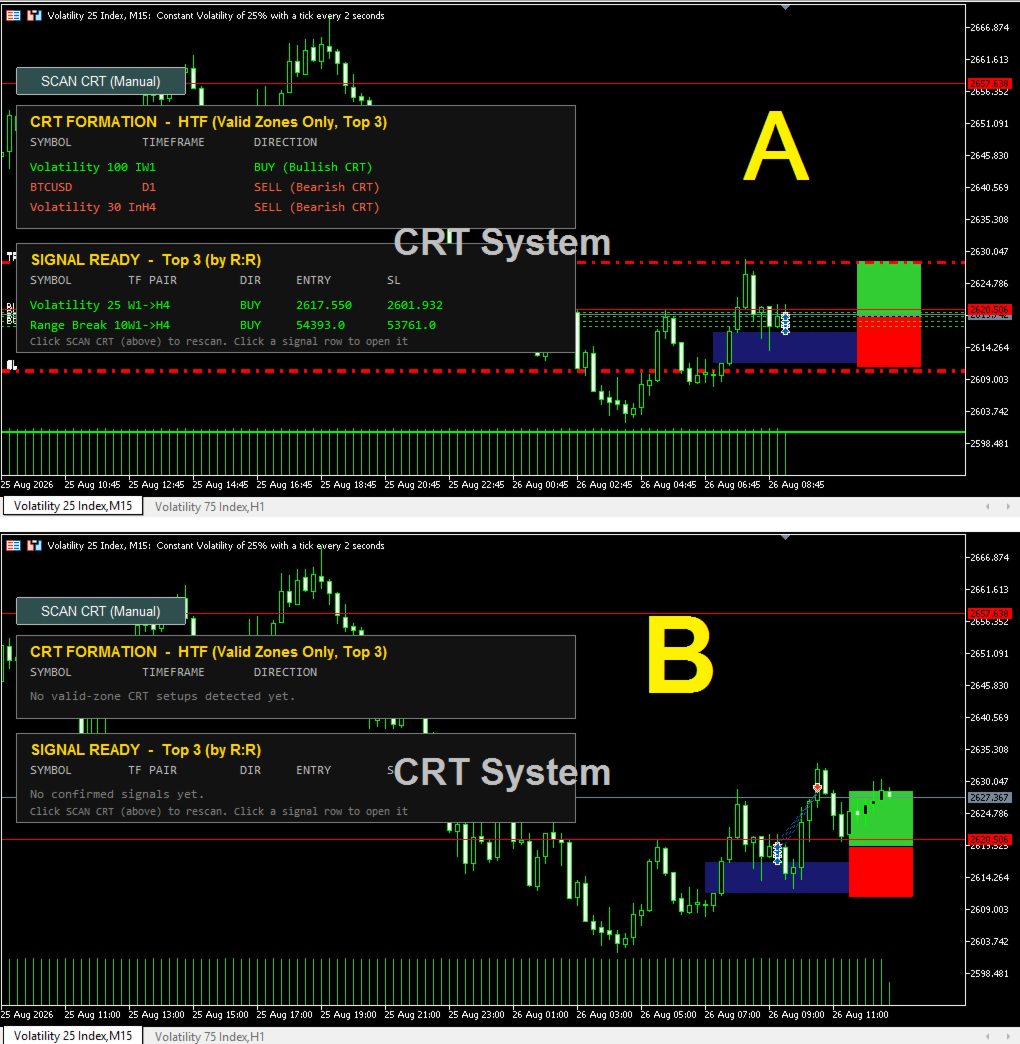
When you click any signal row on the dashboard, the indicator transforms your chart into a complete trading command center. It draws a red box representing the distance from your entry to your stop loss, clearly showing your risk. A green box illustrates the potential profit from entry to take profit, giving you an instant visual representation of the trade's geometry. Gray rectangles mark the FVG zones, blue dashed lines identify MSS levels, and orange arrows pinpoint CISD signals.
This visual clarity eliminates confusion and allows you to verify every setup manually before entering. You'll see exactly where your orders should be placed, what levels are supporting the trade, and why the signal was triggered. The indicator doesn't hide anything – it provides complete transparency so you can trade with absolute confidence in your analysis.
The Dashboard - Your Command Center
The dashboard is divided into two powerful panels that give you everything you need at a glance. The top panel displays the top three valid CRT formations found on higher timeframes, showing the symbol, timeframe, and direction. This gives you a snapshot of the best institutional setups forming across your watchlist, allowing you to anticipate potential signals before they trigger.
The bottom panel is where the action happens – it displays the top three confirmed signals ranked by their risk-reward ratio. You'll see each symbol, timeframe pair, direction, entry price, stop loss, take profit, and the exact R:R ratio. This ranking system ensures you're always focusing on the highest-quality opportunities first, maximizing your capital efficiency and minimizing the noise of lower-probability setups.
Click-To-Trade Functionality
One click on any signal row instantly switches your chart to that exact symbol and lower timeframe, applying all visual markings automatically. No more manual searching, timeframe switching, or level drawing. The indicator does everything for you in milliseconds. This streamlined workflow saves you hours of preparation time each day and allows you to execute trades with the speed and precision of a professional trading desk.
Real-Time Alerts - Never Miss An Opportunity
The indicator includes a sophisticated alert system that notifies you immediately when a new signal is confirmed. You'll receive clear, actionable alerts containing the symbol, timeframe pair, direction, entry, stop loss, and take profit prices. These alerts work both as pop-ups and push notifications, ensuring you never miss a high-probability setup even when you're away from your screen.
Why Professional Traders Choose This System
This scanner represents the culmination of years of institutional trading knowledge distilled into an automated, user-friendly tool. Professional traders understand that retail traders' stop-losses create the liquidity needed for large institutions to enter positions. The CRT pattern captures exactly this dynamic, allowing you to trade alongside smart money rather than against it.
The multi-timeframe validation ensures you're trading with the trend, not against it. The zone filter aligns your entries with levels that institutions actually care about. The LTF confirmation provides precision timing that increases your win rate significantly. Together, these features create a comprehensive trading system that addresses every weakness of traditional retail trading approaches.
Advantages Over Traditional Systems
Unlike lagging oscillators like RSI or MACD that produce signals after price has already moved, the CRT Scanner identifies setups in real-time as they form. You're entering at the beginning of moves, not chasing them after they've already occurred. This means you get better entries, tighter stops, and larger profit potential.
Moving averages and trend-following systems often suffer from whipsaws during consolidation periods. The CRT Scanner focuses on institutional manipulation patterns that occur at all market phases, providing consistent opportunities regardless of market conditions. Whether the market is trending, ranging, or transitioning, this system finds high-probability setups.
Traditional price action trading requires years of experience to master pattern recognition and zone identification. This indicator automates that expertise, making institutional-level analysis accessible to traders of all skill levels. You don't need to be a veteran trader to identify valid CRT formations and key zones – the scanner does it all for you with mathematical precision.
Risk Management Redefined
The indicator's ranking system transforms risk management from a subjective exercise into a quantitative discipline. By presenting signals ordered by R:R ratio, it encourages you to take only the most favorable trades. This natural filtering process prevents overtrading and ensures your capital is always deployed where it has the highest mathematical expectancy.
The fixed stop-loss placement relative to recent swings provides logical invalidation levels. You're never guessing where to place your stop – it's always positioned at a level that makes sense based on market structure. This reduces the likelihood of being stopped out prematurely by random volatility while protecting against true trend reversals.
Time Efficiency Like Never Before
Manual CRT scanning across multiple timeframes and symbols is an exhausting, time-consuming process that few traders can sustain consistently. This indicator performs that analysis continuously and automatically, updating results with every scan. What would take hours of manual analysis each day is accomplished in seconds, freeing you to focus on execution and trade management.
Psychological Edge
Trading is as much about psychology as it is about strategy. This indicator provides clear, unambiguous signals that reduce the emotional burden of trading decisions. When you see a signal on the dashboard, you know it has passed through multiple layers of validation. This confidence reduces fear and hesitation, allowing you to execute trades decisively.
Scalability Across Instruments
The scanner handles up to 40 symbols simultaneously, making it perfect for traders who watch multiple currency pairs, indices, commodities, or cryptocurrencies. You can diversify your trading across uncorrelated instruments, reducing overall portfolio risk while maintaining consistent opportunity flow.
Investment Rationale
For serious traders, this indicator represents a minimal investment compared to the returns it can generate. Consider the cost of trading losses from poor entries, the value of your time saved by automation, and the profit potential from consistently taking high-R:R setups. The CRT Scanner pays for itself many times over with just a few successful trades.
Continuous Improvement Philosophy
The indicator's modular design and clearly commented code mean it can be adapted and enhanced as your trading evolves. The strict CRT definition, zone validation logic, and LTF confirmation rules are all based on proven institutional concepts that have stood the test of time across all market conditions.
Final Verdict - Your Trading Future Starts Here
This CRT Scanner represents the pinnacle of automated price action analysis. It combines institutional-grade pattern recognition, multi-timeframe confirmation, zone validation, risk-reward ranking, and visual trade management into one seamless package. Whether you're a novice trader looking to accelerate your learning curve or a seasoned professional seeking efficiency gains, this indicator provides the edge you need to succeed in today's competitive markets.