AIS Discrete Hartley Transform

このインジケーターは、離散ハートレー変換に基づいています。この変換を使用すると、財務時系列を処理するときにさまざまなアプローチを適用できます。このインジケーターの特徴は、その読み取り値がチャート上の1つのポイントではなく、インジケーター期間のすべてのポイントを参照していることです。
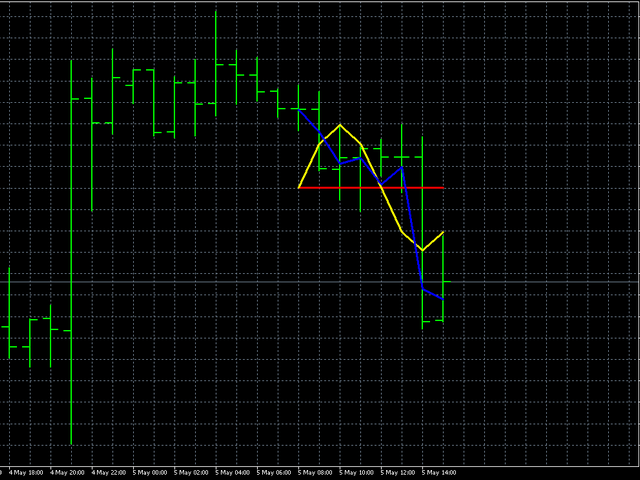
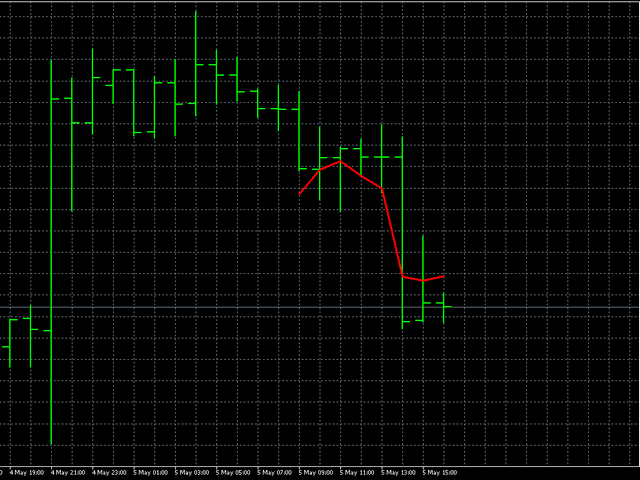
時系列を処理する場合、インジケーターを使用すると、時系列のさまざまな要素を選択できます。フィルタリングの最初の可能性は、このアプローチに基づいています。不要な高周波成分はすべて単に破棄されます。最初の図は、この方法の可能性を示しています。CutOffパラメーターを選択すると、元の時系列の詳細を選択できます(赤い線-主要な情報のみが残りますCutOff = 0、黄色-主要な最低周波数期間CutOff = 1 、青-最も高周波のノイズはすべて破棄されますCutOff = 4)。ただし、これが唯一の可能性ではありません。ノイズ成分は、追加のフィルタリングで抑制できます。
このインジケーターには両方のオプションが実装されています。そのパラメータは次のとおりです。
  • iPeriod-インジケーター期間
  • Shift-現在のバーを基準にしたインジケーターのシフト。このパラメーターを変更することにより、過去のインジケーターのパフォーマンスを評価できます。
  • NoiseReductionは、ノイズを減らす方法です。可能な値:なし-ノイズは抑制されません(この場合はCutOffパラメーターのみが機能します)、定数-ノイズは定数によって減衰されます、線形-線形ノイズ抑制、対数-対数減衰、平方-平方根に従ってノイズリダクションが発生します法則、二次-二次低減ノイズ、指数-指数ノイズ減衰。
  • CutOff-ノイズカット。このパラメーターの値が大きいほど、より多くの詳細が考慮されます。このパラメータの有効な値は0です-iPeriod-1
  • 定数-ノイズ抑制の量に影響を与える追加の定数。 NoiseReduction = noneの場合、この設定は使用されません。その有効な値は0〜255です。
おすすめのプロダクト
インディケータは現在のクオートを作成し、これを過去のものと比較して、これに基づいて価格変動予測を行います。インジケータには、目的の日付にすばやく移動するためのテキスト フィールドがあります。 オプション: シンボル - インジケーターが表示するシンボルの選択; SymbolPeriod - 指標がデータを取る期間の選択; IndicatorColor - インジケータの色; HorisontalShift - 指定されたバー数だけインディケータによって描画されたクオートのシフト; Inverse - true は引用符を逆にします。false - 元のビュー。 ChartVerticalShiftStep - チャートを垂直方向にシフトします (キーボードの上下矢印)。 次は日付を入力できるテキストフィールドの設定で、「Enter」を押すとすぐにジャンプできます。
Was: $299  Now: $99   Supply Demand uses previous price action to identify potential imbalances between buyers and sellers. The key is to identify the better odds zones, not just the untouched ones. Blahtech Supply Demand indicator delivers functionality previously unavailable on any trading platform. This 4-in-1 indicator not only highlights the higher probability zones using a multi-criteria strength engine, but also combines it with multi-timeframe trend analysis, previously confirmed swings
BoxChart MT4
Evgeny Shevtsov
4.4 (5)
The market is unfair if only because 10% of participants manage 90% of funds. An ordinary trader has slim changes to stand against these "vultures". This problem can be solved. You just need to be among these 10%, learn to predict their intentions and move with them. Volume is the only preemptive factor that faultlessly works on any timeframe and symbol. First, the volume appears and is accumulated, and only then the price moves. The price moves from one volume to another. Areas of volume accumu
Market Profile with Dashboard Indicator - Complete User Guide indicator Overview The Market Profile with Dashboard is a comprehensive trading analysis tool for MetaTrader 4 that displays market profile data, volume analysis, and key market structure information directly on your chart. This indicator helps traders identify significant price levels, market balance areas, and potential trading opportunities based on market profile theory. Core Components and Features Market Profile Display - Sh
Was: $249  Now: $99   Market Profile defines a number of day types that can help the trader to determine market behaviour. A key feature is the Value Area, representing the range of price action where 70% of trading took place. Understanding the Value Area can give traders valuable insight into market direction and establish the higher odds trade. It is an excellent addition to any system you may be using. Blahtech Limited presents their Market Profile indicator for the MetaTrader community. Ins
If you are using volume spread analysis, whether your are a beginner or an expert, this system will give you a lot of features and help in your analysis. Please watch the video to see all the features. Features With one click you will find all the VSA patterns on your chart . Bars without opening price. Easy to read volume indicator. Bar reader (Bar type - Close type - Volume type - Spread type). Daily and weekly levels (Pivot - Camarilla - Fibo). Very light on the trading platform and moving b
The indicator allows you to trade binary options. The recommended time frame is М1 and the expiration time is 1,2,3 minutes. The indicator suitable for auto and manual trading. A possible signal is specified as a arrows above/under a candle. You should wait until the candle closes! Arrows are not re-painted Trade sessions: TOKYO section (Half-end) Currency pairs: USD/JPY Working time frame: M1 Expiration time: 1,2,3 minutes. The indicator also shows good results when using the martingale strateg
FREE
The   Visual Volatility Clustering   indicator clusters the market based on volatility. The indicator does not redraw and gives accurate data, does not use closing prices. Uses the opening prices or the highs or lows of the previous completed bar. Therefore, all information will be clear and unambiguous. The essence of the indicator is to divide the price market into certain areas according to a similar type of volatility. This can be done in any way. In this example, the indicator is configure
Market Profile Shows where the price has spent more time, highlighting important levels that can be used in trading. It is a powerful tool which is designed to take the fundamental components which comprise every market; price/volume/time, and visually display their relationship in real-time as the market develops for a pre-determined time period. Very powerful tool!
Ugenesys AI MT4
Odaine Ramon Mcmillan
5 (1)
uGenesys AI - 90% Accurate Daytrading Indicator Introducing the ultimate forex trading indicator system, uGenesys AI, powered by cutting-edge AI technology and advanced analytical techniques, including Time-Series Analysis and Genetic Algorithms. Our AI-powered trading system leverages the power of time-series analysis to identify trends and patterns in historical price data, allowing traders to make informed predictions about future market movements. By analyzing vast amounts of data, our syst
AWキャンドルパターンインジケーターは、強力なキャンドルパターンスキャナーと組み合わせた高度なトレンドインジケーターの組み合わせです。これは、最も信頼性の高い30のローソク足パターンを認識して強調表示するための便利なツールです。さらに、それは色付きのバーに基づく現在の傾向分析器です。     サイズ変更と配置が可能なプラグインマルチタイムフレームトレンドパネル。トレンドフィルタリングに応じてパターンの表示を調整する独自の機能。 利点: キャンドルパターンを簡単に識別 結果を再描画しません 内蔵のマルチタイムトレンドパネル 無効なパターンタイプ(1、2、3キャンドル) パターン表示時のトレンドフィルタリングの調整 MT5 version - >   HERE   / Instructions and description  -> HERE 表示されるパターンのリスト: ハンマーパターン ピンアップ/ピンダウン 弱気なハラミ/強気なハラミ 弱気のハラミクロス/強気のハラミクロス ピボットポイント反転アップ/ピボットポイント反転ダウン ダブルバーローとハイクローズ/ダブルバーローとロークロ
The "MR Volume Profile Rectangles 4" indicator is a charting tool that displays trading volume at different price levels rather than time intervals. A key concept in volume profile is the point of control (POC) —the price level with the highest volume traded during the session or time range. While tools like VWAP or OBV provide volume trends, the "MR Volume Profile Rectangles 4" indicator offers granular detail about where the most market activity occurs at specific price levels. This makes it a
Market Profile Heat indicator  — is a classic Market Profile implementation that can show the price density over time, outlining the most important price levels, value area, and control value of a given trading session. This indicator can be attached to timeframes between M1 and D1 and will show the Market Profile for daily, weekly, monthly, or even intraday sessions. Lower timeframes offer higher precision. Higher timeframes are recommended for better visibility. It is also possible to use a fr
VPPD - Volume Profile POC Delta *Professional Volume Analysis Tool for MetaTrader 4* ---   INDICATOR FEATURES   Unique Capabilities: **Advanced Volume Profile** - Horizontal volume histograms across selected periods - Precise Point of Control (POC) identification — the level of maximum volume **Delta Analysis (Exclusive Feature!)** - Volume delta calculation — buy/sell ratio - Tick movement simulation inside bars - POC color coding:   - Green — Bullish delta (buyers dominate)   -
Simple QM Pattern is a powerful and intuitive trading indicator designed to simplify the identification of the Quasimodo (QM) trading pattern. The QM pattern is widely recognized among traders for effectively signaling potential reversals by highlighting key market structures and price action formations. This indicator helps traders easily visualize the QM pattern directly on their charts, making it straightforward even for those who are new to pattern trading. Simple QM Pattern includes dynamic
FREE
SX Supply Demand Zones accurately identifies and draws high-probability Supply and Demand zones using a sophisticated algorithm. Unlike traditional indicators that clutter your chart, this indicator is designed with a focus on performance and a clean user experience. New Unique Feature: Interactive Legend System What truly sets this indicator apart from everything else is the Interactive Control Legend. You have a professional dashboard directly on your chart that allows you to: Show/Hide: Ins
FREE
BoxProfile MT4
Evgeny Shevtsov
4.92 (12)
The indicator displays volume profiles based on the nesting principle. Profiles periods are pre-set so that each subsequent profile has a length twice as long as the length of the previous profile. In addition to profiles, the indicator displays volume clusters sorted by color, depending on the volume they contain. Indicator operation features The indicator works on typical timeframes from M5 to MN, but for calculations uses historical data from smaller timeframes: M1 - for timeframes from M5
FREE
Antabod Gamechanger
Rev Anthony Olusegun Aboderin
*Antabod GameChanger Indicator – Transform Your Trading!*   Are you tired of chasing trends too late or second-guessing your trades? The *Antabod GameChanger Indicator* is here to *revolutionize your trading strategy* and give you the edge you need in the markets!   Why Choose GameChanger? *Accurate Trend Detection* – GameChanger identifies trend reversals with *pinpoint accuracy*, ensuring you enter and exit trades at the optimal time.   *Clear Buy & Sell Signals* – No more guesswork! T
Indicator Description GOLD TITAN KING SIGNAL INDICATOR High-Precision Gold Scalping Buy/Sell Signals – Manual Trading Assistant Overview The Gold Titan King Signal Indicator is a manual trading assistant tool designed for high-frequency scalping on Gold (XAUUSD) and other major pairs. It generates clear BUY/SELL signals with precise entry levels, along with adjustable Stop Loss and Take Profit levels displayed directly on the chart. ️ This tool is NOT an EA. It does not execute trades
Meravith
Ivan Stefanov
5 (3)
マーケットメーカーのためのツール。 Meravith は次の機能を提供します: すべての時間足を分析し、現在有効なトレンドを表示します。 強気と弱気の出来高が等しくなる流動性ゾーン(出来高均衡)を強調表示します。 異なる時間足のすべての流動性レベルをチャート上に直接表示します。 テキスト形式の市場分析を生成し、参考情報として表示します。 現在のトレンドに基づいて目標値、サポートレベル、ストップロスを計算します。 取引のリスクリワード比を算出します。 口座残高に基づいてポジションサイズを計算し、潜在的な利益を推定します。 また、市場に大きな変化があった場合には警告を表示します。 インジケーターの主要ライン: 強気/弱気の出来高エグゾーストライン ― 目標値として機能します。 市場のトレンドを示すライン。市場が強気か弱気かによって色が変わり、トレンドのサポートとして機能します。主にその色が市場センチメントを示します。 出来高均衡ライン(Eq)。Eq(Volume Equilibrium)ラインはシステムの中核です。これは買い手と売り手の出来高のバランスポイントを表します。市場の流動性を示し
DracoAI is a revolutionary automated forex trading robot based on neural network.  Loss coverage is our premium exclusive feature. DracoAI IS: THE BEST MONEY MAKING SERVICE & STABLE PASSIVE INCOME PROFIT, EVEN IF YOU DO NOT PARTICIPATE IN BIDDING FINANCIAL INDEPENDENCE AND STABILITY DracoAI IS SAFE, BECAUSE: WE GUARANTEE THE SAFETY OF YOUR FUNDS NEGATIVE RESULTS OF TRADING ARE COVERED BY OUR RESERVE FUND 100% CONFIDENTIALITY Monitoring  - most popular signal at MQL5 :  https://www.mql5.com/en/s
VR Grid
Vladimir Pastushak
5 (3)
VR グリッド インジケーターは、ユーザー定義の設定を使用してグラフィカル グリッドを作成するように 設計 されています。 標準グリッド とは異なり、VR グリッドは 円形レベル を構築するために使用されます。ユーザーの選択に応じて、ラウンド レベル間のステップは任意に設定できます。さらに、他のインジケーターやユーティリティとは異なり、VR Grid は期間が変更されたり、端末が再起動されたりした場合でも、 グリッドの位置を維持 します。 設定、設定ファイル、デモ版、説明書、問題解決方法は、以下から入手できます。 [ブログ] レビューを読んだり書いたりすることができます。 [リンク] のバージョン [MetaTrader 5] 垂直レベル は実際の時間間隔に基づいており、 欠落している または存在しない期間は無視します。したがって、レベル間のステップは、ユーザーが選択した値に厳密に対応します。 VR グリッド インジケーターを使用すると、トレーダーは任意のレベルで 垂直線と水平線のスタイル 、色、太さを変更できます。これにより、金融商品の ラウンドレベル を制御できます。 ラウンド
FREE
Volume Profile Master Pro — Visible Range Volume Profile for MT4 Volume Profile Master Pro brings institutional-grade volume analysis to your MT4 charts. Unlike standard volume indicators that show when volume occurred, this tool shows where — at each price level — giving you a precise map of market activity to identify high-probability trade setups. OVERVIEW The indicator calculates and displays a Visible Range Volume Profile (VRVP) that automatically updates as you scroll the chart. Every time
Volume indicator Effect Volume , in the Forex market volumes are unique (tick). This volume indicator demonstrates the level of financial and emotional involvement. When the indicator forms a new top, it indicates that buyers are stronger than sellers over a certain period of time. If the indicator decreases, this indicates that the bears are stronger. Why is it impossible to track normal volumes in Forex? The fact is that this is an over-the-counter market. Consequently, it is practically imp
【V1.00】MTF NRPA 5 RSI RTDがリリースされました! 非再描画矢印リアルタイム ダッシュボード。 さまざまな RSI インジケーターを使用するのにうんざりしていて、それらが不正確であると感じた場合は、このツールを試してください。 通常、時間枠内の OBOS レベルを決定するために RSI を 1 つだけインストールします。 悪いニュースは、さまざまな時間枠の OBOS レベルと傾向を一度に確認できないことです。 それが私がこの取引ツールを開発した理由です。 それは次のように説明されています。 この取引ツールでは、5 つの RSI を使用します。 はい、5つです! デフォルトでは、RSI 1 と RSI 2 を大きな時間枠、つまり M30 に設定します。 RSI 1 と RSI 2 の交差は、M30 タイムフレームでトレンドの変化があることを意味します。 次に、現在の(小さい)時間枠に RSI 3 と RSI 4 を設定します。たとえば、M5 でチャートを開いたとします。 RSI 3 と RSI 4 の交差点は、現在のタイムフレーム (M5) でトレンドの変
Adjustable Consecutive Fractals  looks for 2 or more fractals in one direction and sends out a on screen alert, sound alert and push notification, for strong reversal points . Adjustable Consecutive Fractals, shows the fractals on chart along with a color changing text for buy and sell signals when one or more fractals appear on one side of price. Adjustable Consecutive Fractals is based Bill Williams Fractals . The standard Bill Williams fractals are set at a non adjustable 5 bars, BUT withe th
Descption: The Volume Profile displays detailed informations of historical trading activities at certain price levels (Market Profile). So you can locate the areas with the best prices in the market and get an advantage about other market participants. Features: Customizable Volume Profile / Market Profile Shows the "fair" Value Area with 70% of all Volume Shows critical low volume zones Shows VPOC, VAL and VAH Points Works on all timeframes Also available for MT5 ( https://www.mql5.com/en/mark
The Magneto Volume Trigger indicator is designed for determining the volume confirmed by the candlestick pattern and predicting the trend tendency. Indicator setup and use The calculation of values is affected by two parameters - Period and Gate . The lower the value of Gate , the higher the sensitivity of the indicator. Period allows making a sample of data for the specified number of candles. The lower the value of Period , the more the indicator is adapted to the current market conditions. I
Market Profile 3
Hussien Abdeltwab Hussien Ryad
3 (2)
Market Profile 3 MetaTrader 4 indicator  — is a classic Market Profile implementation that can show the price density over time, outlining the most important price levels, value area, and control value of a given trading session. This indicator can be attached to timeframes between M1 and D1 and will show the Market Profile for daily, weekly, monthly, or even intraday sessions. Lower timeframes offer higher precision. Higher timeframes are recommended for better visibility. It is also possible t
FREE
トレンドトレーディング は、タイミングのプルバックとブレイクアウトにより、市場で起こっているトレンドから可能な限り利益を得るように設計された指標です。確立されたトレンドの中で価格が何をしているかを分析することにより、取引の機会を見つけます。 [ インストールガイド | 更新ガイド | トラブルシューティング | よくある質問 | すべての製品 ] 自信を持って効率的に金融市場を取引する むち打ちにならずに確立されたトレンドから利益を得る 収益性の高いプルバック、ブレイクアウト、早期の逆転を認識する この指標は、独自の品質とパフォーマンスを分析します 複数時間枠のダッシュボードを実装します インジケーターは再描画されていません 電子メール/音声/視覚アラートを実装します 確立されたトレンドは多くの取引機会を提供しますが、ほとんどのトレンド指標はそれらを完全に無視しています。インジケーターの解釈はかなり簡単です: (1) トレンドの変化 (2) トレンドの方向への後退 (3) トレンドの方向へのブレイクアウト 赤いダッシュ は下降トレンド中の修正です 青いダッシュ は上昇トレンド中
このプロダクトを購入した人は以下も購入しています
An exclusive indicator that utilizes an innovative algorithm to swiftly and accurately determine the market trend. The indicator automatically calculates opening, closing, and profit levels, providing detailed trading statistics. With these features, you can choose the most appropriate trading instrument for the current market conditions. Additionally, you can easily integrate your own arrow indicators into Scalper Inside Pro to quickly evaluate their statistics and profitability. Scalper Inside
Dynamic Forex28 Navigator - 次世代の Forex 取引ツール。 現在 49% オフ。 Dynamic Forex28 Navigator は、長年人気のインジケーターを進化させたもので、3 つの機能を 1 つにまとめています。 Advanced Currency Strength28 インジケーター (レビュー 695 件)  + Advanced Currency IMPULSE with ALERT (レビュー 520 件) + CS28 コンボ シグナル (ボーナス)。 インジケーターの詳細 https://www.mql5.com/en/blogs/post/758844 次世代の Strength インジケーターが提供するもの  オリジナルで気に入っていたすべての機能が、新機能と精度の向上によって強化されました。 主な機能: 独自の通貨強度計算式。 すべての時間枠でスムーズかつ正確な強度ライン。 トレンドの特定と正確なエントリーに最適です。 ダイナミックマーケットフィボナッチレベル (マーケットフィボナッチ)。 このインジケーターに固有
GOLD Impulse with Alert
Bernhard Schweigert
4.64 (11)
このインディケータは、当社の2つの製品 Advanced Currency IMPULSE with ALERT  +   Currency Strength Exotics . のスーパーコンビネーションです。 このインジケーターは全ての時間枠で作動し、8つの主要通貨と1つのシンボルの強弱のインパルスをグラフで表示します。 このインジケータは、金、エキゾチックペア、商品、インデックス、先物など、あらゆるシンボルの通貨強度の加速度を表示することに特化されています。金、銀、原油、DAX、US30、MXN、TRY、CNHなどの通貨強度の加速度(インパルスまたは速度)を表示するために、任意のシンボルを9行目に追加できる、この種の最初のものです。 新しいアルゴリズムに基づいて構築され、潜在的な取引の特定と確認がさらに容易になりました。これは、通貨の強さや弱さが加速しているかどうかをグラフィカルに表示し、その加速の速度を測定するためです。加速すると物事は明らかに速く進みますが、これはFX市場でも同じです。つまり、反対方向に加速している通貨をペアリングすれば、潜在的に利益を生む取引を特定
現在40%OFF! このダッシュボードは、複数のシンボルと最大9つのタイムフレームで動作するソフトウェアの非常に強力な部分です。 このソフトは、弊社のメインインジケーター(ベストレビュー:Advanced Supply Demand)をベースにしています。    Advanced Supply Demand ダッシュボードは、素晴らしい概要を提供します。それは示しています。  ゾーン強度評価を含むフィルタリングされた需給値。 ゾーン内/ゾーンへのPips距離。 ネストされたゾーンがハイライトされます。 選択されたシンボルの4種類のアラートを全ての(9)時間枠で提供します。 それはあなたの個人的なニーズに合わせて高度に設定可能です。 あなたの利益! すべてのトレーダーにとって最も重要な質問です。 市場に参入するのに最適なレベルはどこか? 成功のチャンスとリスク/リターンを得るために、強力な供給/需要ゾーン内またはその近くで取引を開始します。 損切りの最適な位置はどこですか? 最も安全なのは、強力な供給/需要ゾーンの下/上にストップを置くことです。 最適な利益
現在40%OFF! 初心者やエキスパートトレーダーのためのベストソリューション! このダッシュボードソフトウェアは、28の通貨ペアで動作しています。それは私達の主要な指標(高度な通貨の強さ28と高度な通貨インパルス)の2に基づいています。それは全体の外国為替市場の大きい概観を与えます。それは、すべての(9)時間枠で28の外国為替ペアのための高度な通貨の強さの値、通貨の動きの速度と信号を示しています。チャート上で1つのインディケータを使用して市場全体を観察し、トレンドやスキャルピングの機会をピンポイントで見つけることができたら、あなたのトレードがどのように改善されるか想像してみてください。 このインディケータには、強い通貨と弱い通貨の識別、潜在的な取引の識別と確認がより簡単になるような機能が搭載されています。このインディケータは、通貨の強さや弱さが増加しているか減少しているか、また、すべての時間枠でどのように機能しているかをグラフィカルに表示します。 新機能として、現在の市場環境の変化に適応するダイナミックなマーケットフィボナッチレベルが追加され、すでに当社のAdvanced
Volatility Trend System - a trading system that gives signals for entries. The volatility system gives linear and point signals in the direction of the trend, as well as signals to exit it, without redrawing and delays. The trend indicator monitors the direction of the medium-term trend, shows the direction and its change. The signal indicator is based on changes in volatility and shows market entries. The indicator is equipped with several types of alerts. Can be applied to various trading ins
El indicador "MR BEAST ALERTAS DE LIQUIDEZ" es una herramienta avanzada diseñada para proporcionar señales y alertas sobre la liquidez del mercado basándose en una serie de indicadores técnicos y análisis de tendencias. Ideal para traders que buscan oportunidades de trading en función de la dinámica de precios y los niveles de volatilidad, este indicador ofrece una visualización clara y detallada en la ventana del gráfico de MetaTrader. Características Principales: Canal ATR Adaptativo: Calcula
このインジケーターは、反転ポイントと価格戻りゾーンを正確に表示します。     主要プレーヤー 。新たなトレンドが形成される場所を把握し、最大限の精度で意思決定を行い、すべての取引をコントロールします。 TREND LINES PRO インジケーターと組み合わせることで、その潜在能力を最大限に発揮します。 VERSION MT5 インジケーターが示す内容: 新しいトレンドの始まりに活性化する反転構造と反転レベル。 リスクと報酬の比率を最小限に抑えた利益 確定 と 損失停止の レベルの表示     RR 1:2   。 インテリジェントな削減ロジックによるストップロス。 指定されたインジケーターから 2 つのトレンド タイプの反転パターンを表示します。 指標: トレンドを追う   TREND LINES PRO   (世界的なトレンドの変化) TREND PRO   (クイックトレンド変更) シンプルで効果的   スキャナー   リアルタイムトレンド(新機能)。 マルチタイムフレームのインストゥルメント フィルタリング。 画面   利益     LOGIC AI信号の後。 当日プラス方
これはほぼ間違いなく、MetaTraderプラットフォームで見つけることができる最も完全な調和価格形成自動認識インジケーターです。 19種類のパターンを検出し、フィボナッチプロジェクションをあなたと同じように真剣に受け止め、潜在的逆転ゾーン(PRZ)を表示し、適切なストップロスとテイクプロフィットレベルを見つけます。 [ インストールガイド | 更新ガイド | トラブルシューティング | よくある質問 | すべての製品 ] 19の異なる調和価格形成を検出します プライマリ、派生および補完フィボナッチ投影(PRZ)をプロットします 過去の価格行動を評価し、過去のすべてのパターンを表示します この指標は、独自の品質とパフォーマンスを分析します 適切なストップロスとテイクプロフィットのレベルを表示します ブレイクアウトを使用して適切な取引を通知します すべてのパターン比をグラフにプロットします 電子メール/音声/視覚アラートを実装します スコット・M・カーニーの本に着想を得て、この指標は最も純粋で急を要するトレーダーのニーズを満たすように設計されています。ただし、トレードを容易にする
Weis Wave with Alert
Trade The Volume Waves Single Member P.C.
4.82 (22)
Rental/Lifetime Package Options and Privileges' Rent Monthly Six Months   Yearly/Lifetime Weis Wave with Speed with Alert+Speed Index x x x Manual  x x x Quick Set up Video x x x Blog x x x Lifetime Updates x x x Setup and Training Material x x Rectangle Break Alert Tool      x Discord Access Channel "The SI traders" x   How to trade info visit:    http://www.tradethevolumewaves.com   ** If you purchase please contact me to setup your  : training Room and  complete manual access.  This is
チャートを構成し、周期的な価格変動を識別するテクニカル指標。 どのチャートでも動作します。 いくつかの種類の通知。 グラフ自体に追加の矢印があります。 履歴を再描画せずに、キャンドルのクローズに取り組みます。 M5以上のTFを推奨します。 パラメータの使用と設定が簡単です。 異なるパラメータを持つ 2 つのインジケーターを使用する場合、他のインジケーターなしで使用できます。 入力パラメータは2つあります 周期性と信号持続時間 これら 2 つのパラメータは、チャート構造の処理を扱います。 Cyclicity - 反転サイクルが変化する頻度を調整し、サイクルを滑らかにします。 Signal duration - 最小数では価格変動の衝動を検出し、最大数では長期的なトレンドの動きを検出します。
現在20%OFF! 初心者やエキスパートトレーダーに最適なソリューションです。 このインディケータは、エキゾチックペア・コモディティ・インデックス・先物など、あらゆるシンボルの通貨の強さを表示することに特化したインディケータです。金、銀、原油、DAX、US30、MXN、TRY、CNHなどの通貨の強さを表示するために、9行目にどのシンボルでも追加することができます。独自の機能を多数搭載し、新しい計算式を採用したため、ユニークで高品質、かつ手頃な価格のトレーディングツールとなっています。新しいトレンドやスキャルピングチャンスのトリガーポイントを正確に把握することができるため、あなたのトレードがどのように改善されるか想像してみてください。 ユーザーマニュアル:ここをクリック   https://www.mql5.com/en/blogs/post/708876 すべての時間枠に対応します。あなたはすぐにトレンドを見ることができるようになります! 新しいアルゴリズムに基づいて設計されているため、潜在的な取引の特定と確認がより簡単になります。これは、8つの主要通貨と1つのシンボルの強弱
No Repaint Bext は完全な取引システムです。エントリーとエグジットのタイミング、そして取引の方向を示します。 緑の矢印 が表示されるたびに、 買い注文 を開きます。 赤い矢印 が表示されたら、すべての買い注文を閉じます。 同様に、 赤い矢印 が表示されたら、 売り注文 を開き、 緑の矢印 が表示されたらすべての売り注文を閉じます。 取引には M5(1分足) を使用し、 どの通貨ペアでも取引可能 です。 このインジケーターは 再描画されず 、ほとんど遅延しません。ただし、 ローソク足が確定するまで待つ という自然な条件はあります。 RSI フィルター と**2 つのクラシックな反転パターン(エンゴルフィング、ピンバー)**を使用し、反転の瞬間をほぼリアルタイムで捉えます。 インジケーターの効果的な使い方 どの通貨ペアでも使用可能 (テスト済み: GBPUSD, EURUSD ) 時間足:M5(1分足) 初期資金:500ドル以上 取引ロット:0.01 緑の矢印 が表示されたら、買い注文を開く。 赤い矢印 が表示されたら、すべての買い注文を閉じる。 赤い矢印 が表示されたら、売
Are you looking for a simple and reliable indicator that can help you spot market swing points easily? Do you want clear buy and sell signals that work on any timeframe and any trading instrument? Buy Sell Signal Pro is designed to do exactly that. It helps traders identify important market turning points and understand the current market structure in a clear and easy way. This indicator detects Higher Highs (HH), Higher Lows (HL), Lower Highs (LH), and Lower Lows (LL) so you can quickly see wh
Super Signal – Skyblade Edition プロ仕様のノンリペイント / ノーラグ・トレンドシグナルシステム。卓越した勝率を実現 | MT4 / MT5 対応 1分足、5分足、15分足などの低い時間足で最も効果を発揮します。 主な特徴: Super Signal – Skyblade Edition は、トレンド取引に特化したスマートなシグナルシステムです。マルチレイヤーのフィルターロジックを用いて、明確な方向性と実際のモメンタムに支えられた強力なトレンドのみを検出します。 このシステムは 天井や底を予測するものではありません 。次の3つの条件がすべて満たされた場合にのみシグナルを発生させます: 明確なトレンド方向 モメンタムの増加 健全なボラティリティ構造 市場セッションに基づく流動性分析と組み合わせることで、シグナルの精度とタイミングがさらに向上します。 シグナルの特性: すべての矢印シグナルは 100% 非リペイント / 遅延なし 一度出現したシグナルは固定され、点滅・消失しません チャート上の矢印、情報パネル、ポップアップ通知、音声アラート、プッシュ通知
OFFER OFFER! The price of the indicator is kept at 75 dollars only from 20th Feb to 28th Feb. Full Fledged EA and Alert plus for alerts will also be provided in this offer along with the purchase of Indicator. Limited copies only at this price and Ea too. Grab your copy soon Alert plus for indicator with set file is kept in comment section with the image  SMC Blast Signal with FVG, BOS and trend Breakout The SMC Blast Signal is a Precise trading system for Meta Trader 4 that uses Smart Money Con
Miraculous Indicator – ガン・スクエア・オブ・ナインに基づく100%非リペイントのFXおよびバイナリーツール この動画では、FXおよびバイナリーオプションのトレーダー向けに特別に開発された、非常に正確で強力な取引ツールである Miraculous Indicator を紹介しています。このインジケーターがユニークなのは、伝説的な ガン・スクエア・オブ・ナイン と ガンの振動の法則 に基づいている点で、現代の取引で利用できる最も正確な予測ツールの一つとなっています。 Miraculous Indicatorは 完全に非リペイント であり、ローソク足が確定した後にシグナルが変化したり消えたりすることはありません。つまり、見たものがそのまま利用できます。これにより、トレーダーは自信を持ってエントリーおよびエグジットを行うための信頼性と一貫性のある根拠を得ることができます。 主な特徴: ガン・スクエア・オブ・ナインとガン理論に基づいて構築 100%非リペイントのシグナルシステム すべての時間枠(M1、M5、H1、H4、日足、週足)で機能 FXおよびバイナリーオプション取引
Looking for a powerful yet lightweight swing detector that accurately identifies market structure turning points? Want clear, reliable buy and sell signals that work across any timeframe and any instrument? Buy Sell Arrow MT Swing is built exactly for that — precision swing detection made simple and effective. This indicator identifies Higher Highs (HH) , Higher Lows (HL) , Lower Highs (LH) , and Lower Lows (LL) with remarkable clarity. It is designed to help traders easily visualize market stru
PairMaster Buy Sell Arrow Indicator for MT4 Trade Reversals Like a Pro — Catch Every Swing Point with Precision The PairMaster Buy Sell Arrow Indicator is a powerful MetaTrader 4 tool built to identify high-probability swing trading opportunities . Designed for traders who value accuracy, clarity, and simplicity, PairMaster detects key market turning points and plots intuitive buy and sell arrows directly on your chart. Key Features Accurate Swing Point Detection – Automatically identifies ma
System Trend Pro - This is the best trend trading indicator!!! The indicator no repaint!!!  The indicator has   MTF   mode, which adds confidence to trading on the trend (   no repaint   ). How to trade? Everything is very simple, we wait for the first signal (big arrow), then wait for the second signal (small arrow) and enter the market in the direction of the arrow. (See screens 1 and 2.) Exit on the opposite signal or take 20-30 pips, close half of it, and keep the rest until the opposite
"Dragon's Tail" is an integrated trading system, not just an indicator. This system analyzes each candle on a minute-by-minute basis, which is particularly effective in high market volatility conditions. The "Dragon's Tail" system identifies key market moments referred to as "bull and bear battles". Based on these "battles", the system gives trade direction recommendations. In the case of an arrow appearing on the chart, this signals the possibility of opening two trades in the indicated directi
「 Dynamic Scalper System 」インジケーターは、トレンド波の中でスキャルピング取引を行う手法のために設計されています。 主要通貨ペアと金でテスト済みで、他の取引商品との互換性があります。 トレンドに沿った短期的なポジションオープンのシグナルを提供し、追加の価格変動サポートも提供します。 インジケーターの原理 大きな矢印はトレンドの方向を決定します。 トレンド波の中では、小さな矢印の形でスキャルピングシグナルを生成するアルゴリズムが機能します。 赤い矢印は強気方向、青い矢印は弱気方向です。 トレンドの方向には敏感な価格変動ラインが描かれ、小さな矢印のシグナルと連動します。 シグナルは次のように機能します。適切なタイミングでラインが現れるとエントリーシグナルが形成され、ラインが開いている間はポジションが保持され、完了すると取引が終了します。 推奨される動作時間枠はM1~H4です。 矢印は現在のローソク足に形成され、次のローソク足が開いている場合は、前のローソク足の矢印は再描画されません。 入力パラメータ Trend Wave Period - トレンド方向
Advanced version of CyberZingFx Volume Plus, the ultimate MT4 indicator for traders seeking highly accurate buy and sell signals. With an additional strategy and price action dot signals that enhances its effectiveness, this indicator offers a superior trading experience for professionals and beginners alike. The CyberZingFx Volume Plus Advanced version combines the power of volume analysis and historical price data with an additional strategy, resulting in even more precise and reliable signals
Presenting one-of-a-kind Gann Indicator for XAUUSD IQ Gold Gann Levels is a non-repainting, precision tool designed exclusively for XAUUSD/Gold intraday trading. It uses W.D. Gann’s square root method to plot real-time support and resistance levels, helping traders spot high-probability entries with confidence and clarity. William Delbert Gann (W.D. Gann) was an exceptional market analyst whose trading technique was based on a complex blend of mathematics, geometry, astrology, and ancient calcul
GM Arrows Pro
Guillaume Pierre Philippe Mesplont
Product Name: GM Arrows Pro – Signals & Alerts Short Description: GM Arrows Pro is a clean, reliable MT4 indicator showing BUY/SELL arrows on the chart with unique alerts at the moment the signal appears. Full Description: GM Arrows Pro is a professional MT4 indicator designed for traders who want clear, actionable signals: BUY and SELL arrows visible on the entire chart history Unique alerts when a new signal appears (no repeated alerts) Option to disable repetitive signals ( disable_repeatin
The Super Arrow Indicator provides non-repainting buy and sell signals with exceptional accuracy. Key Features No repainting – confirmed signals remain fixed Clear visual arrows: green for buy, red for sell Real-time alerts via pop-up, sound, and optional email Clean chart view with no unnecessary clutter Works on all markets: Forex, gold, oil, indices, crypto Adjustable Parameters TimeFrame Default: "current time frame" Function: Sets the time frame for indicator calculation Options: Can be set
Precautions for subscribing to indicator This indicator only supports the computer version of MT4 Does not support MT5, mobile phones, tablets The indicator only shows the day's entry arrow The previous history arrow will not be displayed (Live broadcast is for demonstration) The indicator is a trading aid Is not a EA automatic trading No copy trading function The indicator only indicates the entry position No exit (target profit)  The entry stop loss point is set at 30-50 PIPS Or the front hi
KT Trend Trading Suite は、トレンドフォロー戦略と複数のブレイクアウトポイントを組み合わせた多機能インジケーターです。 新たなトレンドが形成されると、このインジケーターは複数のエントリーチャンスを提供し、トレンドにうまく乗ることが可能になります。あまり重要でないエントリーポイントを避けるために、プルバックの閾値が使用されます。 MT5 バージョンはこちらで入手可能です  https://www.mql5.com/en/market/product/46270 機能 市場のさまざまなダイナミクスを1つの方程式にまとめ、トレンドの全体像を明確に描写します。 エントリーシグナルに基づいて、局所的な高値と安値を視覚的に示す長方形を描画します。 シグナルの精度を自動的に測定し、パフォーマンス指標をシンプルに表示します。 複数時間足対応のダッシュボードを搭載し、すべての時間軸をスキャンして、それぞれのトレンド方向を表示します。 入力パラメータ History Bars:   過去のシグナル分析に使用する履歴バーの数。  Signals Period:   エントリ
IQ FX Gann Levels a precision trading indicator based on W.D. Gann’s square root methods . It plots real-time, non-repainting support and resistance levels to help traders confidently spot intraday and scalping opportunities with high accuracy. William Delbert Gann (W.D. Gann) was an exceptional market analyst, whose trading technique was based on a complex blend of mathematics, geometry, astrology, and ancient mathematics which proved to be extremely accurate. Setup & Guide:  Download  MT5 Ver
Introducing a powerful, precision-engineered indicator that seamlessly combines Pivot Points, Moving Averages, and Multi-Timeframe Analysis to deliver high-probability Buy and Sell signals in real-time. This tool is your strategic edge, designed to identify trend reversals, market momentum, and optimal trade entries, no matter your preferred trading style. Our algorithm goes beyond standard indicators—by analyzing multiple timeframes simultaneously, it spots true market turning points while fi
作者のその他のプロダクト
このスクリプトは、乱数ジェネレータを使用した貿易取引のシミュレーションに基づいています。これにより、同じ入力パラメータでもまったく異なる結果を得ることができます。スクリプトを実行すると、ダイアログボックスが開き、そこで外部変数に必要な値を設定できます。 ブロックでは、TradingOptionsは取引のシミュレーションに必要な基本パラメータを定義します。 StartBalance   - トレードバランスの初期サイズを設定します。 NumberTrade   - スクリプトの実行時にモデル化される取引トランザクションの数を設定します。多かれ少なかれ有意な結果を得るためには、このパラメータが30より大きいことが必要です。 ProbilityWinning   - 勝ち取引の確率。パーセンテージで示され、1から99までの有効値。 Min.StopLoss   -  StopLossの最小値をポイントで示します。これは、取引操作をモデル化するときに使用されます。 Max.StopLoss   -  StopLossの最大値をポイント単位で設定します。 PositiveWin  - この変数
FREE
This script allows selecting the TakeProfit and StopLoss levels. It analyzes the history data, and then calculates the probability of reaching a given price level. How the script works Suppose you have a trading strategy and you want to select the TakeProfit and StopLoss levels. Run the script and set the parameter: Number of Bars - the average position holding time in bars. Once the script operation is complete, the AIS-PPL.csv file will be created in the Files folder in the terminal data cata
FREE
このスクリプトは、トレーダーが可能な利益と損失の比率が最適になる貿易取引の平均期間を決定できるように設計されています。 まず、貿易取引の最適期間を決定するための一般的なアプローチを見てみましょう。以下の変数を紹介します。 R   - トランザクションの結果 T   - トランザクションが開かれていた時間 W  - 前のトランザクションの終了と次のトランザクションの開始の間の時間 すべてのトレーダーは、最短時間で最大の利益を得ることを目指しています。この欲求は次の簡単な表現で説明できます。 R/(T+W)→max 。 変数  T  と  W  がトレードの合計期間と行われたトランザクションの数の両方に依存することは明らかです。トランザクションの平均期間を  ATD  、トランザクションの合計数を  N  とします。その場合、トランザクションの平均期間は、合計の平方根に比例して増加するはずです。つまり、 ATD~√N しかし、現存する十分に根拠のある質問があります - 他の取引期間と同等の取引期間はありますか?そして、取引期間はトレーディング業務の結果にどのように影響しますか?提起された質
FREE
このスクリプトは、乱数ジェネレータを使用した貿易取引のシミュレーションに基づいています。これにより、同じ入力パラメータでもまったく異なる結果を得ることができます。スクリプトを実行すると、ダイアログボックスが開き、そこで外部変数に必要な値を設定できます。 ブロックでは、TradingOptionsは取引のシミュレーションに必要な基本パラメータを定義します。 StartBalance   - トレードバランスの初期サイズを設定します。 NumberTrade   - スクリプトの実行時にモデル化される取引トランザクションの数を設定します。多かれ少なかれ有意な結果を得るためには、このパラメータが30より大きいことが必要です。 ProbilityWinning   - 勝ち取引の確率。パーセンテージで示され、1から99までの有効値。 Min.StopLoss   -  StopLossの最小値をポイントで示します。これは、取引操作をモデル化するときに使用されます。 Max.StopLoss   -  StopLossの最大値をポイント単位で設定します。 PositiveWin - この変数は
FREE
ストップロスとテイクプロフィットのレベルを選択すると、トレーディングの全体的なパフォーマンスに非常に強い影響を与える可能性があります。貿易取引の明白なパラメータ - 可能な勝利または予想される損失の大きさ - に加えて、StopLossおよびTakeProfitのレベルもまた、取引の予想期間、および一般的な取引の収益性に影響します。 「 AIS-ODT 」スクリプトを使用して最適なトランザクション期間をすでに決定している場合は、StopLossおよびTakeProfitレベルに関連したパラメーターの決定を始めることができます。 これを行うには、以下の手順に従います。最初に、私達は1つの方向か別の方向のすべての可能な価格偏差を決定し、一定時間内にそれらを達成する確率を計算します。その後、その規模、確率、および利益の期待値を考慮して、StopLossとTakeProfitの最も最適なレベルを計算できます。 これを行うには、目的の通貨ペアと目的の時間枠のチャートでスクリプトを実行します。プロパティウィンドウでILBパラメータを使用して、取引ポジションの希望期間を小節数で設定します。ユーティリ
FREE
The script analyzes the history of quotes and gives recommendations on the minimum deposit. The calculations take into account the variability of prices and the standard deviation. Margin requirements for the instrument are also taken into account. The result of the script is the minimum recommended deposit for trading the given currency pair.
FREE
The script allows selecting the required 'Filter level' value of the AIS-MTF MT5 indicator. Run the script on the required chart and selected timeframe. Once its operation is complete, the HPS.csv file will be created in the Files folder. Open the file. You will see three columns. The 'Filter lvl' column represents the value of the 'Filter level' for the AIS-MTF indicator. Am. dev. - degree and direction of the indicator's deviation from the price level (sorted in ascending order). Negative valu
FREE
This script allows selecting the TakeProfit and StopLoss levels. It analyzes the history data, and then calculates the probability of reaching a given price level. How the script works Suppose you have a trading strategy and you want to select the TakeProfit and StopLoss levels. Run the script and set the parameter: Number of Bars - the average position holding time in bars. Once the script operation is complete, the AIS-PPL.csv file will be created in the Files folder in the terminal data cata
FREE
MinDeposit
Aleksej Poljakov
5 (1)
The script analyzes the history of quotes and gives recommendations on the minimum deposit. The calculations take into account the variability of prices and the standard deviation. Margin requirements for the instrument are also taken into account. The result of the script is the minimum recommended deposit for trading the given currency pair.
FREE
このスクリプトは、トレーダーが可能な利益と損失の比率が最適になる貿易取引の平均期間を決定できるように設計されています。 まず、貿易取引の最適期間を決定するための一般的なアプローチを見てみましょう。以下の変数を紹介します。 R   - トランザクションの結果 T   - トランザクションが開かれていた時間 W - 前のトランザクションの終了と次のトランザクションの開始の間の時間 すべてのトレーダーは、最短時間で最大の利益を得ることを目指しています。この欲求は次の簡単な表現で説明できます。 R/(T+W)→max 。 変数 T と W がトレードの合計期間と行われたトランザクションの数の両方に依存することは明らかです。トランザクションの平均期間を ATD 、トランザクションの合計数を N とします。その場合、トランザクションの平均期間は、合計の平方根に比例して増加するはずです。つまり、 ATD~√N しかし、現存する十分に根拠のある質問があります - 他の取引期間と同等の取引期間はありますか?そして、取引期間はトレーディング業務の結果にどのように影響しますか?提起された質問への回答を得るた
FREE
The script allows selecting the required 'Filter level' value of the AIS-MTF indicator. Run the script on the required chart and selected timeframe. Once its operation is complete, the HPS.csv file will be created in the Files folder. Open the file. You will see three columns. The 'Filter lvl' column represents the value of the 'Filter level' for the AIS-MTF indicator. Am. dev. - degree and direction of the indicator's deviation from the price level (sorted in ascending order). Negative values i
FREE
AIS 正しい平均インジケーターを使用すると、市場でのトレンドの動きの始まりを設定できます。インジケーターのもう 1 つの重要な品質は、トレンドの終わりの明確なシグナルです。指標は再描画または再計算されません。 表示値 h_AE - AE チャネルの上限 l_AE - AE チャンネルの下限 h_EC - 現在のバーの高予測値 l_EC - 現在のバーの低い予測値 インジケーターを操作するときのシグナル 主な信号は、チャネル AE と EC の交差点です。 l_EC ラインが h_AE ラインより上にある場合、上昇トレンドが始まる可能性があります。 h_EC ラインが l_AE ラインを下回った後、下降トレンドの始まりが予想されます。 この場合、h_AE ラインと l_AE ラインの間のチャネル幅に注意する必要があります。両者の差が大きければ大きいほど、トレンドは強くなります。 AEチャンネルによる局所的な高値・安値の達成にも注意が必要です。この時、価格変動のトレンドが最も強くなります。 カスタマイズ可能な指標パラメータ インディケータを設定するには、時間枠に応じて
AIS 加重移動平均インジケーターは、加重移動平均を計算し、トレンド市場の動きの始まりを判断できるようにします。 重み係数は、各バーの特定の機能を考慮して計算されます。これにより、ランダムな市場の動きを除外できます。 トレンドの開始を確認する主なシグナルは、インジケーター ラインの方向の変化と、インジケーター ラインを超える価格です。 WH (青い線) は高値の加重平均です。 WL (赤い線) は安値の加重平均です。 WS (緑色の線) は、すべての価格ポイントの加重平均です。 オプション LH - 値を計算するバーの数。 LH をすばやく選択するには、まず、より高い時間枠の倍数である値を確認する必要があります。 たとえば、インジケータは M15 に設定されます。 次に、LHの次の値を確認します M30/M15=2 H1/M15 = 4 H4/M15 = 16 D1/M15 = 96 W1/M15=480 それらの中間の値も興味深い場合があります。
AIS Advanced Grade Feasibility インジケーターは、価格が将来到達する可能性のあるレベルを予測するように設計されています。彼の仕事は、最後の 3 つのバーを分析し、それに基づいて予測を作成することです。この指標は、任意の時間枠および任意の通貨ペアで使用できます。設定の助けを借りて、予測の望ましい品質を達成できます。 予測の深さ - 望ましい予測の深さをバーで設定します。このパラメーターは、18 ~ 31 の範囲で選択することをお勧めします。 これらの制限を超えることができます。ただし、この場合、予測レベルの「固着」(18 未満の値の場合)、またはレベルの過度の幅 (31 より大きい値の場合) のいずれかが可能です。 信頼水準 1、信頼水準 2、および信頼水準 3 - 信頼水準を予測します。 1~99の範囲で設定可能。信頼度 1 は信頼度 2 よりも大きく、信頼度 3 は最も小さくする必要があります。 これらの各レベルは、予測の深さパラメーターによって決定されるバーの数について、価格がこの値に到達する確率のパーセンテージを示します。 Color lvl
The indicator is designed to measure the price volatility. This allows determining the moments for opening or closing trade positions more accurately. High intensity of the market indicates the instability of its movement, but allows for better results. And, conversely, low intensity of the market indicates the stability of its movement. Parameters Bars to process - the number of bars to measure the price movements. A low value of this parameter allows determining the moments of rapid price mov
This indicator uses the Fibonacci p-numbers to smooth a price series. This allows combining the advantages of the simple and exponential moving averages. The smoothing coefficients depend on the level of the p-number, which is set in the indicator parameters. The higher the level, the greater the influence of the simple moving average and the less significant the exponential moving average. Parameters Fibonacci Numbers Order - order of the Fibonacci p-number, specified by trader. Valid values a
The indicator is based on the analysis of interaction of two filters. The first filter is the popular Moving Average. It helps to identify linear price movements and to smooth minor price fluctuations. The second filter is the Sliding Median. It is a non-linear filter. It allows to filter out noise and single spikes in the price movement. A predictive filter implemented in this indicator is based on the difference between these filters. The indicator is trained during operation and is therefore
This indicator studies the price action as a combination of micro-trends. All micro-trends are analyzed and averaged. Price movement is filtered based on this averaging. IP_High and IP_Low (blue and red dashed lines) show the instantaneous price movement. They display the forecast only for the current price values, taking into account only the number of bars defined by the 'Filter level' parameter. SP_High and SP_Low (blue and red solid lines) smooth the price movements with respect to history.
このインジケーターは、単純な線形平滑化プロセスを実装します。 指数平滑化の欠点の 1 つは、信号が急速に減衰することです。これにより、価格帯の長期トレンドを完全に追跡することは不可能になります。線形平滑化により、信号のフィルタリングをより正確かつ細かく調整できます。 インジケーターは、パラメーターを選択して構成されます。 LP - このパラメーターを使用すると、平滑化期間を選択できます。値が大きいほど、インジケーターが表示する長期的なトレンドが多くなります。有効な値は 0 ~ 255 です。 SP - このパラメーターはインジケーターの感度に影響します。このパラメータが大きいほど、価格系列の最後の値の影響が大きくなります.このパラメータの値がゼロの場合、インジケータは LP+1 に等しい期間の単純移動平均を表示します。有効な値は 0 ~ 255 です。
この指標は、中央値プロパティと移動平均プロパティの組み合わせに基づくシーケンシャルハイブリッドフィルターです。 中央値を使用すると、異常値と価格系列の値のランダムなインパルスを除外できます。同時に、メディアンフィルタは価格変動のトレンドに影響を与えず、それを変更しません。 メディアンフィルタは非線形なので、単純移動平均を使用した平均化を使用してその値を平滑化します。このアプローチにより、トレンドだけでなく、価格変動の周期的な要素もより正確に特定できます。さらに、それは価格の変化に対するインディケータの感度を高め、そしてプライスシリーズとインディケータの読みの間の遅れを減らします。これにより、指標は新しいトレンドの始まりと FL パラメーターを使用して、フィルタ古いトレンドの終わりについてかなり正確に警告することができます。 ーの深さと感度を調整できます。許容値は0から63です。同時に、 2 * FL + 1 バーを使用して指標値を計算します。したがって、FLの値が大きいほど、価格チャートの傾向が強く表示されます。
この指標は、2つの修正されたLanczosフィルタの組み合わせです。 最初のフィルターは、価格を推定するのに役立ちます。過去の値に基づいて、彼は現在のバー内で起こりうる価格変動を予測します。つまり、過去の傾向が変わらない場合の価格はどうなるかを示しています。 ウィンドウ内の価格を平滑化および平均化するための2番目のフィルタ。フィルタのレベルによって決まります。ウェイトの選択のおかげで、このフィルタは価格変動の中にある周期成分に最も積極的に反応します。 指標は EF および IF パラメータを使用して調整できます。 EF と IF の値を選択することで、トレンド価格変動の始まりに関するシグナルを得ることができます。 EF   - 指数フィルタのウィンドウサイズ。有効な値は EF = 0 ... 255 です。計算中に処理された小節の数は 2 * EF + 1 です。このパラメータが大きいほど、価格系列の過去の値の影響が強くなります。結果は実線でプロットされています。 IF   - 平均化ウィンドウのサイズを調整します。  IF = 0 ... 255 の値計算されるバーの数は 2 * I
外国為替市場における価格変動の性質を見てみましょう。これらの変動が起こる理由に注意を払わないでください。このアプローチにより、価格変動に影響を与える主な要因を特定することができます。 たとえば、EUR-USD通貨ペアのバーの始値とH1タイムフレームを考えてみましょう。これらの価格について、Lameray図(図1)を構築します。 この図では、価格変動は基本的に線形方程式に従って発生することがわかります。この方程式のパラメータを決定するために、最小二乗法を使用できます。この特定の例では、始値を変更するための方程式は次の形式を取りました。 Open [i] = 0.99989 * Open [i + 1] + 0.00013。 この式が価格変動をどの程度適切に表しているかを確認しましょう。これを行うために、線形成分を取り除き、残差を分析します(図2)。 図から明らかになるように、これらの剰余はかなり混沌としており、それらをノイズと見なすと、次の小節の始値を予測するためのかなり簡単なシステムが得られます。
この指標はより有益です。彼の研究は、市場における価格の動きが特定の色のノイズとして表現されるという仮定に基づいており、それは価格値の分布のパラメータに依存します。これにより、さまざまな角度から価格変動を分析することができ、価格変動を特定の色のノイズと見なして、市場の現在の状況に関する情報を入手し、価格の動向に関する予測を行うことができます。 インディケータの読みを分析するとき、インディケータラインの位置は考慮に入れられます - それらは現在のバーの始値の上下にそしてそれからどれだけ離れて位置しています。 ホワイトノイズ(White Noise) - このアプローチは、価格(現在と先史時代の両方)が電力で等しいと考えられているという事実によって特徴付けられ、それはそれを単純な移動平均と組み合わせます。ホワイトノイズ信号は、文字を確認している可能性が高く、現在の価格から逸脱するほど、市場のトレンドの動きが強くなります。逆に、ホワイトノイズラインが始値に近い場合、これはトレンドの終わりまたは横方向の価格変動のいずれかの証拠です。 フリッカーノイズ(Flicker Noise)はトレンドの上
「 AIS Color Noise Filter 」指標のいくつかの欠点にもかかわらず、それを使用して価格系列と予測価格を平滑化するという考えは非常に魅力的に見えます。 これはいくつかの理由によるものです。 第一に、いくつかのノイズ成分を考慮に入れることは、互いに独立した要因について予測を構築することを可能にし、それは予測の質を改善することができる。 第二に、価格系列の雑音特性は全履歴を通して非常に安定して振舞い、それは安定した結果を得ることを可能にする。 そして最後に、ノイズの変動性により、予測システムが非常に敏感になり、価格の変化に対する反応が非常に速くなることを期待できます。 その結果、すべての単純化にもかかわらず、価格が移動するチャネルを正確に予測できるという指標が得られました。この指標の主な利点は、その高速さと習得の容易さです。主な不利点は、指標が予測に最も重要な要素を選択できないことです。 LH は、予測が行われる履歴データの長さを設定するパラメータです。その許容値は0から255ですが、標識が処理する小節の数はこのパラメーターで指定された数より1単位以上多いです。 
非常に頻繁に、金融シリーズの研究でそれらの平滑化を適用します。平滑化を使用すると、高周波成分を除去することができます - それらはランダムな要因によって引き起こされているため、無関係であると考えられています。平滑化には常に、データを平均化する何らかの方法が含まれます。この方法では、時系列のランダムな変化が相互に吸収します。ほとんどの場合、この目的のために、指数平滑法と同様に単純または加重移動平均法が使用されます。 これらの方法にはそれぞれ、長所と短所があります。したがって、単純な移動平均は単純で直感的ですが、その適用には時系列の周期成分と傾向成分の​​相対的な安定性が必要です。さらに、信号遅延は移動平均の特性です。指数平滑法はラグ効果がありません。しかし、ここでも欠陥があります - 指数平滑化は、系列をランダムな異常値と整列させる場合にのみ有効です。 単純平均と指数平均の間の妥当な妥協点は、加重移動平均の使用です。しかしながら、特定の重量値を選ぶという問題がある。これをまとめてみましょう。 それで、最初に私達が平滑化手順から達成したいことを定義します: •まず、価格系列からランダムな
長期の非ランダム成分を分離するためには、価格がどれだけ変化したのかだけでなく、これらの変化がどのように発生したのかも知る必要があります。言い換えれば - 私たちは価格レベルの値だけでなく、これらのレベルが互いに置き換わる順序にも興味があります。このアプローチを通して、ある時点での価格変動に影響を与える(または影響を与える可能性がある)長期的で安定した要因を見つけることができます。そしてこれらの要因の知識はあなたが多かれ少なかれ正確な予測をすることを可能にします。 金融系列の分析からどの程度具体的な結果を得たいのかを判断しましょう。 •まず、トレンドが市場に存在する場合は、そのトレンドを強調する必要があります。 •次に、定期的な要素を特定する必要があります。 •第三に、結果は予測に使用するのに十分安定しているべきである。 •そして最後に、私たちの分析方法は現在の市場の状況に適応するはずです。 指定された条件を満たすために、相対的な価格変動の回帰分析を使用し、このモデルに基づいて指標を作ります。この指標のアルゴリズムは履歴データからの学習に基づいており、その作業はトレーダーの完全な管理下
強力な分析方法の1つは、Levyプロセスを使用した金融シリーズのモデリングです。これらのプロセスの主な利点は、最も単純なものから最も複雑なものまで、膨大な数の現象をモデル化するために使用できることです。市場におけるフラクタルな価格変動の考えは、レヴィ過程の特別な場合にすぎないと言えば十分でしょう。一方、パラメータを適切に選択すると、どのLevyプロセスも単純な移動平均として表すことができます。図1は、フラグメントを数倍に拡大したLevyプロセスの例を示しています。 価格チャートを滑らかにするためにLevyプロセスを使用する可能性を考えてみましょう。まず、線形プロセスをシミュレートするために使用できるように、Levyプロセスのパラメータを選択する必要があります。それから、異なる符号の係数を含む重みのシステムを得ます。このおかげで、私たちは財務範囲を平準化するだけでなく、そこに存在する反トレンドと定期的な要素を追跡することもできるでしょう。 インジケータの動作は、パラメータ LF を選択することによって設定されます。分析されるストーリーの深さを決定します。このパラメーターの許容値は、0か
非常に頻繁に、トレーダーは価格が近い将来に変化する可能性がある範囲を決定するという課題に直面しています。この目的のために、ジョンソン分布タイプSBを使用することができます。この配布の主な利点は、少量の累積データでも使用できることです。この分布のパラメータを決定する際に使用される経験的アプローチにより、価格チャネルの最大レベルと最小レベルを正確に決定することができます。 これらの値はさまざまな状況で使用できます。たとえば、マーケットオーダーのストップロスやテイクプロフィットレベル、未決注文のエントリーポイントを設定するために使用できます。また、これらのレベルはトレーリングストップを使用するときに方向付けることができます。さらに、十分に大きい履歴では、インディケータは上昇トレンドまたは下降トレンドの始まりを知らせることができます。そのような傾向があったならばまあ、またはその終わりについて。 この指標の主な不利な点は、価格の排出に対する極めて高い感度と、市場の状況の変化に対する反応がやや遅いことです。 青と赤の線は、それぞれ価格チャネルの最大値と最小値を示しています。緑色の線は、特定の市場
この指標により、価格がいずれかのレベルに達する可能性を判断できます。そのアルゴリズムは非常に単純で、特定の通貨ペアの価格レベルに関する統計データの使用に基づいています。収集された履歴データのおかげで、現在のバーの間に価格が変化する範囲を決定することが可能です。 そのシンプルさにもかかわらず、この指標は取引において非常に貴重な支援を提供できます。そのため、トレーディングポジションのTakeProfitレベルとStopLossレベルを決定することができます。保留中の注文の価格の決定と、TrailingStopの価格レベルの決定の両方に役立ちます。 さらに、この指標は既存の戦略に統合できます。たとえば、ある種の日中戦略を使用します。次に、D1時間枠でこのインジケーターを設定することで、新しいトレーディングポジションを開くことは既に望ましくないことを克服した後、レベルを取得できます。 このインディケーターの主な欠点は、純粋に履歴データに依存しており、特定の現在の市場の変化にまったく反応しないことです。 このインディケーターの設定は、入力パラメーター-L1 ... L4-を選択することにより実
フィルタ:
レビューなし
レビューに返信