G Labs MagicLines MT4

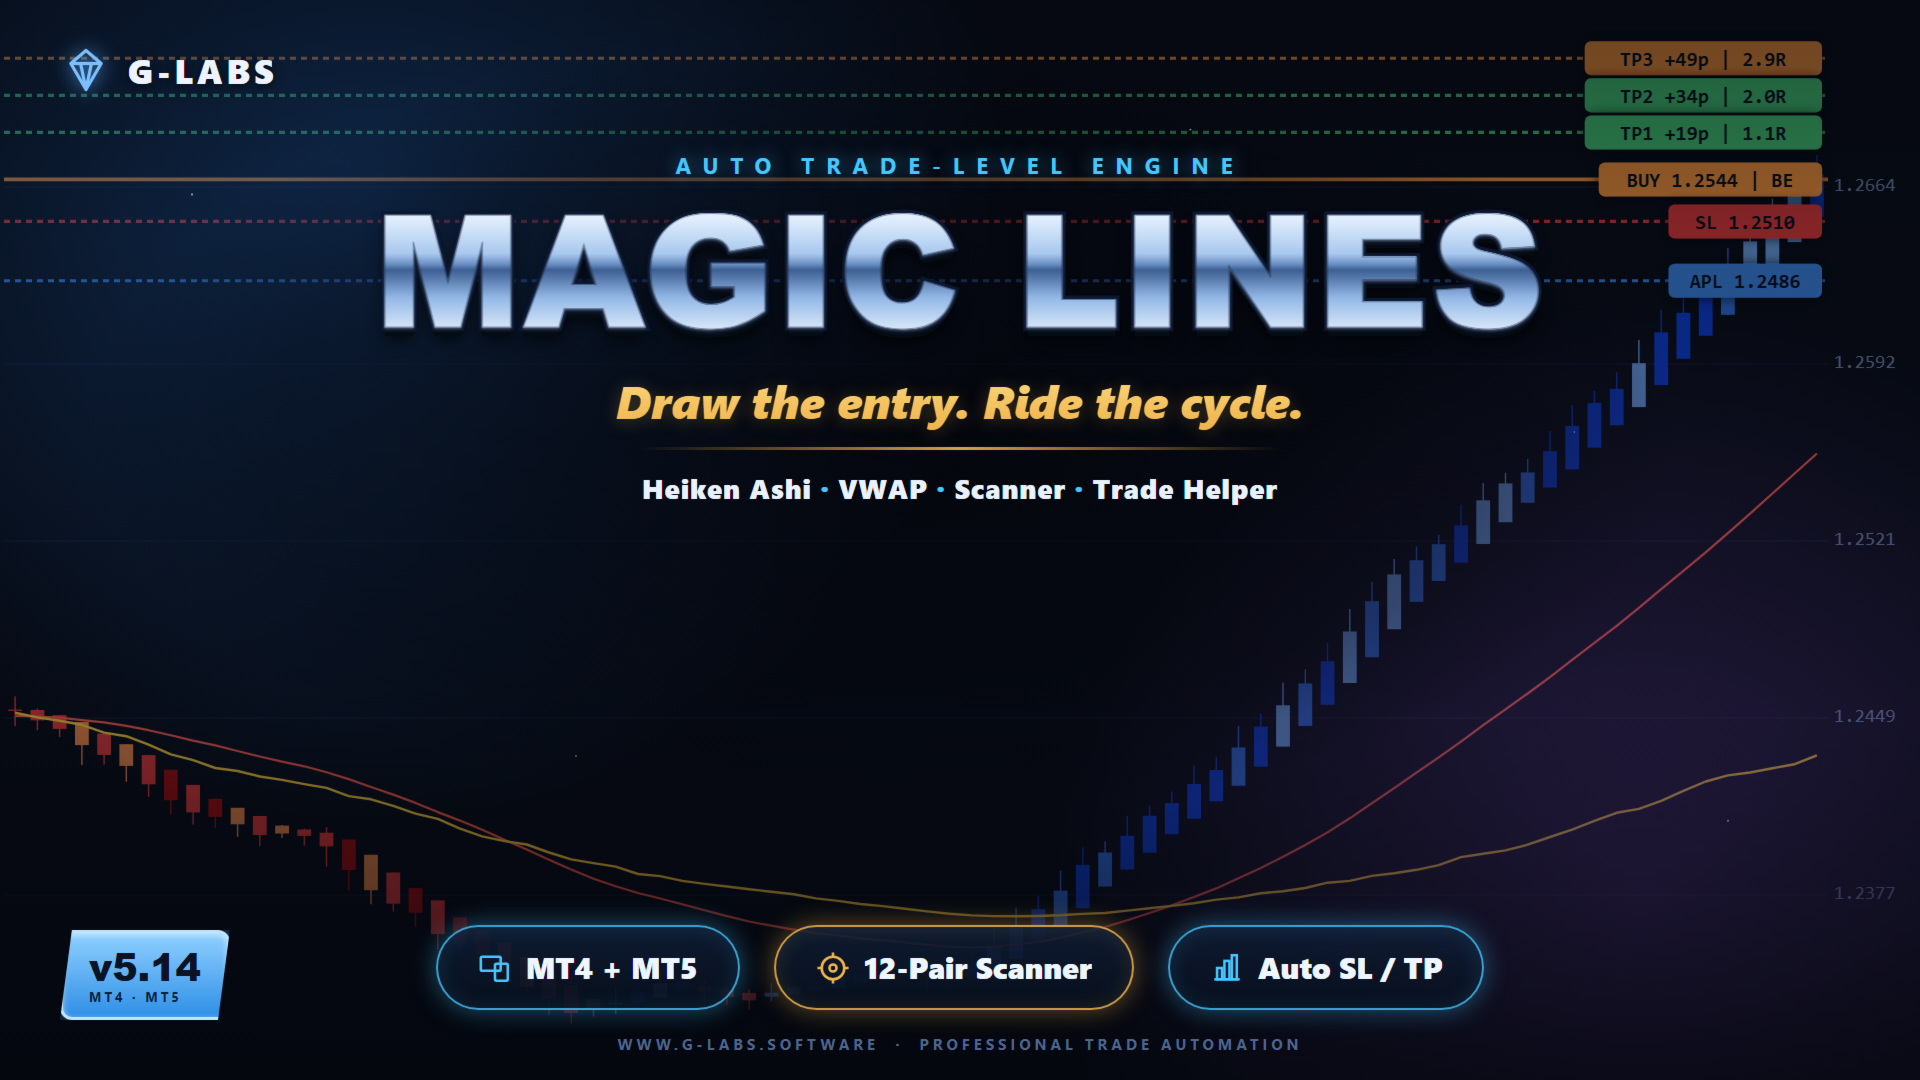
G-Labs MagicLines by G-Labs — multi-currency cycle and trend dashboard for MetaTrader 4. Heikin-Ashi cycle detection, trend-filtered MagicLine, VWAP MagicLine, multi-pair scanner, Trade Helper panel, and entry suggestions with stop loss and take profit levels from one chart.

MagicLines combines three analysis layers on each symbol. Heikin-Ashi cycle logic marks whether a pair is in an up or down cycle and records the structural anchor (swing high or low) where the cycle began. A trend-filtered MagicLine provides directional bias — signals only appear in that direction. A separate VWAP MagicLine acts as a dynamic reference for pullbacks, re-entries, and continuation trades. When all three layers align with higher-timeframe direction, the indicator can suggest entry, stop loss, and take profit levels.

What it does

Detects up and down cycles and assigns anchor points (Average Price High or Low) at the swing that started the move.

Tracks days elapsed since the anchor formed on the current timeframe, H4, and daily.

Measures distance from the anchor in average daily range multiples.

Shows whether price has touched a MagicLine and whether a re-entry opportunity is forming.

Displays today’s range in pips alongside average daily range context.

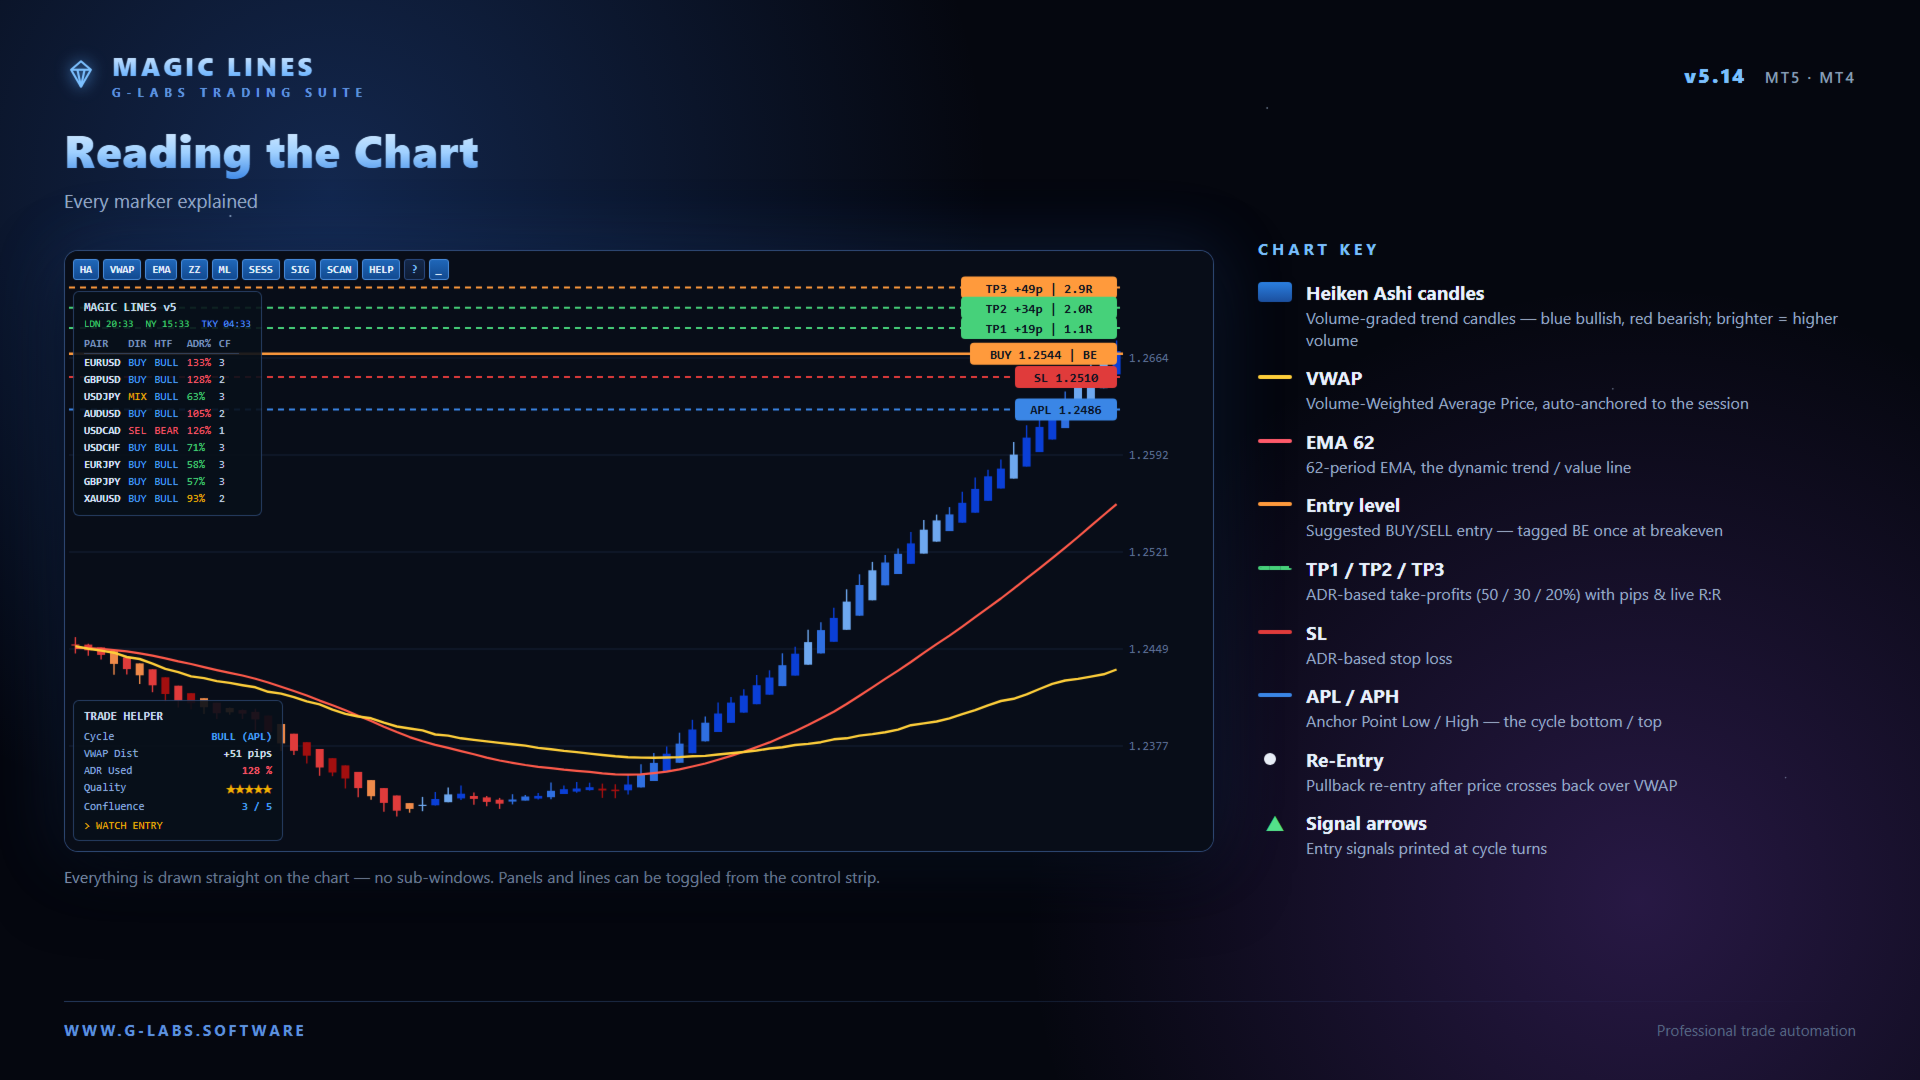
Draws entry, stop loss, re-entry, and three adjustable take profit targets (ML1, ML2, ML3) on the chart when conditions are met.

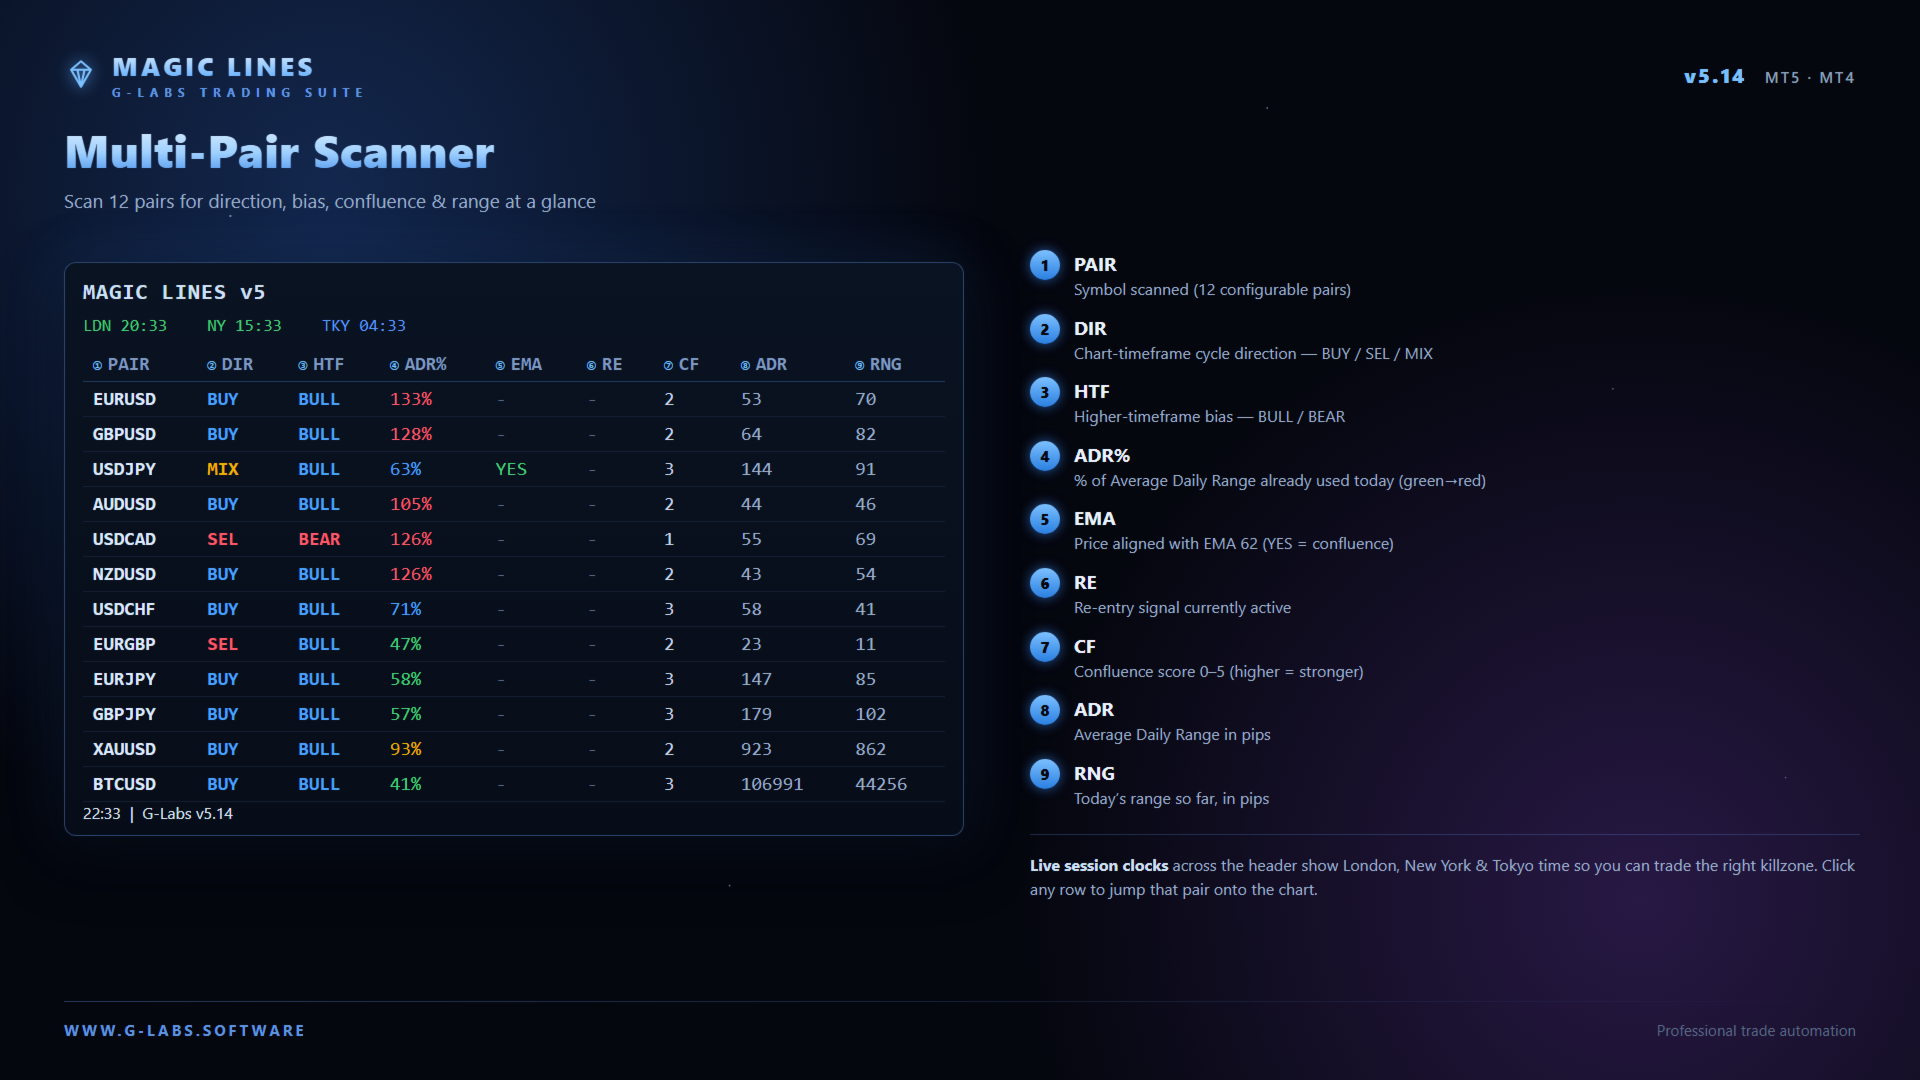
Scanner dashboard

Monitors a configurable multi-pair watchlist from one panel.

Columns include symbol, cycle direction, higher-timeframe bias, average daily range percentage, EMA touch, re-entry status, confluence score, range in pips, and today’s range.

Click a row to switch the chart to that symbol where the terminal allows.

Scanner alerts can run even when the panel is hidden.

Trade Helper

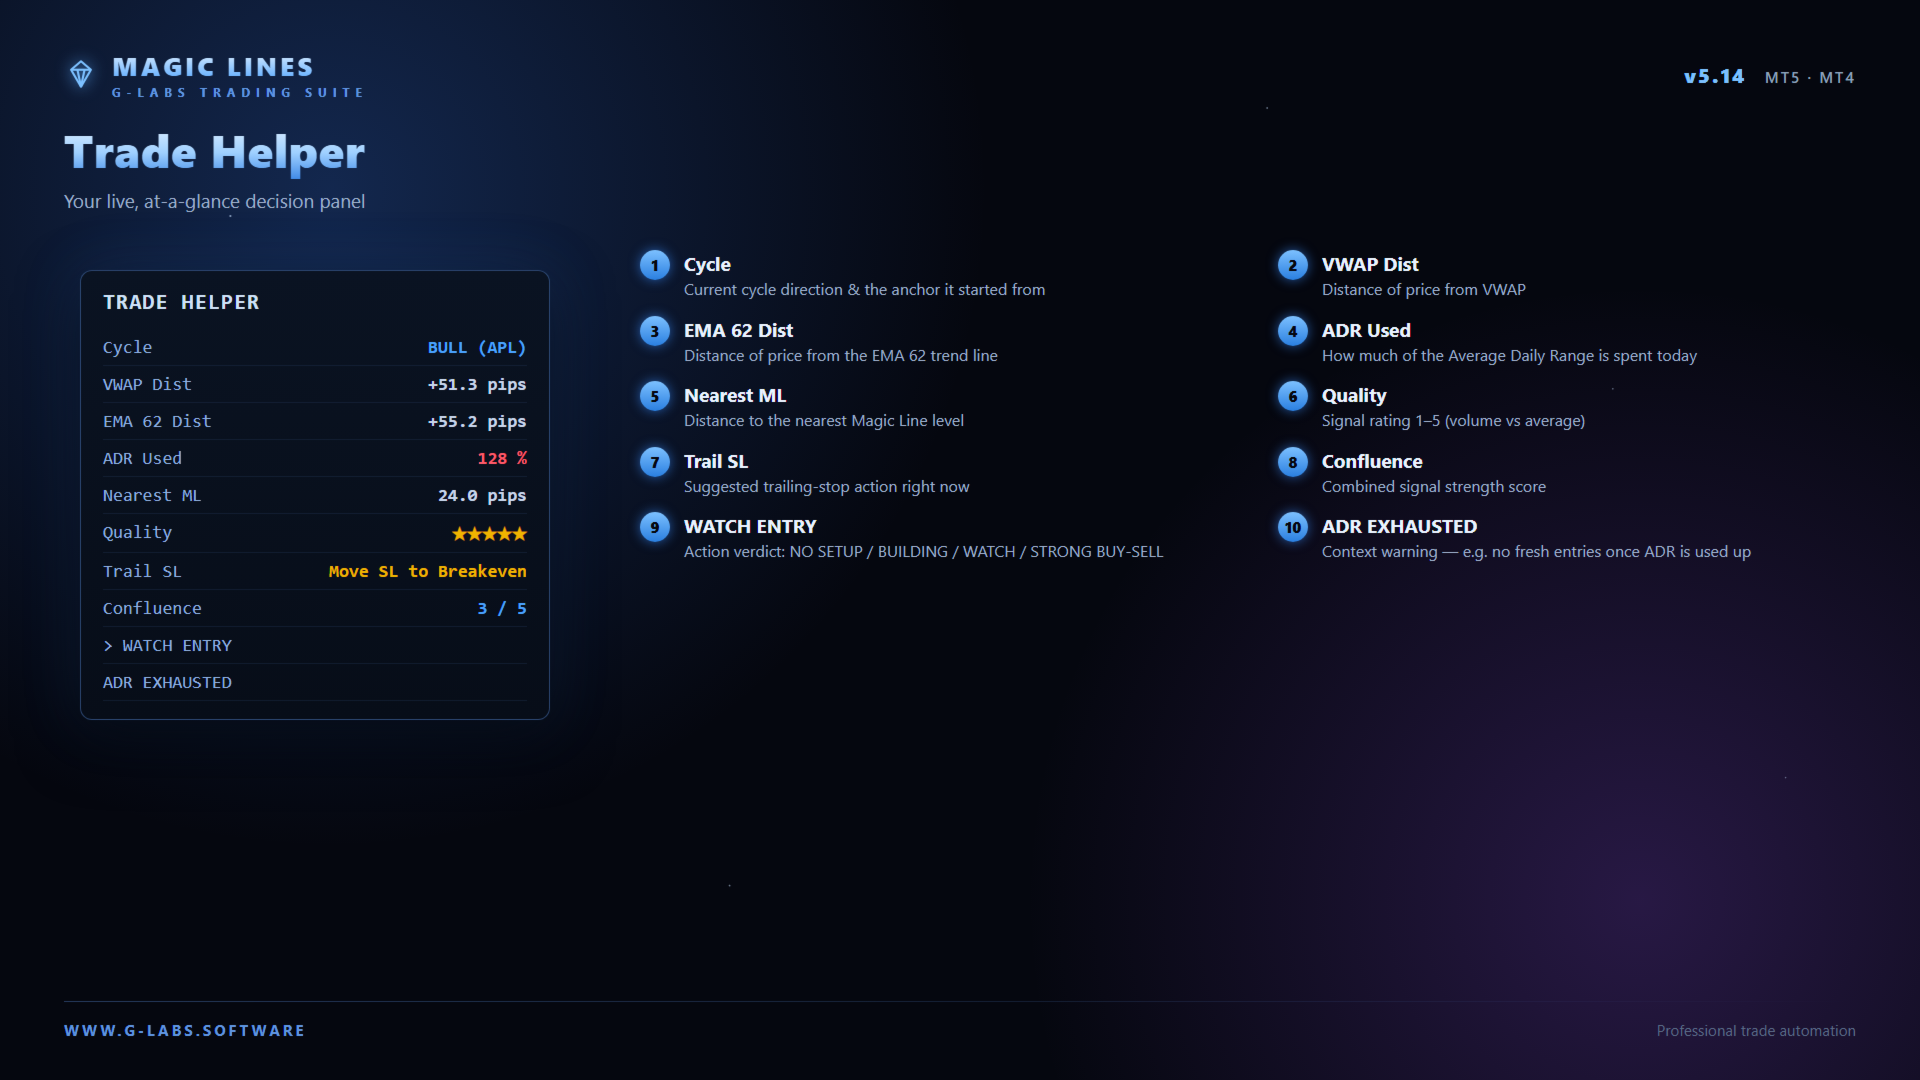
Real-time panel with cycle direction, VWAP and EMA distance, average daily range usage, confluence score, signal quality, and action guidance.

Optional legend explains abbreviations and colours.

On-chart features

Heikin-Ashi volume candles for momentum direction.

VWAP with automatic session anchoring.

EMA 62 trend filter.

ZigZag swing reference markers.

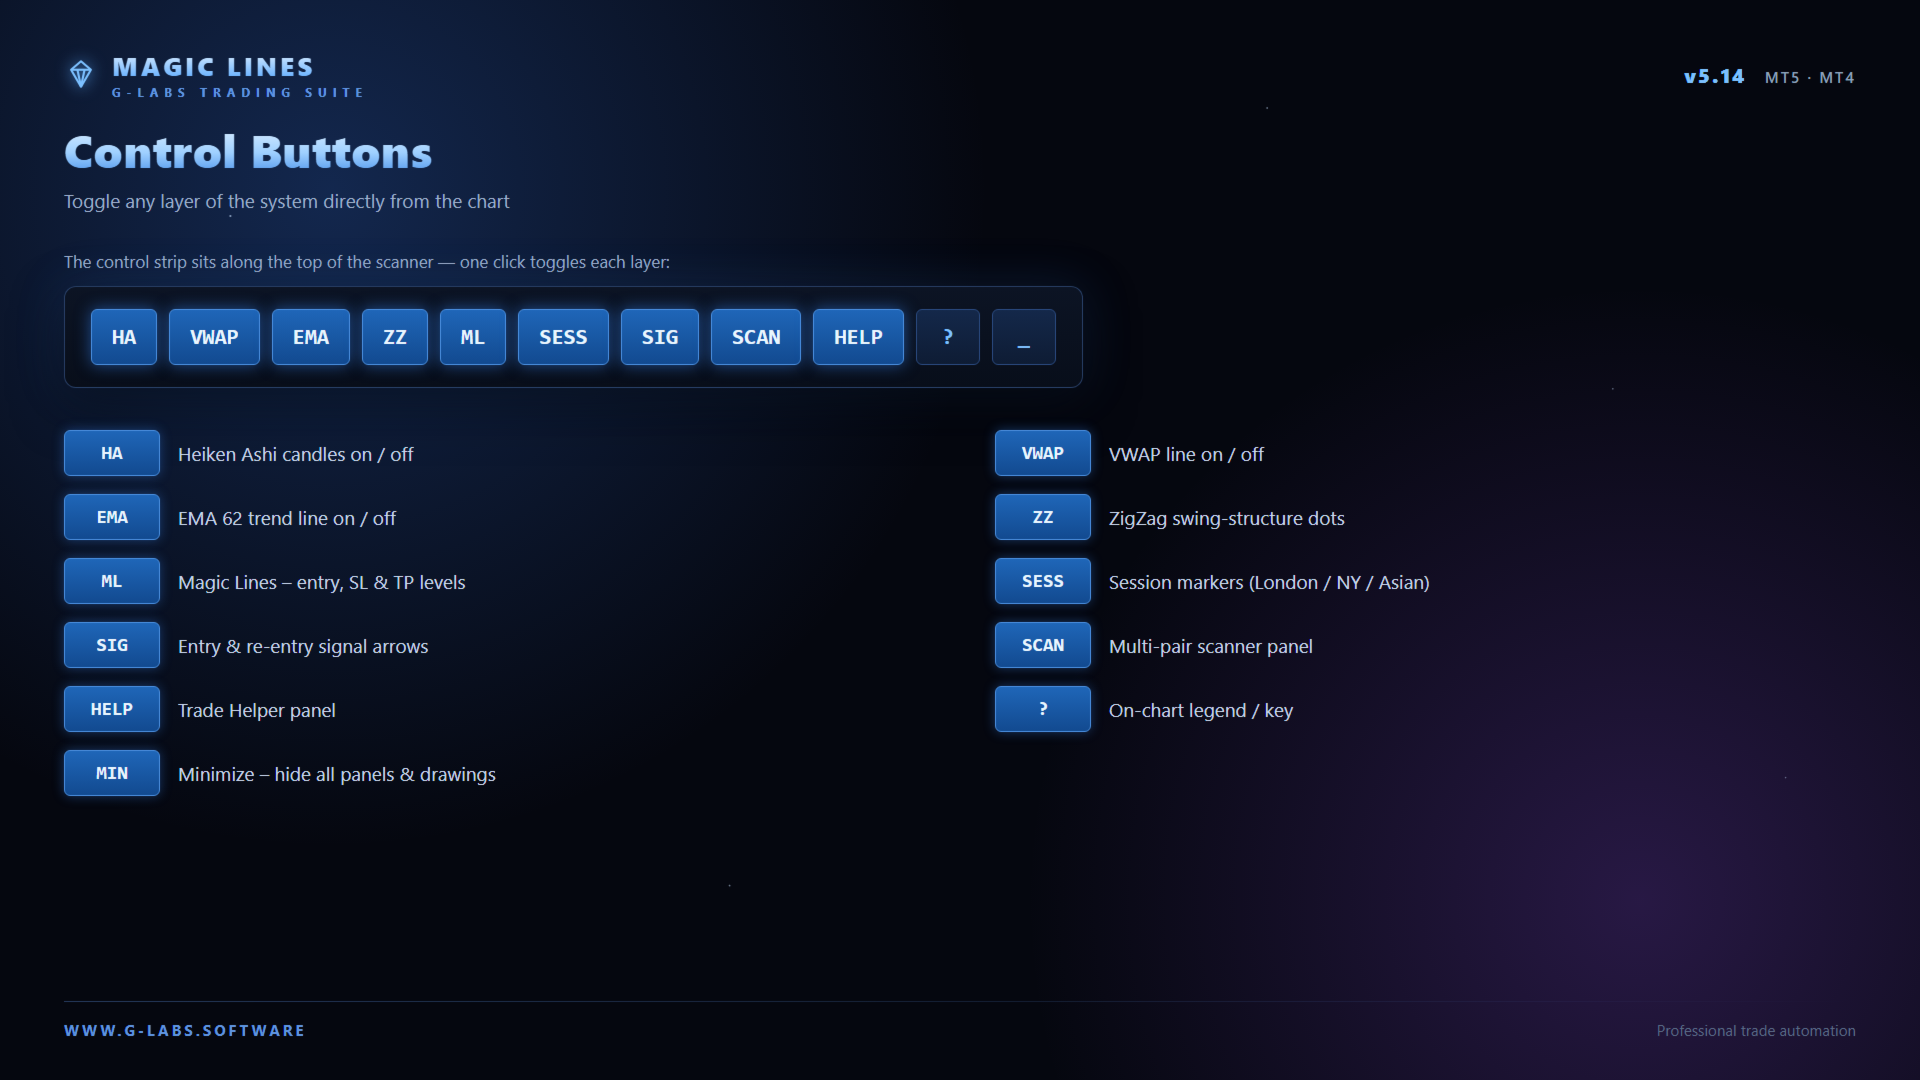
Toolbar toggles to show or hide candles, lines, signals, scanner, sessions, and helper panels.

Session markers for London, New York, and Asian sessions with configurable timezone.

Alerts

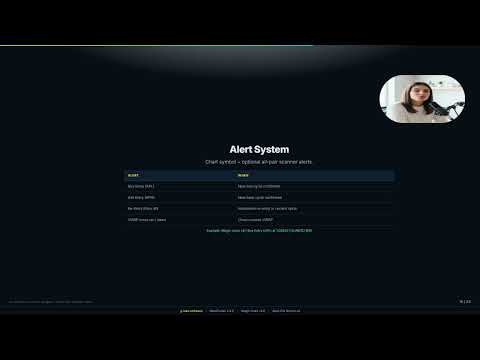
Popup and push notifications for cycle changes, entry, re-entry, VWAP cross, EMA touch, and scanner events across configured symbols.

Alert deduplication persists across chart changes and terminal restarts.

Alert types and sounds are configurable in inputs.

Quick start

Attach to any chart (M15 or H1 recommended).

Ensure scanner symbol names match your broker Market Watch list, including suffixes.

Click a dashboard row to switch pairs.

Adjust take profit targets, average daily range multipliers, and risk parameters in the indicator settings.

Requirements

MetaTrader 4 build 1350 or later.

Works on forex, metals, indices, and crypto where your broker provides data.

Analysis and signal tool only — does not place or manage trades automatically.

Past signal behaviour does not predict future results.

A MetaTrader 5 build is also available on the seller profile under G-Labs MagicLines.

G-Labs MagicLines is an analytical tool. It does not provide financial advice. Trading involves substantial risk of loss. Always use proper risk management.

Full MetaTrader 4 release with feature parity to MagicLines MT5 v5.14.


Alert deduplication persisted across chart changes, timeframe switches, and terminal restarts.


Scanner alerts remain active when the scanner panel is hidden.


Session timezone option for London, New York, and Asian markers (UK, GMT, or broker server time).


Optional hide Magic Lines after stop loss hit or after all take-profit targets are reached.


Trade Helper panel, multi-pair scanner, EA signal file output, and minimize toolbar.

Please note: MQL5 adds a demo version to all Market products by default. The demo runs on a single symbol and single timeframe on one chart. This product’s scanner reads multiple currency pairs and multiple timeframes at the same time, so the scanner and scanner-driven features are not compatible with the demo build and will not display or run. In the demo you will typically see basic chart objects only, such as EMAs and session overlays — that is expected behaviour, not a fault with the product. The full multi-pair scanner, dashboard, and all scanner logic are included in the purchased licence and are shown in the product video on the Screenshots tab. Analytical indicator only; it does not place trades for you. Past signal behaviour does not guarantee future results.

Produits recommandés
Here   our more valuable tools SMC Trend Trading   ,  Easy SMC Trading  ,  Institutional SMC Architect Volume Analysis Tools  ,  Volume flow Profile  ,  Market volume profile  , FVG with Volume  , Liquidity Heatmap Profile  ,  Volume Spread Analysis The Market Profile & Volume Profile Indicator is a powerful technical analysis tool designed to visualize market activity and price distribution over specific timeframes. Unlike standard technical indicators that focus solely on price over time, th
Market Profile Heat indicator  — is a classic Market Profile implementation that can show the price density over time, outlining the most important price levels, value area, and control value of a given trading session. This indicator can be attached to timeframes between M1 and D1 and will show the Market Profile for daily, weekly, monthly, or even intraday sessions. Lower timeframes offer higher precision. Higher timeframes are recommended for better visibility. It is also possible to use a fr
Like the logic of this tool? Explore the full ecosystem of professional indicators and utilities, built by a trader for traders: All author's products in MQL5 Market: https://www.mql5.com/en/users/musa1994/seller Trading philosophy and details: https://developer-mql4-mql5.netlify.app/ Volume Profile + CVD is a professional volume analysis indicator for MetaTrader 4 that displays volume distribution by price levels and cumulative volume delta. Full MT5-version functionality, adapted for
Demarker pullback system - is the manual trading system for choppy markets. It show 2 colored histogram.  When histogram is blue - market is quite bullish, when histogram ir orange - market is more bearish. Up arrow is plotted when histogram is in oversold zone but blue color. Down arrow is plotted when histogram is in overbought zone but orange color. These patterns shows false breakout and possible soon reverse(price is overbought but shows bearish signs and price is oversold but shows bullis
Volume Profile Sniper v11. 1-un outil Complet pour l'analyse du marché Approche professionnelle du commerce Volume Profile Sniper V11.1 combine plus de 15 filtres clés dans un seul indicateur, fournissant des signaux clairs basés sur une évaluation complète de la situation du marché. Principales caractéristiques Analyse du déséquilibre volumétrique-l'algorithme calcule la proportion d'acheteurs et de vendeurs dans chaque bougie, signalant la prédominance de l'une des parties (seuil configurabl
ZBubbles Delta
Vadim Verkhovtsev
ZBubbles Delta — Professional Volume Indicator for MT4 See volume the way institutions see it. Trade where smart money enters. ZBubbles Delta is an advanced volume analysis indicator for MetaTrader 4, combining statistical anomaly detection, ADX trend filtering, and built-in binary options statistics with Martingale tracking. Unlike standard volume histograms, ZBubbles Delta draws dynamic colored bubbles directly on price action, showing where institutional volume entered and how strong the
The "MR Volume Profile 4" indicator is a charting tool that displays trading volume at different price levels rather than time intervals. A key concept in volume profile is the point of control (POC)—the price level with the highest volume traded during the session or time range. While tools like VWAP or OBV provide volume trends, the "MR Volume Profile 4" indicator offers granular detail about where the most market activity occurs at specific price levels. This makes it a more precise tool for
L'indicateur construit les cotations actuelles, qui peuvent être comparées aux cotations historiques et, sur cette base, faire une prévision de l'évolution des prix. L'indicateur dispose d'un champ de texte pour une navigation rapide jusqu'à la date souhaitée. Option : Symbole - sélection du symbole que l'indicateur affichera ; SymbolPeriod - sélection de la période à partir de laquelle l'indicateur prendra des données ; IndicatorColor - couleur de l'indicateur ; HorisontalShift - décalage
Blahtech Market Profile
Blahtech Limited
4.53 (15)
Was: $249  Now: $99   Market Profile defines a number of day types that can help the trader to determine market behaviour. A key feature is the Value Area, representing the range of price action where 70% of trading took place. Understanding the Value Area can give traders valuable insight into market direction and establish the higher odds trade. It is an excellent addition to any system you may be using. Blahtech Limited presents their Market Profile indicator for the MetaTrader community. Ins
Blahtech Supply Demand
Blahtech Limited
4.58 (36)
Was: $299  Now: $99   Supply Demand uses previous price action to identify potential imbalances between buyers and sellers. The key is to identify the better odds zones, not just the untouched ones. Blahtech Supply Demand indicator delivers functionality previously unavailable on any trading platform. This 4-in-1 indicator not only highlights the higher probability zones using a multi-criteria strength engine, but also combines it with multi-timeframe trend analysis, previously confirmed swings
Un indicateur technique qui calcule ses lectures sur les volumes de transactions. Sous forme d'histogramme, il montre l'accumulation de la force de mouvement de l'instrument de trading. Il dispose de systèmes de calcul indépendants pour les directions haussières et baissières. Fonctionne sur tous les instruments de trading et délais. Peut compléter n’importe quel système commercial. L'indicateur ne redessine pas ses valeurs, les signaux apparaissent sur la bougie actuelle. Il est facile à utilis
Volume indicator Effect Volume , in the Forex market volumes are unique (tick). This volume indicator demonstrates the level of financial and emotional involvement. When the indicator forms a new top, it indicates that buyers are stronger than sellers over a certain period of time. If the indicator decreases, this indicates that the bears are stronger. Why is it impossible to track normal volumes in Forex? The fact is that this is an over-the-counter market. Consequently, it is practically imp
VTB High Watermark Drawdown Lock EA for MT4 Advanced Equity Protection & Drawdown Management System VTB High Watermark Drawdown Lock is a professional risk management Expert Advisor designed to protect trading accounts, funded accounts, and proprietary trading challenges from excessive drawdown. Unlike traditional drawdown protection systems that calculate risk from the initial account balance, this EA uses a dynamic High Watermark (HWM) model that continuously protects both your original capita
IX Power MT4
Daniel Stein
4.82 (11)
IX Power : Découvrez des insights de marché pour les indices, matières premières, cryptomonnaies et forex Vue d’ensemble IX Power est un outil polyvalent conçu pour analyser la force des indices, matières premières, cryptomonnaies et symboles forex. Tandis que FX Power offre une précision maximale pour les paires de devises en utilisant toutes les données disponibles, IX Power se concentre exclusivement sur les données du symbole sous-jacent. Cela fait de IX Power un excellent choix pour les m
TPO Profile MT4
Kyra Nickaline Watson-gordon
5 (1)
Definition : TPO is a Time Price Opportunity. Instead of using bars or candles with an Open, High, Low, and Close price, each "bar" in a Market Profile is represented by horizontal bars against the price It is called Market Profile terminology. In other words time-price-opportunity (TPO) profiles are histograms of how much time was spent at each price within the span of the profile. By using a TPO chart, you are able to analyze the amount of trading activity, based on time, for each price level
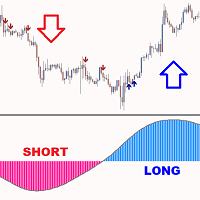
Gold Trend   - il s'agit d'un bon indicateur technique boursier. L'algorithme de l'indicateur analyse le mouvement du prix d'un actif et reflète la volatilité et les zones d'entrée potentielles. Les meilleurs signaux de l'indicateur: - Pour la VENTE = histogramme rouge + pointeur SHORT rouge + flèche de signalisation jaune dans la même direction + flèche rouge indiquant la direction de la tendance. - Pour l'ACHETER = histogramme bleu + pointeur LONG bleu + flèche de signalisation aqua dans l
Cet indicateur est basé sur la transformée de Hartley discrète. L'utilisation de cette transformation vous permet d'appliquer différentes approches lors du traitement des séries chronologiques financières. Une caractéristique distinctive de cet indicateur est que ses lectures ne se réfèrent pas à un point sur le graphique, mais à tous les points de la période de l'indicateur. Lors du traitement d'une série temporelle, l'indicateur permet de sélectionner différents éléments de la série temporell
BoxChart MT4
Evgeny Shevtsov
4.4 (5)
The market is unfair if only because 10% of participants manage 90% of funds. An ordinary trader has slim changes to stand against these "vultures". This problem can be solved. You just need to be among these 10%, learn to predict their intentions and move with them. Volume is the only preemptive factor that faultlessly works on any timeframe and symbol. First, the volume appears and is accumulated, and only then the price moves. The price moves from one volume to another. Areas of volume accumu
Trend Scan Friend
Israr Hussain Shah
Here   our more valuable tools SMC Trend Trading   ,  Easy SMC Trading  ,  Institutional SMC Architect Volume Analysis Tools  ,  Volume flow Profile  ,  Market volume profile  , FVG with Volume  , Liquidity Heatmap Profile  ,  Volume Spread Analysis Trend Identification: Look for the color change. When candles turn Green , look for Buy opportunities. When they turn Red , look for Sell opportunities. Entry: Enter on the break of the trend line or on the pullback to the line. Stop Loss: Use the
The Supply and Demand Zone Indicator is a powerful and easy-to-use tool designed to help traders identify critical supply and demand zones on the chart. These zones can provide valuable insight into potential market reversals, breakouts, and important price levels where buyers or sellers are likely to take control. The best   FREE Trade Manager . If you want to create your own Hedging or Grid strategies without any coding make sure to check out the   ManHedger Key Features: Automatic Zone Detect
FREE
Currency Strength 28Pairs
Nantakan Leungonnam
5 (1)
Calculate 28 pairs buy and sell volume real-time. This Indicator is good for all trader. It will increase the accuracy and decision making of placing orders. It shows the strength and weakness of every currency. It's a great help to you. CurrencyStrength28pairs - The indicator calculates the price and the buy and sell volume of every currency pair. Show you the results on the board in real time. and averaged all currency pairs to show the strength of the current currency. Features Result on the
Trend Zones
Augustine Kamatu
Introducing Trend Zones: Your Ultimate Tool for Precise Market Entry and Exit Points. Trend Zones is a revolutionary MetaTrader 4 indicator designed to provide traders with clear buy and sell zones based on trend reversals and price action. Built upon advanced algorithms and non-repainting technology, this indicator offers unparalleled accuracy in identifying optimal entry and exit points in the forex market. Key Features: 1. Non-Repainting Signals: Trend Zones delivers non-repainting signals,
Volume Profil MT4
Vincent Jose Proenca
Volume Profile Rectangle Résumé Indicateur interactif de profil de volume qui affiche la répartition horizontale du volume échangé à chaque niveau de prix dans une zone sélectionnée. Il crée automatiquement un rectangle déplaçable et affiche des barres colorées représentant le volume haussier et baissier. Fonctionnalités : Affiche le volume horizontal : Visualise la répartition du volume à chaque niveau de prix sous forme de barres horizontales Analyse haussière/baissière : Colore les barres en
Titan Z-Score Pro v3.2 Sürüm Notları: Kurumsal UI/UX Yeniden Tasarımı: Performans kokpitleri ve MTF matrisleri ana harita köşelerine taşındı, böylece tertemiz, dağınıklıktan arındırılmış bir alt pencere görünümü sağlandı. Canlı Kazanma Oranı ve Geri Dönüş Kokpiti: Ortalama geri dönüş başarı oranının ve kazanılan ortalama piplerin gerçek zamanlı takibi eklendi. Çok Zaman Dilimi Z-Puan Matrisi: Ana tabloya doğrudan görsel olarak 5 zaman dilimli (M5'ten D1'e) bir durum ızgarası entegre edildi. Yeni
Program Overview: This program is a trading tool designed to monitor and analyze the 7 major currency pairs. It is a variant of a similar program used for tracking stock indices, but this version focuses on the seven major currency pairs. The program helps in identifying and calculating significant price movements (gaps) between the high and low prices of these currency pairs over a specified time frame. It then provides insights through comments and alerts based on the calculated gaps. Major Cu
TITAN AI Volume Profile PRO MT4 is an advanced technical indicator designed for professional market analysis, volume profile distribution, and graphical data visualization in MetaTrader 4. Key Features: - Dynamic Volume Profile calculation based on price action and tick volume. - Automatic High Value Area (VAH), Low Value Area (VAL), and Point of Control (POC) detection. - High Volume Nodes (HVN) and Low Volume Nodes (LVN) highlighting. - Integrated Economic Calendar with news alerts. - Built-
Money Flow Profile MT5 HERE   Here   our more valuable tools SMC Trend Trading   ,  Easy SMC Trading  ,  Institutional SMC Architect Volume Analysis Tools  ,  Volume flow Profile  ,  Market volume profile  , FVG with Volume  , Liquidity Heatmap Profile  ,  Volume Spread Analysis This Master Edition is engineered for clarity and speed, featuring a unique Auto-Theme Sync system that instantly beautifies your chart layout upon loading. Key Features: True Money Flow Calculation: Goes beyond stand
MA Cross 448 Scanner Scan 64 pairs x 7 timeframes for MA crossovers — all from a single chart.  |  User Manual ------------------------------------------------------------------------ 1. Overview ------------------------------------------------------------------------ MA Cross 448 Scanner is a MetaTrader 4 indicator that monitors moving average crossovers across 64 currency pairs and 7 timeframes simultaneously, displaying all results in a single panel. Drop it onto any chart and it instantly
Knowledge of the strength and weakness of each currency is vital for every forex trader. Our   Currency Strength Meter indicator   measures the strength of eight major currencies (USD, EUR, GBP, CHF, JPY, CAD, AUD, NZD) by using the Relative Strength Index indicator, also known as RSI. The Currency Strength Meter indicator shows you, simply and quickly, when a currency is oversold, overbought, or in "normal area". This way, you can identify which currency is the strongest and the weakest. Our
VolumeProfile
Robert Hess
3.8 (5)
Descption: The Volume Profile displays detailed informations of historical trading activities at certain price levels (Market Profile). So you can locate the areas with the best prices in the market and get an advantage about other market participants. Features: Customizable Volume Profile / Market Profile Shows the "fair" Value Area with 70% of all Volume Shows critical low volume zones Shows VPOC, VAL and VAH Points Works on all timeframes Also available for MT5 ( https://www.mql5.com/en/mark
Les acheteurs de ce produit ont également acheté
Scalper Vault
Oleg Rodin
5 (40)
Scalper Vault est un système de trading puissant et complet, conçu pour les traders en quête de régularité dans le cadre du trading intrajournalier. Cet indicateur de haute précision constitue un système de trading autonome et exhaustif, offrant des analyses de qualité institutionnelle, aussi bien pour le Forex que pour les options binaires. VEUILLEZ ME CONTACTER APRÈS VOTRE ACHAT POUR OBTENIR MES CONSEILS DE TRADING AINSI QU'UN EXCELLENT BONUS ! En éliminant les incertitudes et les analyses ma
Currency Strength Wizard est un indicateur très puissant qui vous offre une solution tout-en-un pour un trading réussi. L'indicateur calcule la puissance de telle ou telle paire de devises en utilisant les données de toutes les devises sur plusieurs périodes. Ces données sont représentées sous la forme d'un indice de devise facile à utiliser et de lignes électriques de devise que vous pouvez utiliser pour voir la puissance de telle ou telle devise. Tout ce dont vous avez besoin est d'attacher l'
Le système PRO Renko est un système de trading très précis spécialement conçu pour le trading de graphiques RENKO. Il s'agit d'un système universel qui peut être appliqué à divers instruments de négociation. Le système neutralise efficacement ce qu'on appelle le bruit du marché en vous donnant accès à des signaux d'inversion précis. L'indicateur est très facile à utiliser et n'a qu'un seul paramètre responsable de la génération du signal. Vous pouvez facilement adapter l'outil à n'importe que
SR Liquidity
Oleg Rodin
5 (2)
SR Liquidity est un indicateur de trading conçu pour révéler les zones cachées où se concentre la liquidité du marché et où le prix réagit avec le plus d'intensité. Ces zones de liquidité spécifiques agissent comme de puissants niveaux de support et de résistance, vous offrant une cartographie claire des points où le marché est le plus susceptible de se retourner. Plutôt que de tracer des lignes de support et de résistance classiques, l'indicateur SR Liquidity analyse le comportement réel des pr
M1 Sniper
Oleg Rodin
4.97 (30)
M1 SNIPER est un système d'indicateurs de trading facile à utiliser. Il s'agit d'un indicateur à flèche conçu pour l'unité de temps M1. Cet indicateur peut être utilisé seul pour le scalping sur l'unité de temps M1 ou intégré à votre système de trading existant. Bien que conçu spécifiquement pour le trading sur l'unité de temps M1, ce système peut également être utilisé avec d'autres unités de temps. Initialement, j'avais conçu cette méthode pour le trading du XAUUSD et du BTCUSD. Cependant, je
Quant Direction
Georgios Kalomoiropoulos
Quant Direction est un outil d'analyse de marché 3D. Il fournit une analyse de marché parfaitement objective, basée sur un algorithme, en calculant des écarts précis en pourcentage sur différents paramètres. Développé à l'aide d'outils de modélisation avancés basés sur l'IA et soumis à des tests rigoureux, cet algorithme analyse le marché avec une précision inégalée. Vous pouvez analyser n'importe quelle paire de devises ou instrument financier sur la plateforme. Que vous pratiquiez le trading à
Trend Lines PRO
Roman Podpora
5 (2)
TREND LINES PRO     Cet indicateur permet de comprendre les véritables changements de direction du marché. Il révèle les renversements de tendance et les points de retour des principaux acteurs. Tu vois     Lignes BOS     Détection des changements de tendance et des niveaux clés sur des unités de temps supérieures, sans paramètres complexes ni interférences inutiles. Les signaux restent affichés sur le graphique même après la fermeture de la bougie. VERSION MT 5    -     Révèle son potentiel max
Hidden Cycles
Lev Vladimirovic Marushkin
5 (1)
The Only 100% Universal Tool! Stop trading against nature! This is your chance to secure the only indicator rooted in the absolute laws that govern the entire universe. Most tools guess—this one reveals the truth. Buy another toy or buy the truth. Your choice... Based on Universal Laws — NOT Some Guy’s Algorithm: Let the market adjust to the Hidden Cycles Geometry — not the other way around. Most indicators are based on a man-made formula. They often lag, fail over time, or need constant re-o
Neo Wave PRO
Nikolay Raykov
5 (1)
Price & Time Market Structure Indicator A professional market structure tool that analyzes waves through both price and time — not price alone. Main Description NeoWave PRO is a professional market structure indicator for MetaTrader 4 designed for traders who want to move beyond traditional one-dimensional wave tools such as ZigZag, swing indicators, and basic high/low systems. Most wave indicators analyze only one thing: Price. But a real market wave is not only a price movement. A true wave de
CRT Multi-Timeframe Market Structure & Liquidity Sweep Indicator Non-Repainting | Multi-Asset | MT5 Version Available MT5 Version:   https://www.mql5.com/en/market/product/162075 Full User Guide — explains what each feature does and why:   https://www.mql5.com/en/blogs/post/767525 Quick Start User Guide  — explains how to configure and in what order:  https://www.mql5.com/en/blogs/post/767540 Indicator Overview CRT Ghost Candle HTF Fractal is a complete institutional-grade market structure too
Neuro Poseidon MT4
Daria Rezueva
4.74 (46)
Neuro Poseidon is a new indicator by Daria Rezueva. It combines precise trading signals with adaptive TP/SL levels - creating best possible trades as a result! Message me and get  Neuro Poseidon Assistant  as a gift to automize your trading process! What makes it stand out? 1. Proven profitability on all assets and timeframes 2. Only confirmed BUY and SELL signals present on the chart 3. Adaptive TP & SL levels generated by the software for each trade 4. Easy to understand - suitable for all
Super Signal – Skyblade Edition Système de signaux de tendance professionnel sans repaint / sans latence, avec un taux de réussite exceptionnel | Pour MT4 / MT5 Il fonctionne mieux sur des unités de temps inférieures, comme 1 minute, 5 minutes et 15 minutes. Caractéristiques principales : Super Signal – Skyblade Edition est un système de signaux intelligent conçu spécifiquement pour le trading de tendance. Il utilise une logique de filtrage multicouche pour détecter uniquement les mouvements d
Gann Made Easy
Oleg Rodin
4.84 (174)
Gann Made Easy est un système de trading Forex professionnel et facile à utiliser qui est basé sur les meilleurs principes de trading en utilisant la théorie de mr. WD Gann. L'indicateur fournit des signaux d'ACHAT et de VENTE précis, y compris les niveaux Stop Loss et Take Profit. Vous pouvez échanger même en déplacement en utilisant les notifications PUSH. VEUILLEZ ME CONTACTER APRÈS L'ACHAT POUR RECEVOIR GRATUITEMENT DES INSTRUCTIONS DE TRADING ET D'EXCELLENTS INDICATEURS SUPPLÉMENTAIRES! Vou
Signal GoldRush Trend Arrow L'indicateur GoldRush Trend Arrow Signal fournit une analyse précise et en temps réel des tendances, spécialement conçue pour les scalpers à haute vitesse et à court terme sur la paire XAU/USD. Conçu spécialement pour les intervalles de temps d'une minute, cet outil affiche des flèches directionnelles indiquant clairement les points d'entrée, ce qui permet aux scalpers de naviguer en toute confiance dans des conditions de marché volatiles. L'indicateur se compose
Actuellement 30% de réduction ! La meilleure solution pour tout débutant ou trader expert ! Ce logiciel de tableau de bord fonctionne sur 28 paires de devises. Il est basé sur 2 de nos principaux indicateurs (Advanced Currency Strength 28 et Advanced Currency Impulse). Il donne un excellent aperçu de l'ensemble du marché Forex. Il montre les valeurs de l'Advanced Currency Strength, la vitesse de mouvement des devises et les signaux pour 28 paires de devises dans tous les (9) délais. Imaginez
Currency Strength Exotics
Bernhard Schweigert
4.88 (33)
ACTUELLEMENT 20% DE RÉDUCTION ! La meilleure solution pour tout débutant ou trader expert ! Cet indicateur est spécialisé pour montrer la force de la devise pour tous les symboles comme les paires exotiques, les matières premières, les indices ou les contrats à terme. C'est le premier de son genre, n'importe quel symbole peut être ajouté à la 9ème ligne pour montrer la force réelle de la devise de l'or, l'argent, le pétrole, DAX, US30, MXN, TRY, CNH etc. Il s'agit d'un outil de trading unique
Scalper Inside PRO
Alexey Minkov
4.74 (69)
Scalper Inside PRO helps you read the intraday trend and plan a trade before you enter the market. It is built around three exclusive strategies for a sharper read of the market. The moment a signal appears, the indicator evaluates market direction and calculates the key levels, so you see the potential entry, the expected stop-loss and several profit-taking levels in advance. Detailed performance statistics show how different instruments and strategies performed in history and help you pick ass
Cycle Sniper
Elmira Memish
4.39 (36)
Please contact us after your purchase and we will send you the complimentary indicators to complete the system Cycle Sniper is not a holy grail but when you use it in a system which is explained in the videos, you will feel the difference. If you are not willing to focus on the charts designed with Cycle Sniper and other free tools we provide, we recommend not buying this indicator. We recommend watching the videos about the indiactor and system before purchasing. Videos, settings  and descri
Elliott Wave Trend was designed for the scientific wave counting. This tool focuses to get rid of the vagueness of the classic Elliott Wave Counting using the guideline from the template and pattern approach. In doing so, firstly Elliott Wave Trend offers the template for your wave counting. Secondly, it offers Wave Structural Score to assist to identify accurate wave formation. It offers both impulse wave Structural Score and corrective wave Structure Score. Structural Score is the rating to sh
PZ Harmonacci Patterns
PZ TRADING SLU
3.17 (6)
Trade smarter, not harder: Empower your trading with Harmonacci Patterns This is arguably the most complete harmonic price formation auto-recognition indicator you can find for the MetaTrader Platform. It detects 19 different patterns, takes fibonacci projections as seriously as you do, displays the Potential Reversal Zone (PRZ) and finds suitable stop-loss and take-profit levels. [ Installation Guide | Update Guide | Troubleshooting | FAQ | All Products  ] It detects 19 different harmonic pric
Supply and Demand Dashboard PRO
Bernhard Schweigert
4.81 (21)
Actuellement 30% de réduction ! Ce tableau de bord est un logiciel très puissant qui fonctionne sur plusieurs symboles et jusqu'à 9 horizons temporels. Il est basé sur notre indicateur principal (Best reviews : Advanced Supply Demand ).   Le tableau de bord donne une excellente vue d'ensemble. Il montre :  Les valeurs d'offre et de demande filtrées, y compris l'évaluation de la force de la zone, Les distances en pips vers/et dans les zones, Il met en évidence les zones imbriquées, Il donne 4
Miraculous Indicator Binary & Forex v3 StrategySafe Miraculous Indicator Binary & Forex v3 StrategySafe est un indicateur professionnel conçu pour les traders qui recherchent des signaux clairs, des outils de confirmation puissants et une méthode structurée pour trader les marchés Binary et Forex. La version v3 intègre le MIR Dashboard, le Miraculous Confirmation Dashboard, la GANN Law, les niveaux Square of 9, les angles GANN et un mode Forex plus avancé pour une analyse plus complète. Fonction
Cycles Predictor Indicator This indicator uses past market cycles to predict future price movements. The indicator scans through past data and considers  combinations  of cycles. When cycles  coincide  at the same future date/time then it is considered a valid future prediction. The predictions are drawn as vertical lines on the right side of the chart in the future. A prediction will often result in type of candle (ex. bull or bear) and/or a reversal point (ex. bottom or top) forming at this ex
"The Squeeze indicator attempts to identify periods of consolidation in a market. In general the market is either in a period of quiet consolidation or vertical price discovery. By identifying these calm periods, we have a better opportunity of getting into trades with the potential for larger moves. Once a market enters into a "squeeze," we watch the overall market momentum to help forecast the market direction and await a release of market energy." Modified TTM Squeeze Indicator is a modifica
ForexTrendMT4
Andriy Sydoruk
5 (1)
ForexTrendMT4 Indicator: A Reliable Tool for Market Tracking The ForexTrendMT4 indicator offers reliable market trend tracking, filtering out sudden fluctuations and market noise. This tool helps identify trends and signals favorable entry points into the market using arrows. It is suitable for both scalping on shorter timeframes and long-term trading strategies. Based on the principles of technical analysis, ForexTrendMT4 takes into account the cyclical nature of the market. Key Features and A
KURAMA GOLD SIGNAL PRO (MT4) — Filtre à 7 couches · TP/SL automatique · Score de qualité · Sauvegarde de l'historique des signaux | Système de trading complet pour le XAUUSD Vous souhaitez des ordres automatiques ? Une édition EA MT5 existe aussi Gold Signal Pro EA with Auto TP SL est un EA MT5 vendu séparément : moteur Gold Signal Pro intégré, sélection, ordres automatiques, TP/SL et réglages de risque pour GOLD M5/M15. Choisissez examen des signaux ou exécution automatique. Autonome, non inclu
All in One package includes the  Oscillator Predictor ,  MACD Predictor ,  Thrust Scanner  and  Advanced Fibonacci  indicators which are mandatory for applying  Dinapoli  trade plans.  Please visit below links for detailed explanations of indicators. Advanced Fibonacci Indicator =>  https://www.mql5.com/en/market/product/52834 Thrust Scanner Indicator => https://www.mql5.com/en/market/product/52830 Overbought /Oversold Predictor indicator => https://www.mql5.com/en/market/product/52621 Macd P
BTMM State Engine Pro by G-Labs — Beat The Market Maker indicator for MetaTrader 4. Asian session range, London and New York kill zones, level progression (L1/L2/L3), peak formation detection (PFH/PFL), entry signals, and a multi-pair scanner from one chart. Stop scanning charts one pair at a time. The State Engine tracks the BTMM daily cycle automatically — Asian box, room boundaries, level blocks, peak formations, and filtered entries — while the scanner dashboard shows level, peak status,
Quantum Trend Sniper MT4
Ian Andrew Nicholson
5 (1)
Quantum Trend Sniper PRO for MetaTrader 4 Quantum Trend Sniper PRO is a professional-grade MT4 indicator built for traders who want selective entries, clear trade structure, and live on-chart decision support . This is not a basic buy/sell arrow tool. It is a complete trading workflow that helps you identify higher-quality setups, project the full trade structure, monitor progression through multiple profit targets, and review trade behavior directly on the chart. Designed for traders who value
Quantum Breakout Indicator PRO
Bogdan Ion Puscasu
4.96 (26)
Présentation       Quantum Breakout PRO   , l'indicateur révolutionnaire MQL5 qui transforme la façon dont vous négociez les zones d'évasion ! Développé par une équipe de traders expérimentés avec une expérience de trading de plus de 13 ans,   Quantum Breakout PRO   est conçu pour propulser votre parcours de trading vers de nouveaux sommets grâce à sa stratégie de zone de discussion innovante et dynamique. Quantum Breakout Indicator vous donnera des flèches de signalisation sur les zones d'év
Plus de l'auteur
Btmm state engine pro
Garry James Goodchild
5 (4)
BTMM State Engine Pro by G-Labs — Beat The Market Maker indicator for MetaTrader 5. Asian session range, London and New York kill zones, level progression (L1/L2/L3), peak formation detection (PFH/PFL), entry signals, and a multi-pair scanner from one chart. Stop scanning charts one pair at a time. The State Engine tracks the BTMM daily cycle automatically — Asian box, room boundaries, level blocks, peak formations, and filtered entries — while the scanner dashboard shows level, peak status, d

BTMM State Engine Pro by G-Labs — Beat The Market Maker indicator for MetaTrader 4. Asian session range, London and New York kill zones, level progression (L1/L2/L3), peak formation detection (PFH/PFL), entry signals, and a multi-pair scanner from one chart. Stop scanning charts one pair at a time. The State Engine tracks the BTMM daily cycle automatically — Asian box, room boundaries, level blocks, peak formations, and filtered entries — while the scanner dashboard shows level, peak status,
Smart Market Structure Toolkit
Garry James Goodchild
5 (1)
Smart Market Structure Pro by G-Labs — ICT and Smart Money Concepts toolkit with built-in multi-symbol scanner for MetaTrader 5. Break of structure, change of character, order blocks, fair value gaps, liquidity sweeps, premium and discount zones, ICT sessions, confluence scoring, AI trade ideas, and a traffic-light scanner across up to 30 pairs and four timeframes from one chart. Map SMC and ICT on the active chart while the built-in scanner monitors your full watchlist. Each cell shows BUY, S
Connix MT5
Garry James Goodchild
5 (1)
Connix SMC Scanner by G-Labs — ICT and Smart Money Concepts multi-pair dashboard for MetaTrader 5. Order blocks, fair value gaps, break of structure, change of character, VWAP, premium and discount range, and multi-timeframe scanner from one chart. Connix scans multiple symbols across configurable timeframes and shows market structure status in an interactive table while drawing the same structures on the active chart. It is an analytical toolkit — you control every setting; it does not place
Smart Market Structure Pro by G-Labs — ICT and Smart Money Concepts toolkit with built-in multi-symbol scanner for MetaTrader 5. Break of structure, change of character, order blocks, fair value gaps, liquidity sweeps, premium and discount zones, ICT sessions, confluence scoring, AI trade ideas, and a traffic-light scanner across up to 30 pairs and four timeframes from one chart. Map SMC and ICT on the active chart while the built-in scanner monitors your full watchlist. Each cell shows BUY, SE

Advanced Market Maker Dashboard by G-Labs — Beat The Market Maker multi-pair scanner for MetaTrader 5. Seventeen-column ADR dashboard with price formation, breaker blocks, TDI SharkFin, RSI divergence, stop hunt, daily candle confirmation, currency strength, and chart overlays from one panel. The full BTMM workflow dashboard for traders who have outgrown a basic scanner. Monitor 28 or more pairs in real time: trend direction, peak formation side (PFH/PFL), ADR expansion in MAX and real-time co
G Labs Trade Manager Mt5
Garry James Goodchild
5 (1)
G-Labs Trade Manager by G-Labs — on-chart trade panel for MetaTrader 5. Risk-based lot sizing, visual entry stop and take profit lines, position management, news filter, currency strength, statistics, and OCO breakout tools. One panel for planning, executing, and managing manual trades. Set risk before you click buy or sell, drag stop loss and take profit on the chart, manage open positions and pending orders, and track performance — you stay in control of every decision. Trading utility, not a
G Cash IC Breaker order blocks
Garry James Goodchild
4.5 (4)
G-Labs IC Breaker by G-Labs — ICT source and breaker order blocks for MetaTrader 4. Multi-timeframe structural zones, breaker invalidation on close, retest alerts, and per-timeframe colour control on one chart. Marks where opposing liquidity rested before a move and what happens when structure breaks. Source order blocks draw as outlined rectangles from the first opposite-colour candle after a structural break. When price closes through the tracked extreme, the zone flips to a filled breaker bl
Advanced Market Maker Dashboard by G-Labs — Beat The Market Maker multi-pair scanner for MetaTrader 4. Seventeen-column ADR dashboard with price formation, breaker blocks, TDI SharkFin, RSI divergence, stop hunt, daily candle confirmation, currency strength, and chart overlays from one panel. The full BTMM workflow dashboard for traders who have outgrown a basic scanner. Monitor 28 or more pairs in real time: trend direction, peak formation side (PFH/PFL), ADR expansion in MAX and real-time col
Market Maker Dashboard by G labs
Garry James Goodchild
4.6 (10)
G-Labs Market Maker Dashboard — Beat The Market Maker multi-pair scanner for MetaTrader 4. Peak Formation context (PFH/PFL), ADR cycle expansion, Asian session range, stop-hunt proximity, daily range versus ADR, and M15 RSI from one panel. Monitor your full watchlist without opening a chart for every pair. The dashboard scans symbols in real time and shows where each one sits in a BTMM-style daily workflow: peak formation side, movement in average daily range multiples, Asian range behaviour, s
G Labs Trade Manager
Garry James Goodchild
G-Labs Trade Manager by G-Labs — on-chart trade panel for MetaTrader 4. Risk-based lot sizing, visual entry stop and take profit lines, position management, currency strength, statistics, and OCO breakout tools. One panel for planning, executing, and managing manual trades. Set risk before you click buy or sell, drag stop loss and take profit on the chart, manage open positions and pending orders, and track performance — you stay in control of every decision. Trading utility, not a black-box si
Connix Multi-Timeframe SMC Dashboard by G-Labs — ICT and Smart Money Concepts scanner for MetaTrader 4. Order blocks, fair value gaps, BOS, CHoCH, VWAP, and premium-discount range across 29+ pairs from one chart. Monitor market structure on your full watchlist without flipping charts — the Connix dashboard shows OB, FVG, structure breaks, VWAP status, and range position per symbol and timeframe while drawing the same zones on the active chart. Connix scans multiple symbols across configurable
G-Labs Market Maker Dashboard — Beat The Market Maker multi-pair scanner for MetaTrader 5. Peak Formation context (PFH/PFL), ADR cycle expansion, Asian session range, stop-hunt proximity, daily range versus ADR, and M15 RSI from one panel. Monitor your full watchlist without opening a chart for every pair. The dashboard scans symbols in real time and shows where each one sits in a BTMM-style daily workflow: peak formation side, movement in average daily range multiples, Asian range behaviour, s

Magic lines mt5
Garry James Goodchild
G-Labs MagicLines — multi-currency cycle and trend dashboard for MetaTrader 5. Heikin-Ashi cycle detection, trend-filtered MagicLine, VWAP MagicLine, multi-pair scanner, Trade Helper panel, and entry suggestions with stop loss and take profit levels from one chart. MagicLines combines three analysis layers on each symbol. Heikin-Ashi cycle logic marks whether a pair is in an up or down cycle and records the structural anchor (swing high or low) where the cycle began. A trend-filtered MagicLine
G-Labs IC Breaker by G-Labs — ICT source and breaker order blocks for MetaTrader 5. Multi-timeframe structural zones, breaker invalidation on close, retest alerts, and per-timeframe colour control on one chart. Marks where opposing liquidity rested before a move and what happens when structure breaks. Source order blocks draw as outlined rectangles from the first opposite-colour candle after a structural break. When price closes through the tracked extreme, the zone flips to a filled breaker bl

G-Labs BTMM All-In-One Template — the classic Beat The Market Maker chart pack for MetaTrader 5. One indicator that brings together the tools BTMM traders have used for years on MT4 installer-style templates: Traders Dynamic Index (TDI), the multi-MA stack, Asian London and New York session frames, ADR information panel, EMA cross signals, and TDI W/M shark-fin markers. If you know the old MT4 BTMM installer pack — the all-in-one chart setup that many traders still run today — this is that ide

Filtrer:
Aucun avis
Répondre à l'avis