Ultimate Trader Suite

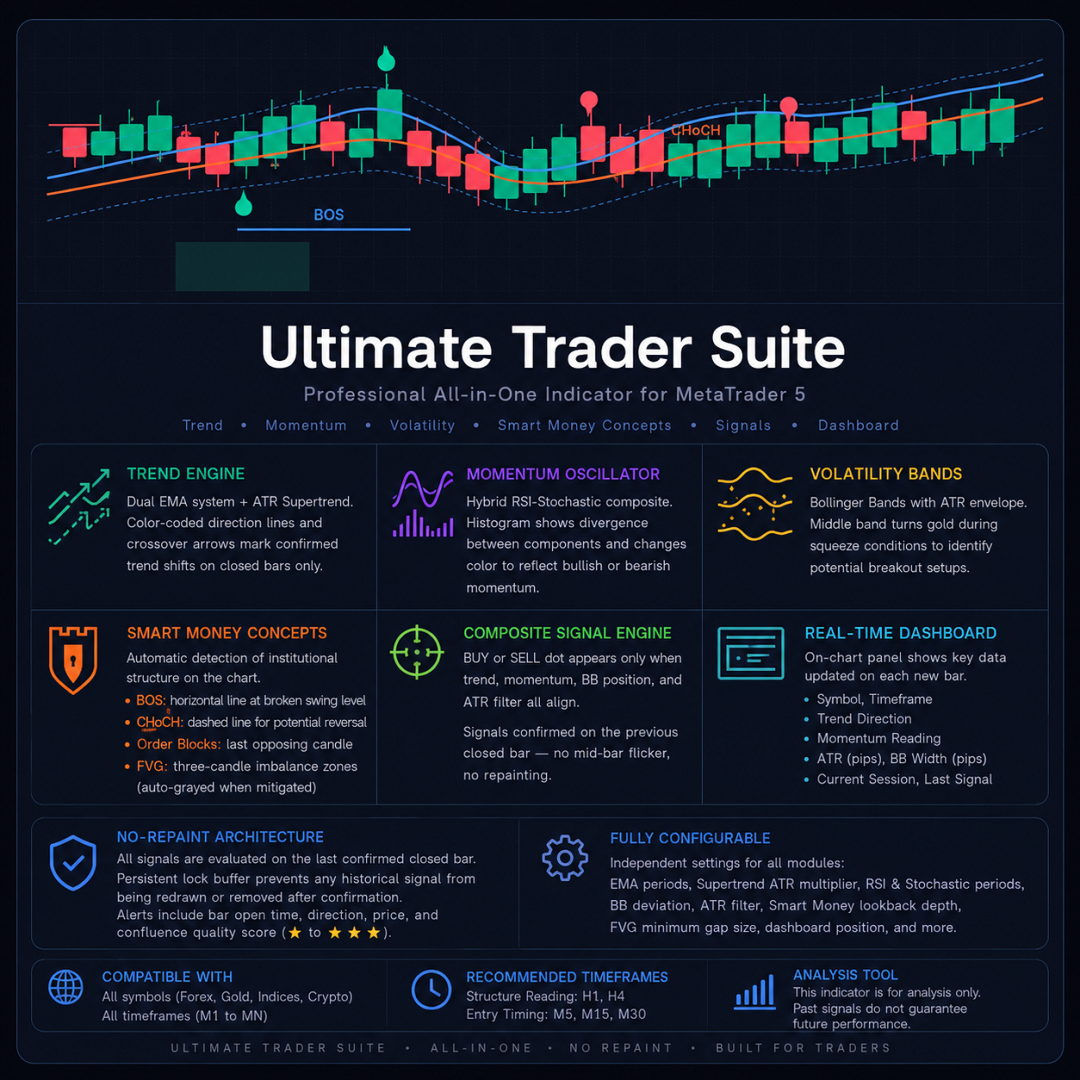
Ultimate Trader Suite is a professional all-in-one indicator for MetaTrader 5, combining five independent analytical modules into a single clean chart interface. Designed for traders who follow institutional price action methodology, it eliminates the need to stack multiple separate indicators.

Key features

Trend Engine Dual EMA system (fast/slow) combined with an ATR-based Supertrend band. Color-coded direction lines and automatic crossover arrows mark confirmed trend shifts on closed bars only.

Momentum Oscillator A hybrid RSI-Stochastic composite. The momentum histogram measures the divergence between the two components and changes color to show bullish or bearish pressure at a glance.

Volatility Bands Bollinger Bands with an ATR envelope overlay. The middle band turns gold during squeeze conditions — when volatility compresses below a dynamic ATR threshold — alerting you to potential breakout setups.

Smart Money Concepts Automatic detection of institutional structure directly on the chart:

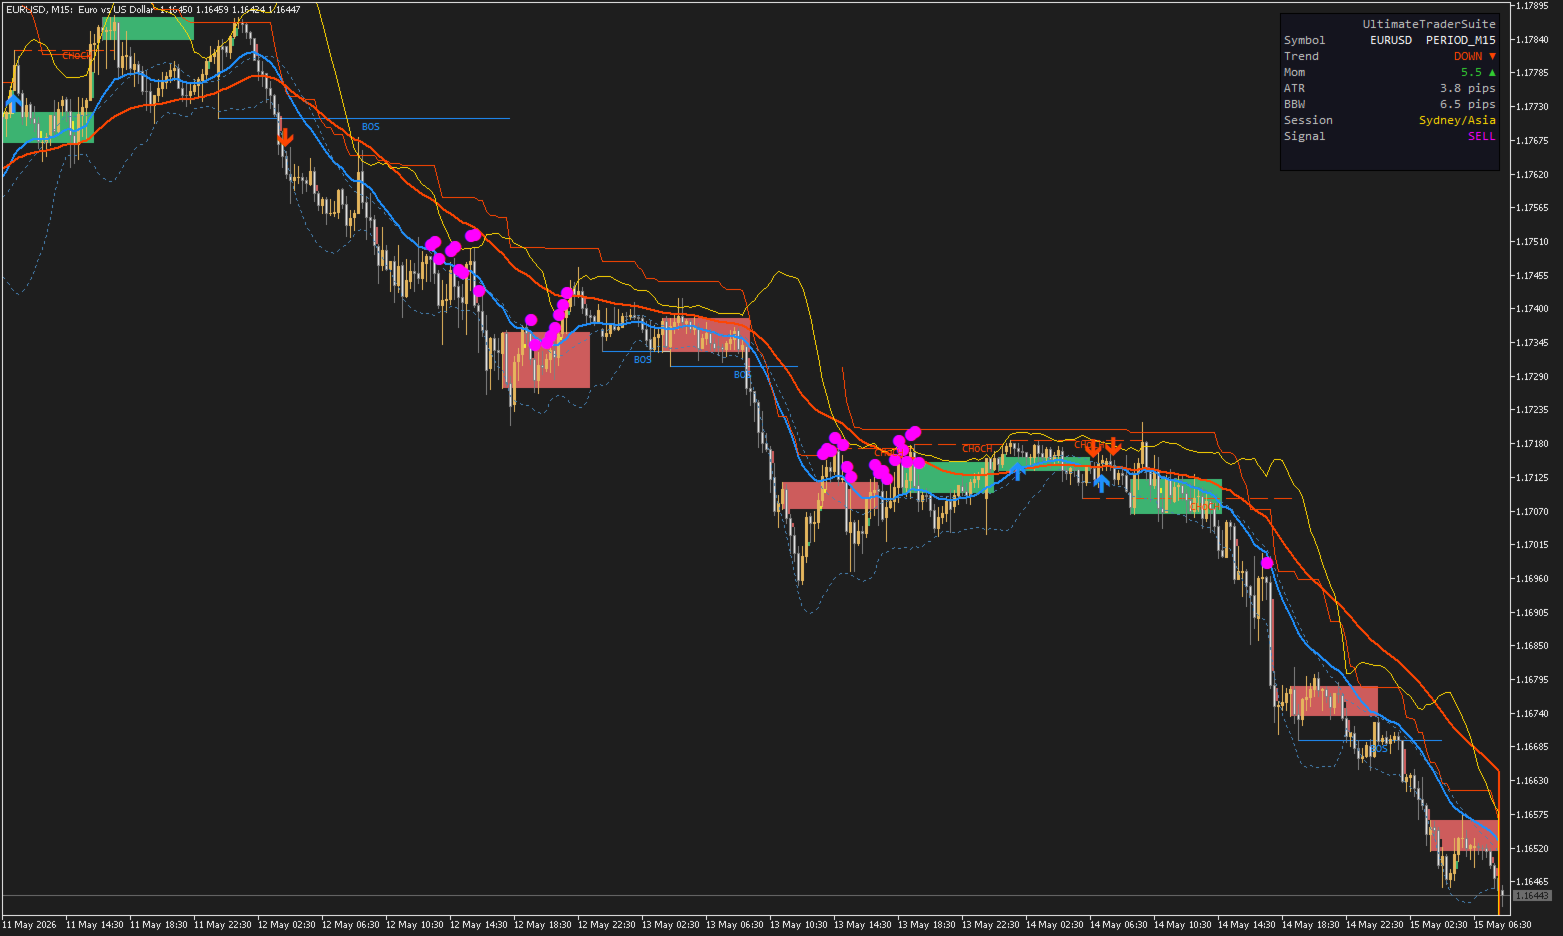
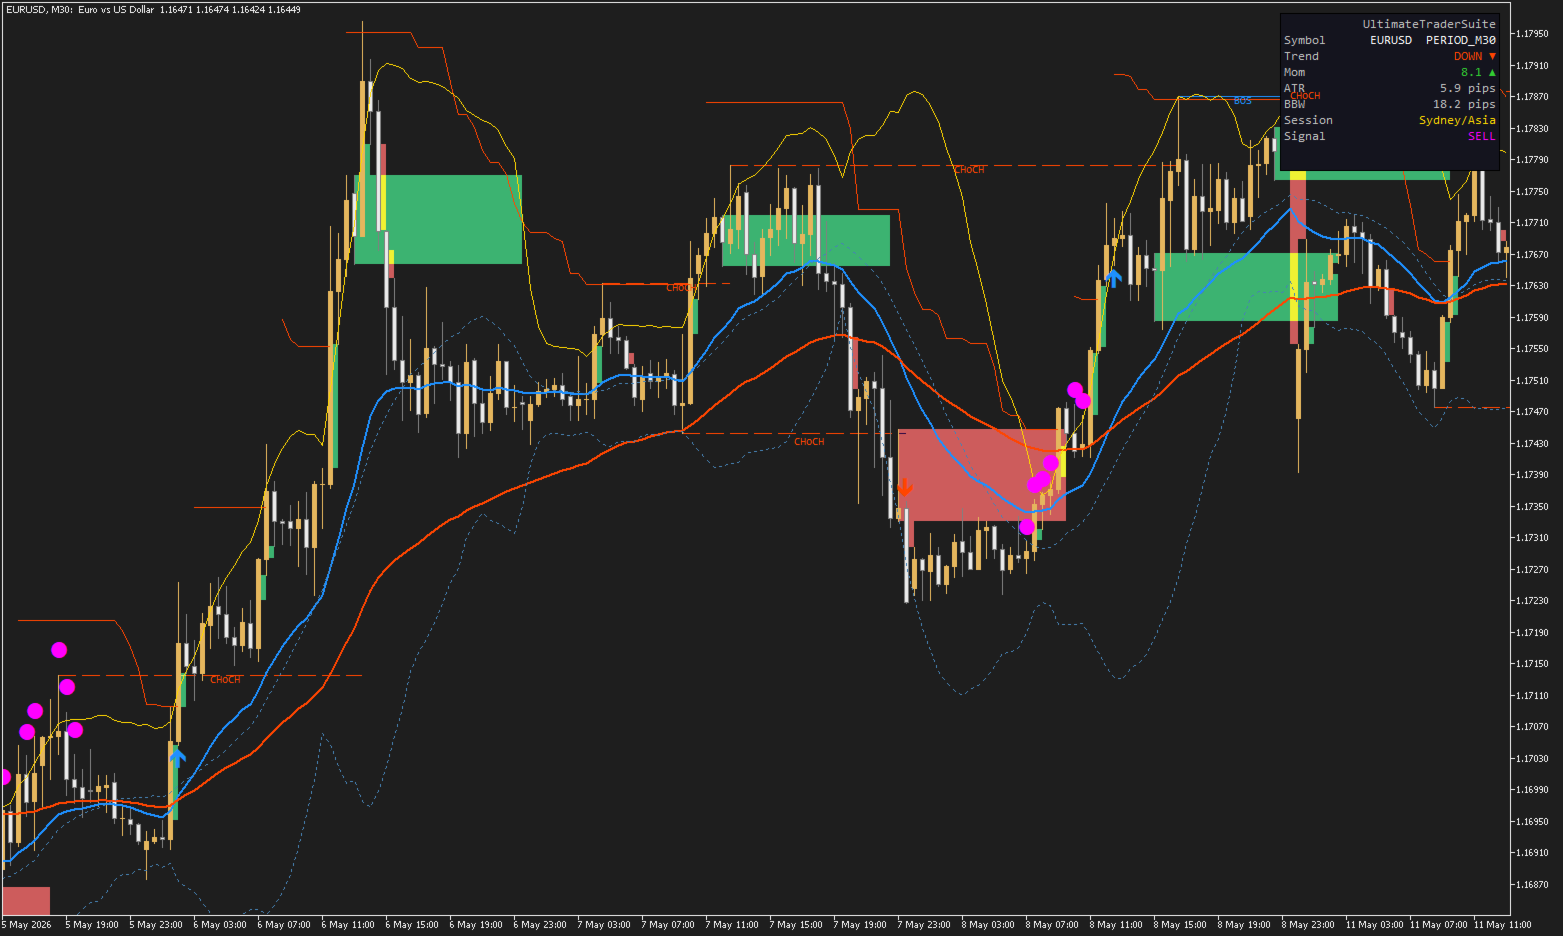
  • Break of Structure (BOS): horizontal line drawn at the exact swing level that was broken, labeled at the midpoint
  • Change of Character (CHoCH): dashed line marking the first counter-trend structural break, signaling a potential reversal
  • Order Blocks: the last opposing candle before each structural break, drawn as a filled rectangle
  • Fair Value Gaps: three-candle imbalance zones displayed as semi-transparent boxes, grayed out automatically when price mitigates them

Composite Signal Engine A BUY or BUY dot appears on the chart only when trend direction, momentum threshold, BB position, and ATR filter all align simultaneously. Signals are confirmed on the previous closed bar — no mid-bar flickering, no repainting.

Real-Time Dashboard A compact on-chart panel displays symbol, timeframe, trend direction, momentum reading, ATR in pips, BB width in pips, current trading session, and last signal — all updated on each new bar.

No-repaint architecture

All signals are evaluated exclusively on the last confirmed closed bar. A persistent lock buffer prevents any historical signal from being redrawn or removed after confirmation. Alert messages include bar open time, direction, price, and a confluence quality score (one to three stars).

Input parameters

All modules are independently configurable. Key inputs include EMA periods, Supertrend ATR multiplier, RSI and Stochastic periods, Bollinger Bands deviation, ATR filter threshold, Smart Money lookback depth, FVG minimum gap size, and dashboard corner position.

Compatible with

All symbols (Forex, Gold, Indices, Crypto) and all timeframes from M1 to MN. Recommended timeframes for structure reading: H1, H4. Recommended for entry timing: M5, M15, M30.

This indicator is an analysis tool. It does not execute trades automatically. Past signals visible on the chart do not guarantee future performance.
おすすめのプロダクト
Donchian Channel DC is the indicator of Donchian Channels, that plots maximum and minimum values of a specific period, besides mean value line. It´s possible to configure simple period for analysis and the indicator will plot all three values. You can trade with this indicator as trend or reversal, according to each strategy. Do not let to test others indicators as soon as others expert advisors.
Order Book, known also as Market Book, market depth, Level 2, - is a dynamically updated table with current volumes of orders to buy and to sell specific financial instument at price levels near Bid and Ask. MetaTrader 5 provides the means for receiving market book from your broker, but in real time only, without access to its history. The indicator OrderBook Cumulative Indicator accumulates market book data online and visualizes them on the chart. In addition, the indicator can show the market
White Weis Volume This indicator shows the sum of the volume in each wave, bulish or bearish, as idealized by David Weis , but it brings an important addition , which is the marking of the bar with the highest volume of the wave (White Bar)! In coding the indicator, it was sought to optimize the code to require minimal processing during use and not to overload mt5. The indicator can be used for pre-trading analysis and study, where the trader analyzes possible points of support and resistance
Volume Statistic
Syamsurizal Dimjati
5 (1)
Ritz Volume Statistic – Color Volume Histogram & Market Flow Insight Ritz Volume Statistic is a clean and powerful volume analysis indicator designed to visualize bullish and bearish market pressure through a dynamic color-graded volume histogram . The indicator transforms raw tick volume into an intuitive color spectrum , allowing traders to instantly identify volume expansion, exhaustion, and dominance shifts between buyers and sellers. A built-in statistical panel summarizes total volume, bul
FREE
FVG Indicator is a high-precision smart money tool that identifies Fair Value Gaps (FVG) and grades them based on displacement, volume, and market structure. Core Features Graded Signals : Automatically ranks gaps into Grade A (Elite) , B , C , and D based on strength. Visual Mitigation : Boxes automatically "truncate" (stop extending) when price reclaims the gap, aligning perfectly with the original logic. Trend Filtering : Uses a 50-period EMA to ensure you only trade in the direction of the d
This is Gekko's Cutomized Cutomized Average Directional Index (ADX), a customized version of the famous ADX indicator. Use the regular ADX and take advantage two entry signals calculations and different ways of being alerted whenever there is potential entry or exit point. Inputs Period: Period for the ADX calculation; PlotSignalType: How will the indicator calculate entry (swing) signals: 1- ShowSwingsOnTrendLevel : Show Signals for Trend Confirmation Swings; 2- ShowSwingsOnTrendLevelDirection
Swiss VWAPsimple
Terence Gronowski
4.8 (5)
Swiss VWAPsimple Motivation Did not find free VWAP that works, the one that I found craseh. So I created a VWAP which calculates values only for the actual day. So computer resouces are not over stressed. What is VWAP, how is it used?  VWAP stands for Volume Weighed Average Price, it calculates the running sum of tick volume and the runnung sum of price times tickvolume. The division of these sums result in a weighed price (Sum P*V/Sum V). The calculation starts normally at midnight. The values
FREE
English VWAP Daily (Clean) is a simple and lightweight indicator that plots the classic Daily VWAP (Volume Weighted Average Price) directly on your MT5 chart. Features: Classic Daily VWAP calculation Supports real volume (if available) or tick volume Timezone offset option to match your broker’s server time Weekend merge option (merge Saturday/Sunday data into Friday) Clean version → no arrows, no alerts, only VWAP line VWAP is widely used by institutional traders to identify fair value, su
FREE
BUY INDICATOR AND GET EA FOR FREE AS A BONUS + SOME OTHER GIFTS! ITALO TREND INDICATOR  is the best trend indicator on the market, the Indicator works on all time-frames and assets, indicator built after 7 years of experience on forex and many other markets. You know many trend indicators around the internet are not complete, does not help, and it's difficult to trade, but the Italo Trend Indicator is different , the Italo Trend Indicator shows the signal to buy or sell, to confirm the signal t
Shadow Flare インジケーターは、MetaTrader 5 向けの 非リペイント型トレンド & 流動性ツール です。設定可能な移動平均ベースライン(HMA / EMA / SMA / RMA から選択)を計算し、その上下に ATR(Average True Range)ベースのバンドを巻き付けることで「粘着性」のあるトレンド状態を生成します。トレンド状態は、価格の終値が上側バンドまたは下側バンドを明確にブレイクしてクローズしたときにだけ反転します。同じトレンドエンジンが自動サプライ・デマンドゾーンモジュールも駆動し、スイングハイ/スイングローを検出してその周囲に色付きボックスを描画し、価格がクローズでゾーンを抜けた瞬間にそのゾーンを無効化(ミティゲート)します。 トレンド状態が反転したバーで買い・売りシグナルが発生し、オプションの出来高フィルターと RSI フィルターにより、弱いエントリーやモメンタムに逆行するエントリーをブロックできます。内蔵ダッシュボードはリアルタイムでトレンドバイアス、モメンタム(RSI ベース)、出来高ステータスを表示します。ポップアップ、サウンド、モ
FREE
Daily Variation Indicator Daily Variation Indicator shows the percentage difference between the current price and the previous day close. The indicator displays the daily market movement directly on the chart, allowing traders to quickly identify whether the market is moving up or down during the current trading session. It is designed to be lightweight, minimal, and highly configurable while providing clear information about the daily price variation. Features • Displays daily percentage variat
Hull Moving Average (HMA) is well-deservedly popular among traders because of the effective averaging of market noise and a relatively small delay. The current MetaTrader 5 version changes its color when the movement direction changes. Sound and text signals are available. It also supports sending email and push messages. It is possible to trigger a signal on the current incomplete bar, although such a signal may be canceled before completion if conditions are no longer appropriate. One of the p
FREE
Индикатор iVeles_Perfect_Oscilator является опережающим и одним из самых лучших осциляторов на сегодняшний день,  использует специализированный расчет текущих цен графика.  Очень качественно и своевременно показывает смену направления, очень точный подход к уровням перекупленности и перепроданности, что позволяет своевременно принять решение по сделке.  Работает качественно на любом ТФ и с любым инструментом. Параметры: Period - период расчетов Average  - усреднение  МА Method - применяемый мето
Smart Stochastic Divergence Detector Stochastic Divergence Detection Indicator for MetaTrader 5 Overview Smart Stochastic Divergence Detector is a technical analysis indicator designed to identify bullish and bearish divergence conditions between price action and the Stochastic oscillator. The indicator supports: Regular divergence detection Hidden divergence detection Trendline visualization Signal marking Configurable alerts Multi-timeframe operation It is intended for traders using momentum-b
TPS Trading Indicator: Comprehensive Technical Overview The TPS Trading Indicator is an advanced, trend-following technical analysis tool engineered for MetaTrader 5. Built with a focus on filtering out market noise and identifying high-probability entry zones, this indicator utilizes a powerful "Dual Confirmation" system. By combining the price-smoothing capabilities of Renko calculations with the directional momentum of the Supertrend algorithm, it delivers precise, actionable signals. While h
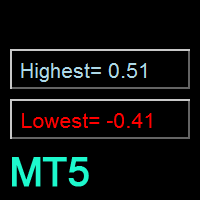
如果产品有任何问题或者您需要在此产品上添加功能,请联系我 Contact/message me if you encounter any issue using the product or need extra feature to add on the base version. Floating Highest Lowest MT5 provides you an intuitive and user-friendly method to monitor the floating highest (profit) and lowest (loss) that all your trades together ever arrive. For example, I opened 3 orders, which arrived at $4.71 floating profit when trade following trend. Later when the trend is against me, these 3 orders arrive $30 in loss, and a
FREE
Last Day Support & Resistance Platform: MetaTrader 5 Type: Custom Indicator Display: Chart Window (Overlay) Functions: Calculates Support and Resistance zones based on high/low patterns of the previous day. Uses a sliding sampling window ( SampleWindowSize ) to detect recent price ranges. Detects potential support if current price range is significantly below previous highs. Detects potential resistance if price range is significantly above previous lows. Updates four output buffers: LDResistanc
FREE
Important Lines
Terence Gronowski
4.88 (24)
This indicator displays Pivot-Lines, preday high and low, preday close and the minimum and maximum of the previous hour. You just have to put this single indicator to the chart to have all these important lines, no need to setup many single indicators. Why certain lines are important Preday high and low : These are watched by traders who trade in a daily chart. Very often, if price climbs over or falls under a preday low/high there is an acceleration in buying/selling. It is a breakout out of a
FREE
AP VWAP Bands Pro (MT5) Volume-weighted average price with ±σ bands for clear intraday bias, mean-reversion zones, and dynamic support/resistance. Works on crypto (incl. BTC) , FX , indices , and metals . Uses tick-volume when real volume isn’t available. What it shows VWAP line (volume-weighted mean price). Two envelopes around VWAP (default ±1σ and ±2σ) to highlight balance vs. extension. Reset modes : Day , Week , or Anchor Time (HH:MM) to start VWAP where you need it (e.g., exchange open).
FREE
The indicator measures the frequency of incoming ticks to analyze the market activity. Bullish and bearish ticks are analyzed separately, informing about the currently predominant market sentiment. According to observations, an increase in the frequency of ticks (panic) indicates the beginning of strong price changes, and an increase in the frequency of ticks in a particular direction not only accompanies a price change in this direction, but also often anticipates it. The indicator is indispens
FREE
The indicator detects and displays М. Gartley's Butterfly pattern. The pattern is plotted by the extreme values of the ZigZag indicator (included in the resources, no need to install). After detecting the pattern, the indicator notifies of that by the pop-up window, a mobile notification and an email. The pattern and wave parameters are displayed on the screenshots. The default parameters are used for demonstration purposes only in order to increase the amount of detected patterns. Parameters z
This indicator can be considered as a trading system. It offers a different view to see the currency pair: full timeless indicator, can be used for manual trading or for automatized trading with some expert advisor. When the price reaches a threshold a new block is created according to the set mode. The indicator beside the Renko bars, shows also 3 moving averages. Features renko mode median renko custom median renko 3 moving averages wicks datetime indicator for each block custom notification
Price Magnet — Price Density and Attraction Levels Indicator Price Magnet is a professional analytical tool designed to identify key support and resistance levels based on statistical Price Density. The indicator analyzes a specified historical period and detects price levels where the market spent the most time. These zones act as “magnets,” attracting price action or forming a structural base for potential reversals. Unlike traditional Volume Profile tools, Price Magnet focuses on price-time d
AW Heiken Ashi MT5
AW Trading Software Limited
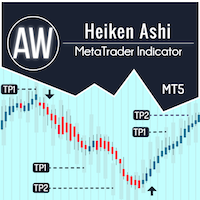
AW Heiken Ashi — トレンドとTPレベルをスマートに表示するインジケーターです。従来のHeiken Ashiをベースにトレーダー向けに改良された高度なインジケーターで、柔軟性と明瞭性が向上しています。標準インジケーターとは異なり、 AW Heiken Ashiは トレンド分析、利益目標の決定、偽シグナルのフィルタリングをサポートし、より確信を持った取引判断を可能にします。 セットアップガイドと手順 - こちら / MT4バージョン - こちら AW 平均足の利点: あらゆる資産と時間枠で機能します。 トレーダーのスタイルに非常に適応性があり、 エントリーレベルとエグジットレベルの動的な計算、 ユーザーフレンドリーなインターフェース+端末への負荷が最小限 本格的な取引戦略として使用するのに適しています。 可能性: 1) 高度なトレンドの視覚化: 現在のトレンドの方向に応じて色付きのHeiken Ashiキャンドルを作成します。これは、市場の状況を便利かつ視覚的に解釈するものです。 2) 柔軟な TakeProfit レベル (TP1 および TP2): 視覚的な目標はチャー
Peak Trough Analysis is the great tool to detect peaks and troughs in your chart. Peak Trough Analysis tool can use three different peaks and troughs detection algorithm. The three algorithm include the orignal Fractals Indicator by Bill Williams, the Modified Fractals indicator and ZigZag indicator. You can use this peak and trough analysis tool to detect the price pattern made up from Equilibrium Fractal-Wave process. For further usage, there are good guide line on how to use this peak trough
FREE
Deriv Synthetic HTF Candle Projection GMT2 Higher Timeframe Candle Projection & Previous Levels Tool for Deriv Synthetic Indices (MT5) Overview Deriv Synthetic HTF Candle Projection GMT2 is a professional MetaTrader 5 indicator built specifically for Deriv Synthetic indices . It projects the current forming Higher Timeframe (HTF) candle onto the chart and automatically draws key reference levels from previous candles. This indicator is designed to help traders maintain higher timeframe context
FREE
Phoenix Delta Volume
Nigel Nii Darku Narnor Darko
This is the Phoenix Institutional SMC Dashboard (Emerald-Teal Edition). It is engineered to provide retail traders with the same "Volume-at-Price" clarity used by institutional desks. Below is a full breakdown of the benefits, the high-confluence logic for entries, and how to manage your trades using the current visual engine. Strategic Benefits to the User Sentiment over Price: Most indicators only look at where the price is. This dashboard tells you how much effort (Volume Delta) was required
FREE
インディケータはチャート上にトレンドラインを描画します。このインジケーターには6つの入力があります。ユーザーは両方の行に代替ラベルを指定できます。インジケーターの複数のインスタンスが使用される場合、ラベルは異なっている必要があります。ユーザーは、線の幅と色、および使用する重要なピークを指定する深さを設定できます。たとえば、Depth = 10は、現在の山と谷を使用してトレンドラインを設定します。この山と谷は、左右に少なくとも10本のバーがあり、高/低がピークの高/低よりも小さい/大きいです。インジケーターは、以前の山と谷もペイントします。インジケーターには、価格がサポート/レジスタンスラインから事前に設定された距離にあるときにユーザーに通知するために使用できるアラート機能が追加されています。アラート距離はピップで設定されます。
FREE
BlueBoat – Prime Cycle is a technical indicator for MetaTrader 5 that visualizes market cycles based on the Fimathe cycle model (Marcelo Ferreira) . It identifies and displays historic and live cycle structures such as CA, C1, C2, C3, etc., helping traders understand the rhythm and timing of price movement across multiple sessions. This tool is ideal for manual analysis or as a supporting signal in discretionary strategies. Key Features Historical Cycle Analysis – Backtest and visualize as many
MA Cross Marker helps traders visualize market direction with two customizable moving averages and clear crossover signals. It can display MA lines from one selected timeframe on the current chart and mark bullish or bearish crosses automatically. Designed for traders who want a lightweight, easy-to-read MA crossover tool. Key Features Display two customizable Moving Averages Automatic Buy/Sell signals on MA crossover Single timeframe MA selection (including higher timeframe display) Clean and
FREE
このプロダクトを購入した人は以下も購入しています
Neuro Poseidon is a new indicator by Daria Rezueva. It combines precise trading signals with adaptive TP/SL levels - creating best possible trades as a result! Message me and get  Neuro Poseidon Assistant  as a gift to automize your trading process! What makes it stand out? 1. Proven profitability on all assets and timeframes 2. Only confirmed BUY and SELL signals present on the chart 3. Adaptive TP & SL levels generated by the software for each trade 4. Easy to understand - suitable for al
SuperScalp Pro
Van Minh Nguyen
4.68 (28)
SuperScalp Pro – プロフェッショナル多層コンフルエンス・スキャルピングシステム SuperScalp Proは、インテリジェントなマルチファクター確認システムを通じて高確率の取引機会を特定するために設計された、プロフェッショナルなマルチレイヤー・コンフルエンストレーディングシステムです。Supertrend、VWAP、EMA、RSI、ADX、出来高分析、ボリンジャーバンド、およびMACDダイバージェンスを統合することで、低品質なセットアップを排除し、ダマシのブレイクアウトシグナルを減らし、エントリー精度を向上させます。 XAUUSD、BTCUSD、および主要なForex通貨ペア向けに特別に最適化されたSuperScalp Proは、ATRベースのボラティリティロジックとルールベースのシグナル検証を通じて市場環境の変化に適応し、M1からH4までの複数時間足で一貫性と客観性のある取引確認を提供します。 内蔵されたスマートコントロールパネルにより、リアルタイムで完全なカスタマイズが可能です。トレーダーは個別の確認フィルターを有効または無効にし、市場環境、取引スタイル、リスク許
まず正直に言いましょう。 どんなインジケーターも、それ単体であなたを利益化させることはできません。もしそう言う人がいるなら、それは夢を売っているだけです。完璧な売買シグナル(矢印)を表示するインジケーターは、いくらでも“完璧に見せる”ことができます。正しい過去の区間を拡大して、勝ちトレードだけを切り取ればいいだけです。私たちはそれをしません。 SMC Intraday Formula はツールです。 市場構造を読み取り、最も高い確率の価格ゾーンを特定し、今この瞬間のスマートマネーの痕跡をシンプルな言葉で正確に示します。最終判断はあなたが行います。トレードを実行するのもあなたです。しかし今は「希望」ではなく「精度」でエントリーできます。 私たちはこのインジケーターを、ゴールド(XAUUSD)および主要FX通貨ペアで約3年間、日々のスキャルピングに使用してきました。M1、M5、M15、M30の主要ツールです。これは未来を予測しようとするのではなく、今まさに形成されている高確率セットアップを示し、その理由を説明します。 他のすべてのインジケーターと何が違うのか? ほとんどのトレーディングイ
M1 Quantum を使用したライブトレードシグナル : シグナル (取引は 自動的に Quantum Trade Assistant によって実行され、この製品に 無料 で含まれています。) 価格プラン: 現在価格: $149 (早期購入者向けオファー) 次回予定価格: $169 予定小売価格: $299 開発者からのお知らせ: ご購入後、 最新の推奨設定ファイル(Set File) 、運用アドバイス、および他の M1 Quantum ユーザーと交流できる VIPサポートグループ への招待をご希望の場合は、お気軽にご連絡ください。 M1 Quantum は、M1専用のプロフェッショナルトレーディングシステムであり、ストップロス、テイクプロフィット、スマートな資金管理を内蔵した、迅速かつ正確な取引シグナルを提供します。 M1 Quantum は、 連続勝利 に重点を置いて口座を素早く成長させるために設計されたプロフェッショナルな資金管理を備えています。 M1 Quantum インジケーター の主な特徴 M1時間足 およびすべての 主要通貨ペア 向けに設計 すべての取引にストップロス
この製品は 2026 年の市場向けに更新され、最新の MT5 ビルドに最適化されています。 価格更新のお知らせ: Smart Trend Trading System は現在 $99 で提供されています。 次の 30 件の購入 後、価格は $199 に上がります。 特別オファー: Smart Trend Trading System を購入後、私にプライベートメッセージを送ることで、 Smart Universal EA を無料 で受け取り、Smart Trend のシグナルを自動売買に変えることができます。 Smart Trend Trading System は、リペイントなし、再描画なし、遅延なしの完全なトレーディングシステムです。よりクリーンなシグナル、より明確なトレンド方向、そしてより整理された取引方法を求めるトレーダー向けに作られています。 Online course , manual and [download presets] . このシステムは、トレンド検出、反転ゾーン、Smart Cloud、トレーリングストップロジック、サポートとレジスタンス、ローソク足の色分け
Entry In The Zone and SMC Multi Timeframe is a real-time 2-in-1 market analysis tool that combines market structure analysis and a No Repaint BUY / SELL signal system into a single indicator, built on Smart Money Concepts (SMC) — a widely adopted framework used by professional traders to understand market structure. This indicator helps you see the market more clearly, make decisions based on structure rather than guesswork, and focus on high-probability zones where price is more likely to react
Power Candles V3 - 自己最適化型強弱インジケーター Power Candles V3は 、通貨や銘柄の強さを、適用されたすべてのチャート上で実行可能なトレードプランに変換します。単にローソク足を色分けするだけでなく、バックグラウンドでリアルタイムの自動最適化を実行し、目の前の銘柄に対して最適なストップロス、テイクプロフィット、およびシグナルの閾値を提示します。ワンクリックで実取引に適用でき、エントリーポイント、ストップロス、テイクプロフィットのラインが正確な価格位置にチャート上に表示され、方向性を示すアラートがリアルタイムで発動します。 このツールは、Stein Investmentsのエコシステムの一部です。  18種類以上のツールをすべて閲覧し、AIを活用したセットアップの推奨事項を入手し、  https://stein.investments でコミュニティに参加しましょう クローズしたバーごとに3,000回以上のトレードシミュレーション。9つの強さの状態。2つの戦略を並行してテスト。勝率の高い設定をワンクリックで適用。 なぜこれが必要なのか ほとんどの強
Trend Sniper X
Sarvarbek Abduvoxobov
5 (3)
Trend Sniper X は、MetaTrader 5 用のマルチタイムフレーム・トレンドフォロー・インジケーターです。トレーダーがトレンドの方向性と反転ポイントを明確かつ正確に特定できるよう支援します。 価格情報: 現在の価格はキャンペーン価格であり、今後のアップデートや新機能のリリースに伴い変更される可能性があります。 Code2Profit チャンネル マルチタイムフレーム分析で市場をマスターしよう! 技術仕様 プラットフォーム MetaTrader 5 インジケータータイプ マルチタイムフレーム・トレンドインジケーター 操作タイムフレーム あらゆるチャートタイムフレームに対応。個別に選択可能な上位タイムフレーム (M1–MN1) を搭載 主要銘柄 FX、ゴールド (XAUUSD)、およびその他のCFD 推奨口座 あらゆる口座タイプに対応 視覚化 色分けされたトレンドローソク足 (買い/売り/弱気/変化) + 買い/売り矢印 追加モジュール セッション市場ボックス (シドニー、東京、ロンドン、ニューヨーク) 主な機能 マルチタイムフレーム・トレンド分析: 上位タイムフレームの
このインジケーターを購入された方には、以下の特典を 無料 で提供しています: 各トレードを自動で管理し、ストップロスとテイクプロフィットを設定し、戦略ルールに基づいてポジションを決済する補助ツール 「Bomber Utility」 様々な銘柄に合わせたインジケーターの設定ファイル(セットファイル) 「最小リスク」、「バランスリスク」、「待機戦略」 の3つのモードで使用できる Bomber Utility 用の設定ファイル このトレーディング戦略をすぐに導入・設定・開始できる ステップバイステップのビデオマニュアル ご注意: 上記の特典を受け取るには、MQL5のプライベートメッセージシステムを通じて販売者にご連絡ください。 オリジナルのカスタムインジケーター 「Divergence Bomber(ダイバージェンス・ボンバー)」 をご紹介します。これは、MACDのダイバージェンス(乖離)戦略に基づいた 「オールインワン」型のトレーディングシステム です。 このテクニカルインジケーターの主な目的は、価格とMACDインジケーターの間に発生するダイバージェンスを検出 し、将来の価格の動きを示す
Gann Made Easy   は、ミスター・ギャンの理論を使用した取引の最良の原則に基づいた、プロフェッショナルで使いやすい外国為替取引システムです。 W・D・ガン。このインジケーターは、ストップロスとテイクプロフィットレベルを含む正確な買いと売りのシグナルを提供します。 PUSH通知を利用して外出先でも取引可能です。 ご購入後、取引方法の説明と優れた追加インジケーターを無料で入手するには、私にご連絡ください! おそらく、ギャンの取引手法についてはすでに何度も聞いたことがあるでしょう。通常、ギャンの理論は初心者のトレーダーだけでなく、すでにある程度の取引経験がある人にとっても非常に複雑なものです。なぜなら、ギャンの取引手法は理論的にはそれほど簡単に適用できるものではないからです。私はその知識を磨き、最良の原則を私の外国為替インジケーターに組み込むために数年を費やしました。 このインジケーターは非常に簡単に適用できます。必要なのは、それをチャートに添付し、簡単な取引推奨事項に従うだけです。このインジケーターは常に市場分析の仕事を行い、取引の機会を探します。適切なエントリーポイントを検
The Oracle Pro:MT5向け合成マルチタイムフレーム・バイアスエンジン ️ サマー・ローンチ・オファー — The Oracle Pro を 199 USD で(早期購入者向け)。価格は普及に応じて上昇します。最終価格 399 USD。 The Oracle Pro は、要求の高いプロのトレーダーのために作られた MetaTrader 5 向けのプレミアム・マルチタイムフレーム バイアスエンジン です。ひとつの問いに規律をもって答えます。すなわち、各タイムフレームの現在の方向バイアスは何か、その強さはどれほどか、そしてタイムフレーム同士はどれだけ一致しているか。すべては確定足のみで計算され、リペイントはありません。 The Oracle Pro はマルチファクター・コンセンサス・システムです。独自のインジケーターと最適化されたアルゴリズムを単一の高度なコンセンサス・ベクトルに統合し、それを単一のインジケーター・インスタンス内で現在足と上位足のスタックにわたって読み取ります。複数のチャートにばらばらのツールを積み重ねる代わりに、です。 これは Oracle コンセンサス手法
UZFX {SSS} スキャルピング・スマートシグナル v4.0 MT5は、変動の激しい市場において正確かつリアルタイムのシグナルを求めるスキャルパー、デイトレーダー、スイングトレーダー向けに設計された、リペイントのない高性能な取引インジケーターです。(UZFX-LABS)によって開発されたこのインジケーターは、価格行動分析、トレンド確認、スマートフィルタリングを組み合わせることで、すべての通貨ペアおよび時間軸において、高確率の売買シグナル、警告シグナル、トレンド継続の機会を生成します。 トレードの判断に迷うのはもうやめましょう。明確さ、正確さ、そして規律ある市場執行を求めるトレーダーのために設計された、体系的なシグナルシステムに従い始めましょう。 私のおすすめ* 最適な時間足:15分足以上。 {H1} が私のお気に入りです。そして、その成果は驚異的です…!! 主な機能の更新 • 自動売買シグナル検出 • 高度な反転認識ロジック • 市場反転の可能性に先立つ早期警告シグナル • トレンド継続確認シグナル • エントリー、ストップロス、TP1、TP2、TP3レベルを備えた組み込み型
この製品は 2026 年の市場向けに更新され、最新の MT5 ビルドに最適化されています。 価格更新のお知らせ: Atomic Analyst は現在 $99 で提供されています。 次の 30 件の購入 後、価格は $199 に上がります。 特別オファー: Atomic Analyst を購入後、私にプライベートメッセージを送ることで、 Smart Universal EA を無料 で受け取り、Atomic Analyst のシグナルを自動売買に変えることができます。 Atomic Analyst は、リペイントなし、再描画なし、遅延なしの Price Action トレーディングインジケーターで、手動取引、シグナルの明確化、EA 自動化のために設計されています。 User manual: settings, inputs and strategy.   &   User Manual PDF . 価格行動、強さ、モメンタム、マルチタイムフレーム方向、高度なフィルターを分析し、トレーダーがノイズを減らし、弱いセットアップを避け、より構造化された取引判断を行えるようにします。 このイ
このインジケーターは、市場で 関心が示されたゾーン をハイライトし、その後に 注文の蓄積ゾーン を表示します。 これは、大規模な**板情報(オーダーブック)**のように機能します。 これは、 巨大な資金 のためのインジケーターです。その性能は卓越しています。 市場にどんな関心が存在していても、 必ず目に見えるようになります 。 (これは 完全に再設計され、自動化されたバージョン です。もはや手動分析は必要ありません。) トランザクションスピード(取引速度) は新しい概念のインジケーターで、市場で大口注文が どこに・いつ 集中しているかを示し、それに基づいたチャンスを提供します。 トレンドの変化を 非常に早い段階 で察知することができます。 FXでは「出来高」と呼ばれているものは誤解されています。実際には、これは 時間あたりの価格変動量 です。したがって、正しい名称は トランザクションスピード です。 考え方・行動・分析の仕方すべてが問われます。 分析パラダイムの転換は非常に重要です。 このインジケーターは、FXにおける出来高の考え方を 根本から再定義 し、論理的な形で正確に活用する、
AXIOM MATRIX MT5 ローンチ価格:$99 Axiom Matrix はローンチ価格 $99 でご利用いただけます。 最初の30件の購入後、価格は $199 に上がります。 ご購入後、手順のご案内と限定ギフトボーナスの受け取りのために、直接DMをお送りください。 Axiom Matrix は、MetaTrader 5 用のプロフェッショナルなマルチシンボル・マルチタイムフレーム市場スキャナー兼意思決定ダッシュボードです。 Market Watch をスキャンし、複数の時間足を分析し、複数のエビデンスエンジンを読み取り、最も強いチャンスを比較し、1つのクリーンなマトリックスダッシュボード内で最適な BUY、SELL、WAIT、またはブロック状態を表示します。 私が Axiom Matrix を作った理由は、市場スキャンという重い作業を代わりに行ってくれる1つのツールが欲しかったからです。 RSI だけを確認したくありませんでした。 次に MACD だけ。 次に移動平均線。 次に出来高。 次にボラティリティ。 次にサポートとレジスタンス。 そして、1つのトレードアイデアを作るた
GoldenX Entryは、MT5向けのインジケーターであり、適応型Smart Entry Trendアルゴリズム、シグナルスコアリングシステム、マーケットレジーム検出機能、およびボラティリティフィルターを備えています。各シグナルには、計算されたエントリーレベル、3つのテイクプロフィット(TP1、TP2、TP3)、およびストップロスレベルが含まれます。本インジケーターは、異なる市場環境に適応するために設計された複数の分析レイヤー上に構築されており、マルチレイヤー分析システムと内蔵オプティマイザーおよび統計トラッキングシステムを組み合わせています。リスク・リワード(RR)指標および過去のトレード履歴に基づく定量分析を提供します。 使い始めは簡単です — 選択した時間足でオプティマイザーを実行し、そのままチャート上でインジケーターを使用します。 コア機能 GoldenX Entryは、シグナルエンジンとトレード管理機能、そして過去統計トラッキングを1つのチャートに統合しています: - 内蔵オプティマイザー: オプティマイザーはチャート上でワンクリックで実行できます。200通りのパラメー
ご紹介     Quantum Breakout PRO は 、ブレイクアウト ゾーンの取引方法を変革する画期的な MQL5 インジケーターです。 13年以上の取引経験を持つ経験豊富なトレーダーのチームによって開発されました。     クォンタム ブレイクアウト プロ   は、革新的でダイナミックなブレイクアウト ゾーン戦略により、あなたのトレーディングの旅を新たな高みに押し上げるように設計されています。 クォンタム ブレイクアウト インジケーターは、5 つの利益ターゲット ゾーンを備えたブレイクアウト ゾーン上のシグナル矢印と、ブレイクアウト ボックスに基づいたストップロスの提案を提供します。 初心者トレーダーにもプロのトレーダーにも適しています。 量子EAチャネル:       ここをクリック 重要!購入後、インストールマニュアルを受け取るためにプライベートメッセージを送ってください。 推奨事項: 時間枠: M15 通貨ペア: GBPJPY、EURJPY、USDJPY、NZDUSD、XAUUSD アカウントの種類: ECN、Raw、またはスプレッドが非常に低い R
FX Trend NG:次世代マルチマーケット・トレンドインテリジェンス 概要 FX Trend NG は、複数の時間足に対応したプロフェッショナル向けトレンド分析およびマーケット監視ツールです。 市場全体の構造を数秒で把握することができます。 複数のチャートを切り替える必要はありません。どの銘柄がトレンド中なのか、どこでモメンタムが弱まっているのか、そしてどの時間足で強い整合性があるのかを瞬時に確認できます。 ローンチ特別オファー – FX Trend NG を $30(6ヶ月) または $80 永久ライセンス でご利用いただけます。 すでに Stein Investments のユーザーですか? -> メッセージを送信 して、プライベートグループへアクセスしてください。 セットアップや詳細情報が必要ですか? -> Stein Investments 公式ページ をご覧ください。 1. FX Trend NG が他と異なる理由 3ステート・トレンドロジック ― Buy と Sell だけではない • 多くのインジケーターは Buy または Sell の2状態のみを表示します。
ARIPoint
Temirlan Kdyrkhan
1 (1)
ARIPoint is a powerful trading companion designed to generate high-probability entry signals with dynamic TP/SL/DP levels based on volatility. Built-in performance tracking shows win/loss stats, PP1/PP2 hits, and success rates all updated live. Key Features: Buy/Sell signals with adaptive volatility bands Real-time TP/SL/DP levels based on ATR Built-in MA Filter with optional ATR/StdDev volatility Performance stats panel (Success, Profit/Loss, PP1/PP2) Alerts via popup, sound, push, or email Cu
FX Power: 通貨の強弱を分析して、より賢い取引を実現 概要 FX Power は主要通貨と金の実際の強弱をあらゆる市場状況で理解するための必須ツールです。強い通貨を買い、弱い通貨を売ることで、 FX Power は取引の意思決定を簡素化し、高い確率の取引機会を見出します。トレンドを追従する場合でも、極端なデルタ値を使用して反転を予測する場合でも、このツールはあなたの取引スタイルに完全に適応します。ただ取引するだけではなく、 FX Power で賢く取引をしましょう。 1. なぜ FX Power がトレーダーにとって非常に有益なのか 通貨と金のリアルタイム強弱分析 • FX Power は主要通貨と金の相対的な強弱を計算し、マーケットダイナミクスに関する明確な洞察を提供します。 • どの資産がリードしているか、または後れを取っているかを監視して、取引するペアを賢く選びましょう。 マルチタイムフレームの包括的なビュー • 短期、中期、長期のタイムフレームで通貨と金の強弱を追跡し、マーケットトレンドに基づいて取引戦略を調整できます。 • スキャルピングからスイングトレード
現在33%オフ 初心者にもエキスパートトレーダーにも最適なソリューション このインジケーターは独自の機能と新しい公式を多数内蔵しており、ユニークで高品質かつ手頃な取引ツールです。このアップデートでは、2つの時間枠ゾーンを表示できるようになります。より長いTFだけでなく、チャートTFとより長いTF(ネストゾーンを表示)の両方を表示できます。すべてのSupply Demandトレーダーの皆さんのお気に召すはずです。:) 重要情報の公開 Advanced Supply Demandの可能性を最大化するには、 https://www.mql5.com/ja/blogs/post/720245 にアクセスしてください。   エントリーまたはターゲットの正確なトリガーポイントを正確に特定できれば取引がどのように改善されるか想像してみてください。新しい基盤となるアルゴリズムに基づいて構築されているため、買い手と売り手の間の潜在的な不均衡をさらに簡単に特定できます。これは、最も強い需要と供給のゾーンと、過去のパフォーマンス(古いゾーンを表示)がグラフィカルに表現されるためです。これらの機能は、最適な
この製品は 2026 年の市場向けに更新され、最新の MT5 ビルドに最適化されています。 価格更新のお知らせ: Smart Price Action Concepts は現在 $200 で提供されています。 次の 30 件の購入 後、価格は $299 に上がります。 特別オファー: 購入後、私にプライベートメッセージを送ることで、 無料ボーナス + ギフト を受け取ることができます。 まず、このトレーディングツールはリペイントなし、再描画なし、遅延なしのインジケーターであり、プロフェッショナルな取引に最適であることを強調しておきます。 Online course , and manual Smart Price Action Concepts Indicator は、初心者から経験豊富なトレーダーまで使える非常に強力なツールです。20 種類以上の便利なインジケーターを 1 つにまとめ、Inner Circle Trader Analysis や Smart Money Concepts Trading Strategies などの高度な取引アイデアを組み合わせています。このインジケ
Crystal Heikin Ashi Signals - Professional Trend & Signal Detection Indicator Advanced Heikin Ashi Visualization with Intelligent Signal System for Manual & Automated Trading Final Price: $149 ---------> Price goes up $10 after every 10 sales . Limited slots available — act fast . Overview Crystal Heikin Ashi Signals is a professional-grade MetaTrader 5 indicator that combines pure Heikin Ashi candle visualization with an advanced momentum-shift detection system. Designed for both manual traders
Reversion King Indicator
Eugen-alexandru Zibileanu
5 (5)
新たな王者が登場 - インジケーター + 注文管理表示(TP1 + TP2 + TP3)+ オプションのTelegramシグナル送信機能付き(無料) (完全なトレード&シグナルシステム) ゴールド向け最高のEA: Gold Slayer このインジケーターには、高度な戦略、カスタマイズ可能な注文管理システム、そしてエンベロープ拡張を組み合わせた平均回帰システムが搭載されています。さらに、RSIなど複数のインテリジェントな確認フィルターによって、高確率の反転エントリーをBUY・SELLシグナルとして検出します。 単にトレードを学ぶだけでなく、複数ポジションを効果的に管理し、過去に利益を出しているオープンポジションで損失トレードをカバーする方法も学べます。 M5向けに構築・最適化されており、流動性が高くシグナルの精度が安定しているBTCUSDとXAUUSDで優れたパフォーマンスを発揮します。 このインジケーターは、ATRを基に自動計算されたエントリー、ストップロス、テイクプロフィットレベルを備えた明確なLong・Shortシグナルを提供するため、リスク管理が最初から組み込まれています。 マ
Quantum TrendPulse を ご紹介します。これは、   SuperTrend   、   RSI   、および Stochastic のパワーを 1 つの包括的なインジケーターに組み合わせて、取引の可能性を最大限に引き出す究極の取引ツールです。精度と効率を求めるトレーダー向けに設計されたこのインジケーターは、市場のトレンド、勢いの変化、最適なエントリー ポイントとエグジット ポイントを自信を持って特定するのに役立ちます。 主な特徴: SuperTrend 統合: 現在の市場動向に簡単に追従し、収益性の波に乗ることができます。 RSI精度: 買われすぎと売られすぎのレベルを検出し、市場の反転のタイミングに最適で、SuperTrendのフィルターとして使用されます。 確率的精度: 確率的振動を活用して、変動の激しい市場で隠れたチャンスを見つけます。SuperTrend のフィルターとして使用されます。 マルチタイムフレーム分析:   M5 から H1 または H4 まで、さまざまなタイムフレームで市場を常に把握します。 カスタマイズ可能なアラート: カスタム取引条件が満たされ
Meridian Pro
Ottaviano De Cicco
5 (2)
Meridian Pro 2.00:MT5向けプロ仕様マルチタイムフレーム・トレンドマトリクス Meridian Pro 2.00 は、MetaTrader 5 向けのプロ仕様の適応型トレンドマトリクスです。オリジナルの Meridian トレンドエンジン、クリーンなチャート ribbon、確定足ベースのシグナル矢印、8時間足 dashboard、Fuel momentum、weighted consensus、synthetic HTF processing、そしてチャート上に直接表示される上位足コンテキストラインを統合します。 目的はシンプルです。現在のトレンド、マルチタイムフレーム構造、強度、momentum、EA-ready 状態を、複数チャートに無関係なインジケータを重ねるのではなく、1つの整理された workflow で読むことです。 ️ サマーセール — 夏至とThe Oracle Proの発売を記念して、Meridian Proが現在99 USD(通常149 USD)。期間限定の夏季オファー。 Meridian Pro の違い 1つの適応型エンジン - 同じ vola
Atbot
Zaha Feiz
4.69 (55)
AtBot: どのように機能し、どのように使用するか ### どのように機能するか MT5プラットフォーム用の「AtBot」インジケーターは、テクニカル分析ツールの組み合わせを使用して売買シグナルを生成します。単純移動平均(SMA)、指数移動平均(EMA)、および平均真実範囲(ATR)インデックスを統合して取引機会を特定します。さらに、Heikin Ashiキャンドルを使用してシグナルの精度を向上させることもできます。 購入後にレビューを残すと、特別なボーナスギフトを受け取ります。 ### 主な機能: - 再描画なし: シグナルはプロット後に変更されません。 - 再描画なし: シグナルは一貫しており、変更されません。 - 遅延なし: 遅延なくタイムリーなシグナルを提供します。 - 多様な時間枠: あらゆる時間枠で使用可能で、取引戦略に合わせることができます。 ### 操作手順: #### 入力と設定: - firstkey (TrendValue): トレンド検出の感度を調整します。 - Secondkey (SignalValue): 売買シグナル生成の感度を定義します。 - ma
Azimuth Pro
Ottaviano De Cicco
5 (7)
Azimuth Pro V2:MT5向けシンセティック・フラクタル構造分析と確認済みエントリー 概要 Azimuth Pro は Merkava Labs によるマルチレベルスイング構造インジケーターです。4つのネストされたスイングレイヤー、スイングアンカーVWAP、ABCパターン検出、3タイムフレーム構造フィルタリング、そして確定バーでの確認済みエントリー — 1つのチャートで、ミクロスイングからマクロサイクルまでを網羅するワークフロー。 これはブラインドシグナル製品ではありません。ロケーション、コンテキスト、タイミングを重視するトレーダーのための構造ファーストワークフローです。 ️ サマーセール — 夏至とThe Oracle Proの発売を記念して、Azimuth Proが30%オフ。現在279 USD(通常399 USD)。期間限定の夏季オファー。 1. V2での変更点 シンセティック・マルチタイムフレームエンジン 上位タイムフレーム分析をMeridian Proと同じ独自のシンセティックアーキテクチャで一から再構築。よりクリーンなHTFコンテキスト、安定したライブ動作、
Trend Forecaster は、ブレイクアウトシグナル、反転の可能性があるエリアの分析、マーケットレンジデータ、視覚的な統計パネルを1つのチャート作業スペースにまとめた MetaTrader 5 インジケーターです。 Buy と Sell シグナルを表示し、Average Range と Current Range を追跡できます。また、現在の銘柄と時間足に合わせて Sensitivity を自動調整できます。Sensitivity の手動設定も可能です。 このインジケーターは、FX通貨ペア、金属、株式、指数、暗号資産で使用できます。複数の時間足に対応しており、M5 は実用的な開始点として使えます。 主な機能 ブレイクアウトと反転エリアの分析 Trend Forecaster は、検出されたエリア付近の価格の動きを分析し、内部のブレイクアウト条件が満たされたときに Buy または Sell シグナルを表示します。このインジケーターは、トレンド継続と反転の可能性があるゾーンの両方を確認するために使用できます。 複数フィルターによるシグナルロジック このインジケーターは、複数の内部
GEM Signal Pro GEM Signal Pro は、MetaTrader 5 向けのトレンドフォロー型インジケーターです。より明確なシグナル、より整理されたトレードセットアップ、そして実用的なリスク管理をチャート上で確認したいトレーダーのために設計されています。 単純な矢印だけを表示するのではなく、GEM Signal Pro はトレード全体の考え方を、より見やすく分かりやすい形で表示します。条件が確認されると、インジケーターはエントリー価格、ストップロス、利確目標をチャート上に表示し、トレードセットアップをより効率的に確認できるようにします。 動作の仕組み このインジケーターは、まず内部ロジックに基づいて有効なシードシグナルを検出します。 確認条件が満たされると、GEM Signal Pro はチャート上に完全なセットアップを表示します。これにより、トレーダーはトレード構造をより明確に把握し、手作業による分析を減らすことができます。 チャート上のトレードレベル 確認済みシグナルに対して、GEM Signal Pro は以下を表示できます。 エントリー価格 ストップロス テ
作者のその他のプロダクト
NFP発表時の価格急騰。日次損失限度額が数秒で超過。口座が制限されました。 これは、高ボラティリティイベント中に証拠金が手動反応より速く低下するときに発生します。 PropFirm Risk Guardは、証拠金をリアルタイムで監視し、定義した限度額に近づくと自動的に反応します。 厳格なリスク規則を持つプロップファームチャレンジ向けに設計:FTMO、The5ers、Funded Trading Plus、MFF。 パーセンテージベース(日次5%、最大10%)および米ドルベースのドローダウン計算の両方をサポートし、異なる企業の要件に対応します。 高ボラティリティシナリオに最適化:金(XAUUSD)取引、主要指数、ニュースイベント、オーバーナイトギャップ。 主な機能: リアルタイム証拠金監視: 日次および口座のドローダウンを100ミリ秒ごとに追跡します。限度額に近づくと反応し、さらなる損失を防ぎます。 ソフト/ハード保護モード: ソフトモードは、ポジションを閉じる前にカウントダウンタイマー付きの警告を提供します。ハードモードは即座に実行します。反応スタイルを選択できます。 決済済み損益の時
Manual position management. Missing SL. Price moves against you. No protection. Trade Manager Lite automates Stop Loss, Take Profit, Trailing Stop, and Break-Even for your open positions. Attach to one chart. Configure your default SL/TP distance. Let it manage your positions automatically. What's Included (FREE Version) Auto SL/TP: Applies missing Stop Loss and Take Profit to positions based on your configured distance in points Trailing Stop: Adjusts SL dynamically as price moves in your favor

FREE
追加の資料と説明書 インストールの説明 - 使用方法 - デモ口座用のアプリケーションの体験版 ファンド口座。一度のロット計算ミス。ドローダウン上限を突破。口座閉鎖。 戦略が悪かったのではない。執行の瞬間にリスクが管理されていなかったからだ。 Trade Command Center はビジュアル注文執行・リスク管理パネルです。 SL距離からロットを計算。ポジションを自動管理。ドローダウン上限をリアルタイム監視。 5タブ。1チャートパネル。DLLなし。外部接続なし。 正確な執行とプロップファーム準拠を必要とする裁量トレーダー向けに設計。 プロップファーム系ルールに対応した柔軟なRisk Guard設定。日次損失、週次損失、エクイティ・ドローダウン、フローティング損失に対応。 コア機能 ビジュアル・トレード・プランニング: チャート上でEntry、SL、TPボックスをドラッグ。ロット、ピップス距離、ドル金額、R:Rをリアルタイム表示。ワンクリック執行。 リスク計算: リスクモードを選択 — 残高比率、固定金額、固定ロット。パネルがポジションサイズを自動計算。 カスタムR:Rコントロ
SMC Liquidity Channel Guard Prices reverse just as your breakout trade triggers. Account suffers unexpected drawdown. Because standard channels ignore institutional liquidity sweeps and trap retail stop-loss orders. This utility automatically monitors highest buy-side and lowest sell-side liquidity pools to flag false breakouts. Key Features: Dynamic Liquidity Tracking: Maps Buy-Side (BSL) and Sell-Side (SSL) boundaries without lagging moving averages. Sweep Identification: Prints precise direct
FREE
Morvan
Nguyen Thanh Trieu
MORVAN 私はMorvanです。 方向を読み、構造を待ち、価格が動きが展開する可能性が最も高いレベルに達した時にのみ仕掛けます。 推測なし。リベンジトレードなし。ノイズの中でローソク足を追いかけることなし。 構造が揃った時にのみ執行し、エントリーからエグジットまで全てのポジションを規律を持って管理します。 ほとんどのトレーダーはチャートが読めないから負けるのではありません。エントリーが遅すぎ、ポジションサイズが緩すぎ、流動性が狙うところにストップを置き、感情が出口判断を上書きするから負けるのです。 私はその弱点を排除するために設計されました。 私は市場を予測しません。する必要がないのです。 バイアスを読み、構造の形成を待ち、継続またはブレイクアウトがより高い確率の結果となるゾーンに価格が到達した時にのみ展開します。 運用方法 私の執行フレームワークは3つの原則に基づいています: トレンドが第一。構造が第二。リスクは常に。 まず、上位時間軸の構造から支配的な市場方向を読みます。方向が不明確なら、ポジションを取りません。 次に、継続圧力が最も強い価格ゾーンを見つけます。ノイズには飛び込
Volume Pressure Meter breakdown tick volume to reveal the buying and selling pressure inside every candle. Unlike standard volume which only shows total activity, this indicator splits volume to show who is actually in control of the market. It helps you identify trend strength and spot potential reversals through volume divergence. Key Features: Pressure Gauge: Visual bar showing real-time Buy vs Sell percentages. Trend Bias: Automatically identifies if the market is dominated by Buyers or Sell
FREE
Smart Session Box Displays Asia, London, and New York trading sessions with automatic timezone adjustment and session overlap highlighting. Main Features Complete session analysis with no limitations. Key Features The indicator draws session boxes with high and low lines for each trading session. Session overlaps are highlighted with distinct colors to identify high liquidity periods. Breakout alerts notify when price crosses previous session levels. A control panel provides quick toggles for al
FREE
負けているのは戦略のせいではない タイミングのせいだ 直近10回の負けトレードを思い出してくれ。そのうちの何回が「タイミングが悪い」ことが原因だったか まさに相場が圧縮されているとき、保合いで方向感がないとき、あるいはすでに値動きが尽きたときに入っていなかったか?多くのトレーダーは悪くない戦略を持っている。チャートの読み方もできる。サポートやレジスタンスの概念も理解している。それでも負け続けるのは、相場の状態に関係なく同じ戦略を使い続けているからだ まるで全てのローソク足が同じエネルギーを持つかのように。 実際にはそうではない。そしてそのことは、あなた自身が一番よくわかっているはずだ。 相場は呼吸する。周期的に動く。圧縮し、拡大し、トレンドを形成し、休息する。 Volatility Helix Engine は、相場が今どの状態にあるのかをチャート上にリアルタイムで表示するインジケーターだ。これにより、あなたは勘に頼ったトレードをやめ、コンテキストを持ったトレードを始めることができる。 全ての相場が繰り返す4つの隠れたフェーズ あらゆる銘柄、あらゆるタイムフレーム
FREE
Confluence Bias Map Analyzing multiple indicators across different timeframes often leads to conflicting signals, causing traders to enter too late or hesitate during critical market moves. This inconsistency occurs because individual tools like moving averages, oscillators, and volume meters are monitored in isolation, lacking a unified perspective. Confluence Bias Map solves this by aggregating trend, momentum, volatility, and volume indicators into a single, real-time score (0 to 100) display
FREE
Session and Cycle Zone Mapper Session and Cycle Zone Mapper displays the Asian, London, and New York trading sessions directly on your MetaTrader 5 chart. Each session is drawn as a colored box showing the high, low, and pip range. The indicator also plots the Asian range as extended key levels, marks previous day high and low, and includes a 24-hour volatility heatmap. Session countdown timers and a dashboard panel keep you oriented within the trading day without switching timeframes or openin
FREE
大きなボディを持つローソク足が確定。ブレイクアウトのように見える。エントリー。 次のバーが反転し、ストップアウト。出来高は平均的で、モメンタムはすでに衰えていた。 Impulse Momentum Shift は真のインパルスを持つバーを識別し、そのインパルスが反転する瞬間をマークします。 多くのトレーダーはローソク足のサイズだけを見ます。しかし本物のインパルスには3つの要素が必要です:ボディの支配性、直近平均を上回る出来高スパイク、そしてATRで正規化された方向性モメンタム。 このインジケーターは3次元すべてで各バーをスコアリングし、5色のインパルスカラースケールでチャートをペイントし、強いインパルスフェーズが方向を反転させた瞬間にシフト矢印を配置します——確定済みバーのみ。 表示内容: 5色インパルスキャンドル: 強い強気インパルスはブライトブルー、中程度はライトブルー、中立はグレー、中程度の弱気はコーラル、強い弱気はクリムゾン。各バーはリアルタイムで0〜100のスコアを取得 Impulse Trail ライン: ATRベースの動的ラインで、支配的なインパルス方向にラチェット式に追
FREE
Murrey Math Channels Identifying key market reversal points and core trading ranges can be challenging. Traditional analysis often lacks clear mathematical structure, leading to inconsistent entries. Murrey Math Channels provides a mathematically grounded price framework based on the Law of Octaves to help traders define precise support, resistance, and reversal zones. How to Read the Chart: The indicator divides the price action into 8 main octaves (levels), each representing a different marke
FREE
Price breaks out. You want the continuation, but the entry usually comes too early, too late, or directly into a weak pullback. Without structure, most traders can see the move but still cannot define where the retracement remains healthy and where the setup starts to fail. Pullback Execution Map turns the current swing into a visual execution plan on the chart and a pullback meter below price. What it shows: Fibonacci execution pocket: Maps the active swing with a clear pullback pocket from the
FREE
Volume Pressure Meter MT5 ローソク足は強く見えた。出来高は高く見えた。ブレイクアウトでエントリーした。 数分で価格が反転した。その動きには真の参加がなかった。 Volume Pressure Meterは機関投資家が見ているものを明らかにする:価格の動きの背後に実際の買い圧力または売り圧力が存在するか、それとも空虚な出来高に対してトレードしているか。 M5からH4のタイムフレームでゴールド(XAUUSD)、インデックス、主要外国為替ペアを分析するイントラデイおよびスイングトレーダー向けに設計されています。8つの機関レベルの出来高分析ツールを、AIパターン認識とリアルタイム確率計算を備えた1つの統合システムに融合しています。 表示内容 HUD(ヘッドアップディスプレイ)インターフェース: シグナルステータス: 現在の市場推奨(BUY、SELL、WAIT、AVOID)をリアルタイムで更新 圧力バランスゲージ: 買い手と売り手の参加を色分けされた強度で視覚的に表現 シグナルスコア: 複数の出来高確認要素に基づく0から10までの強度評価 勝率確率: 現在の条件と過去の
Smart Entry Levels - Fractal and ATR Based Indicator Smart Entry Levels identifies key support and resistance zones using classical fractal detection and ATR-based volatility measurement. The indicator is designed for clarity, stability, and compliance with MQL5 Market rules. Features Upper Zone - Resistance area based on recent fractal highs Lower Zone - Support area based on recent fractal lows ATR-based sizing - Zones adapt dynamically to market volatility with selectable timeframe Non-repain
FREE
Smart Confluence Radar 3つの指標を個別に分析してコンフルエンスを見つけるには時間がかかります。マルチタイムフレームのオーバーレイ、アラート、セッションフィルターについては、 Smart Confluence Radar Advanced をご覧ください。 Smart Confluence Radar は、ATR 拡張、出来高モメンタム、変化率を1つの視覚的なレイヤーにまとめ、ローソク足に直接重ねて表示します。 表示内容: 色付きローソク足: 明るい色 = 高コンフルエンス(スコア ≥70)。薄い色 = 中。グレー = 低モメンタム。 モメンタムライン: チャートに描画。青 = 買い圧力、赤 = 売り圧力、グレー = 中立。 バーラベル(+/-): 高コンフルエンスの確定バーのみ表示。上昇バーの下に "+"、下降バーの上に "-"。 バーカウントダウン: 右上 — 現在の時間足と残り秒数。 適用場面: ゴールド(XAUUSD)、主要通貨ペア、指数の日中取引。M5〜H4。 このツールができないこと: 売買シグナルを自動生成しません。 将来の価格動向を予測しません。
FREE
Keltner Breakout Caught in market chop. Fake breakouts trigger unwanted trades. Because standard indicators lack dynamic volatility context. This utility automatically combines a Dynamic Volatility Channel, Dual MA trend detection, and RSI momentum filtering into one visual system. Key Features: Trend Cloud: Visually fills the trend zone with a dynamic Keltner-style volatility channel. Multi-Factor Breakout: Only issues a signal when price breaks the volatility channel AND trend/momentum confirm
FREE
Parabolic Trend Corridor Identifying trend direction and volatility boundaries is a common challenge for day traders. Standard indicators often lack a holistic view of both trend structure and market noise. Parabolic Trend Corridor solves this by combining the adaptive nature of Parabolic SAR with dynamic ATR volatility bands. Key Features: Adaptive Trend Core: Uses Parabolic SAR as the foundation to follow price movement and volatility changes without lag. Dual-Color Cloud: Dynamic visual feedb
FREE
ターミナルを開きます。3つのポジションが動いています。チャートが動いています。 しかし、ロンドンは今本当にアクティブですか?それともニューヨーク前のノイズですか? Session Pulse Monitorは、取引セッションのリアルタイムステータス、ボラティリティコンテキスト、各ポジションのエントリーセッションをチャート上に直接表示します。 複数のセッションにまたがってポジションを管理し、市場に機関投資家の参加があるかを知る必要があるトレーダー向けに設計されています。 すべてのシンボルで動作 — ゴールド(XAUUSD)、主要FX通貨ペア、インデックスに最適化。 表示内容: リアルタイムセッションステータス: アジア、ロンドン、ニューヨークのLIVE/カウントダウン表示。 ボラティリティコンテキスト: 各セッションの過去のボラティリティ状態(HIGH / MED / LOW)を表示。 トレードタギング: 各オープンポジションにエントリーセッション(アジア、ロンドン、ニューヨーク、重複)を表示。 セッションカウントダウン: アクティブセッションの残り時間と次のセッションの開始時間。 この
FREE
You read the breakout correctly. Price pushed through the level. You entered. Then it reversed — and stopped you out before the real move happened. GoldStructure Pro identifies that pattern before you enter, not after. Gold fakes breakouts constantly. A candle closes above resistance, volume looks right, structure seems clear — then price snaps back and hunts your stop. Most indicators cannot separate a confirmed expansion from a liquidity sweep. GoldStructure Pro classifies every breakout in re
良いセットアップ。間違った市場状態。トレードは実行される前に無効になる。 広いスプレッド、セッション外の時間帯、ボラティリティの急騰、高インパクトニュースへの近接——すべてが実行前にエッジを破壊する。 Market Bias Monitor はライブ環境を分類し、実行品質を0から100でスコアリングし、条件が変化した瞬間に通知します。 ゴールド(XAUUSD)、Forex通貨ペア、インデックスをM5からW1のタイムフレームで分析する裁量および半自動トレーダー向けに設計されています。レジーム、セッション、スプレッド、ニュースリスク、マルチタイムフレームバイアスのアラインメントをリアルタイムで監視します。 何を表示するか: 市場レジーム分類: ATRボラティリティと移動平均からの価格偏差を使用してTREND、RANGE、TRANSITION、またはHIGH RISKを識別——不安定なレジーム中の実行を回避するために。 Market Quality Score(0-100): レジーム、スプレッド、ボラティリティ、セッション、バイアスの明瞭度、ニュース近接度からの複合スコア——条件を客観的に
SMC Liquidity Channel Guard Premium レジスタンスを上抜けブレイクアウト。ストップロスはすぐ下に設置。 価格は即座に反転——本当の動きが始まる前にリテールのエントリーを罠にかける流動性スイープ。 SMC Liquidity Channel Guard Premiumは、機関投資家の流動性プールをリアルタイムでマッピングし、方向性トレンドロジックでスイープをフィルタリングし、マルチタイムフレームのコンテキストで確認済みセットアップを提供します。 ゴールド(XAUUSD)、インデックス、主要FXペアをM5からD1で分析するSmart Money Conceptトレーダー向けに設計。構造的流動性境界における機関投資家のストップハント行動の特定に最適化。 表示内容: ダイナミック流動性チャネル: バイサイド(BSL)とセルサイド(SSL)の境界をマッピング——ストップロスクラスターの蓄積場所を確認 機関スイープ検出: 価格が流動性プールを突破してもチャネル内で引ける場合を特定——ストップハント反転を発見 高確信シグナル: スイープがトレンドフィルターと一致した
活発に見える市場で取引を開始。しかしセッション終了まで残り12分。 流動性が低下し、スプレッドが拡大。ポジションは方向感なく漂う。 Session Pulse Monitor Advancedはリアルタイムのセッション分析を提供 — ライブ状態、過去のパフォーマンス統計、チャート上のビジュアルゾーン、ATR予測、セッション切替アラート — 常にどのセッションで取引しているかを把握できます。 アジア、ロンドン、ニューヨークセッションでポジションを管理するトレーダー向けに設計。単なる時計以上の機能を提供。 全シンボルに対応 — ゴールド(XAUUSD)、主要FX通貨ペア、セッション切替時に最も大きな価格変動が生じるインデックスに最適化。 主な機能: リアルタイムセッションパネル: アジア、ロンドン、ニューヨークセッションのLIVE/カウントダウン表示。ティックごとに更新。 セッション別パフォーマンス統計: セッションごとの勝率、平均損益、取引数 — 30日間の口座履歴から算出。どのセッションが戦略に合っているかを把握。 セッションハイライトゾーン: 過去5日間の各セッションにカラーコード付
構造は確認済み。オーダーブロックも一致。ブレイクアウトでエントリーした。 価格は40pips反転した。プレミアムゾーン、FVGのサポートなし、キルゾーン時間外だったことを見逃していた。 3つの要素が「ノー」と言っていた。確認したのは1つだけだった。 SMC Confluence Score MT5 は8つの機関投資家分析レイヤーを同時にスキャンし、ブル/ベアのコンフルエンススコア(0-10)をリアルタイムで出力します。 インジケーターやタイムフレームを切り替える代わりに、トレード前にすべてのSMC要素を1つのパネルで確認できます。 表示内容: コンフルエンススコア (0-10): OB、FVG、構造、ゾーン、セッション、流動性、HTF方向を1つの数値に統合。セットアップの質を一目で把握。 市場構造 (BOS + CHoCH): スイングと内部レベルの検出。エントリー前にトレンド転換を確認。 強度評価付きオーダーブロック: 未消化OBの出来高ベース強度インジケーター。機関がポジションを置いているゾーンを優先。 フェアバリューギャップ (FVG): ATRフィルター済みの不均衡のみ。ノイズ
Many pullbacks look tradable for a moment, but the expensive mistake comes from treating every retracement as equal. The real workflow problem is deciding whether the pullback is still worth your attention, whether it is only building, or whether it should be ignored completely. Pullback Execution Map Confluence is built as a decision-first pullback engine: it separates WAIT, BUILD, READY and AVOID conditions before it draws a full execution plan. What this version adds: Decision states instead
Liquidity Trap Confirmation 活発なデイトレード時間帯では、価格が明確な流動性ポイントを先に取りに行き、その後セットアップが本当に整う前に反転することがあります。 Liquidity Trap Confirmation は、より多くのシグナルを求めるのではなく、質の低いエントリーを減らしたい裁量トレーダー向けの バークローズ確認ツールです。流動性、構造、ディスプレイスメント、ボラティリティ、市場コンテキストを評価し、 そのセットアップを監視すべきか、準備すべきか、確認済みか、無効か、見送るべきかを示します。 表示内容 アクティブな流動性ゾーンと、そのライフサイクルをチャート上に表示します。 NO TRADE、WATCH、ARMED、CONFIRMED、INVALID の状態を表示します。 構造、ディスプレイスメント、ボラティリティ、コンテキストを組み合わせた確認ロジックを提供します。 信頼度、invalidaiton、アクティブプロファイル、リスクゲート、次の行動を示す判断パネルを表示します。 CONFIRMED と INVALID のアラートに加え、コンテキ
Confluence Bias Map Multi TF Reading six timeframes at once from separate charts takes time — and by the time you align them all, the setup is already gone. Signals conflict because each timeframe tells a different story with no way to combine them into a single, objective view. Confluence Bias Map Multi TF scans up to six fully customizable timeframes simultaneously, aggregates trend, momentum, volatility, and volume data into a single weighted score (0 to 100), and displays it on one interacti
コンテキストなしでトレードする感覚を、あなたはもう知っている あなたはすべて正しくやった。チャートを研究し、プライスアクションを学び、戦略を見つけた——紙の上ではうまくいく戦略を。しかし、ライブトレードに座ると、何かがいつも間違う。ブレイクアウトに入ったと思ったらフェイクアウトだった。トレンドがすでに終わった後もポジションを持ち続けた。レンジで何時間も小損失を繰り返し、動きが来るのを待った——そしてそれはあなたがクローズした5分後に来た。 これは戦略の問題ではない。あなたは悪いトレーダーではない。あなたは間違ったフェーズでトレードしているのだ。 Volatility Helix Engine Advanced は、市場の隠された状態を明らかにする完全なボラティリティインテリジェンスシステムです。1ドルをリスクにさらす前に、自分がどのような市場に立っているかを常に把握できます。未来を予測するのではありません。より価値のあることをします:今何が起きているか、市場がどのフェーズに入ったか、どれほどのエネルギーが蓄積されているか、そしてそのエネルギーがいつ解放されようとしているかを表示します
Session And Kill Zone Mapper Session And Kill Zone Mapper is a session indicator for MetaTrader 5 built around the session-based framework that many intraday traders follow. It draws colored session boxes for the Asian, London, and New York sessions, each displaying its pip range and countdown timer. It marks the Asian session range and tracks price breakouts beyond it. It plots previous day, week, and month high and low levels. It calculates per-session VWAP with standard deviation bands. It i
Gold XAU/USD Entropy Confluence Matrix A quantitative market structure indicator for gold and XAU/USD analysis. This indicator integrates Shannon entropy, Hurst exponent, momentum quality, and volatility regime detection into a unified confluence framework. It provides continuous assessment of gold market state to support trading decisions across all timeframes. The indicator is designed for traders who analyze gold price behavior using information theory and fractal geometry. Each analytical co
フィルタ:
レビューなし
レビューに返信