SMC Confluence Score MT5

構造は確認済み。オーダーブロックも一致。ブレイクアウトでエントリーした。
価格は40pips反転した。プレミアムゾーン、FVGのサポートなし、キルゾーン時間外だったことを見逃していた。
3つの要素が「ノー」と言っていた。確認したのは1つだけだった。

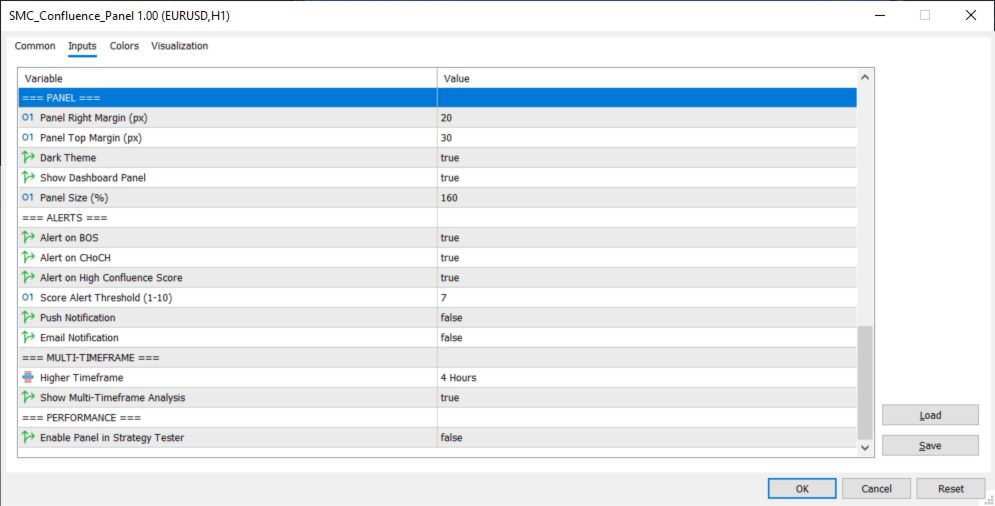
SMC Confluence Score MT5は8つの機関投資家分析レイヤーを同時にスキャンし、ブル/ベアのコンフルエンススコア(0-10)をリアルタイムで出力します。
インジケーターやタイムフレームを切り替える代わりに、トレード前にすべてのSMC要素を1つのパネルで確認できます。

表示内容:

  • コンフルエンススコア (0-10): OB、FVG、構造、ゾーン、セッション、流動性、HTF方向を1つの数値に統合。セットアップの質を一目で把握。
  • 市場構造 (BOS + CHoCH): スイングと内部レベルの検出。エントリー前にトレンド転換を確認。
  • 強度評価付きオーダーブロック: 未消化OBの出来高ベース強度インジケーター。機関がポジションを置いているゾーンを優先。
  • フェアバリューギャップ (FVG): ATRフィルター済みの不均衡のみ。ノイズを除外し実質的なギャップのみ表示。
  • Equal Highs / Equal Lows: 流動性プールの検出。ストップ狩りを事前に予測。
  • プレミアム / ディスカウントゾーン: 50%均衡に対する現在価格の位置。高値買い・安値売りを回避。
  • キルゾーンセッション: アジア、ロンドン、NY、ロンドンクローズをカウントダウン付きで表示。機関活動時間帯のみトレード。
  • マルチタイムフレームタブ: M15、H1、H4、D1の方向を1パネルで表示。チャート切替なしで主要フローに合わせる。

他のSMCインジケーターとの違い:

ほとんどのSMCインジケーターはオーダーブロック、FVG、構造線を個別に表示します。
このパネルはすべてを1つのスコアに統合。7+は複数要素の一致。9+は高コンフルエンス。
どのセットアップが強いか推測する必要はありません。スコアが教えてくれます。

シグナルの安定性:
リペイントなし。構造検出はバー確定時に固定。バックテストの表示がライブと一致。

アラートシステム:

  • 構造アラート: BOS・CHoCHイベントをリアルタイム通知。
  • 高スコアアラート: コンフルエンスが設定閾値を超えた時にトリガー。
  • OBエントリーアラート: 価格が未消化オーダーブロックに到達。
  • キルゾーンアラート: セッションウィンドウ開始時に通知。

ポップアップ、プッシュ通知、メール対応。

行わないこと:

自動売買シグナルの生成やトレード執行は行いません。
価格方向の確実な予測は行いません。
トレード戦略やリスク管理の代替にはなりません。
コンフルエンスを評価し、あなたの判断をサポートします。

対応: 全銘柄・全タイムフレーム。FX、ゴールド(XAUUSD)、指数、暗号資産。スイング、デイトレ、スキャルピング。

設定: チャートに1つ添付するだけ。デフォルト設定で即使用可能。Canvas描画パネル、ダーク/ライトテーマ、ドラッグ移動、DPI対応。MT5専用。

8つの分析レイヤー。1つのコンフルエンススコア。SMCを理解しているが、全体像を1か所で確認したいトレーダーのために設計。

おすすめのプロダクト
RAD CRITICAL LEVES RAD indicator tracks “Relevant Volume” in real time, identifying accumulation and distribution processes, projecting them in the chart as SUPPORT or RESISTANCE zones. Natural   support   and resistance levels are generated by Volume Accumulation and Distribution processes. As these processes evolve, levels at which the relevant volume in the market place is positioned, become difficult areas to cross upwards or downwards. By using this information, traders can identify very s
Crypto_Forex MT5用インジケーター「トレンドエントリーヒストグラム」、リペイント機能なし。 - トレンドエントリーヒストグラムインジケーターは、Entry_barが表示された後、トレンド方向へのエントリーシグナルを探すのに使用できます。 - このインジケーターのユニークな特徴は、価格と出来高の両方を計算に用いることです。 - トレンドエントリーヒストグラムは2色で表示されます。弱気トレンドの場合は赤、強気トレンドの場合は青です。 - 安定したトレンドを確認したら(同じ色のヒストグラムバーが最低10本連続して表示される)、Entry_barを待ちます。 - エントリーシグナルは、ヒストグラム上で反対色の列と、最初のトレンド色の列です(図を参照)。 - ショートターゲットを使用 - 現在のトレンドに応じて、チャート上の最も近い高値/安値。 - インジケーターにはモバイルとPCのアラートが組み込まれています。 インジケーターの使い方: - 買いシグナルの場合:継続的な強気トレンド(青いヒストグラムバー)+ ヒストグラム上の赤いバー1本 + 青いバー1本(ここでロングトレー
The  Market Sessions Indicator for MT5 helps you  predict market turnarounds  by detecting major supply and demand areas. These pivot points tend to occur after a new session has started and the previous one is still open. It is also used to gauge how many points or pips the market moves on average during a session. This helps us to place better our take profits and stop losses. The indicator works on all forex pairs, gold, silver, commodities, stocks, indices and any other instrument that your
Volume Profile for MetaTrader 5 Price movement alone does not explain where the market is actually traded . What matters is where volume is built and how these areas shift over time. This Volume Profile displays the volume distribution directly on the chart , making it clear which price levels were accepted by the market and where rejection occurred. This allows structurally relevant zones to be identified and integrated into individual decision-making processes. The tool is designed for high pe
Adjustable Consecutive Fractals  looks for 2 or more fractals in one direction and sends out a on screen alert, sound alert and push notification, for strong reversal points . Adjustable Consecutive Fractals, shows the fractals on chart along with a color changing text for buy and sell signals when one or more fractals appear on one side of price. Adjustable Consecutive Fractals is based Bill Williams Fractals . The standard Bill Williams fractals are set at a non adjustable 5 bars, BUT withe th
Phantom Edge SMC — The Ultimate Smart Money Indicator for MT5 Tired of manually drawing structures while trading SMC or ICT concepts? Let Phantom Edge SMC do the heavy lifting for you. Key Features Internal & Swing Structure: Automatically detects BOS and CHoCH across two structural levels. Order Blocks (OB): Identifies Internal and Swing OBs with automated mitigation tracking. Equal Highs / Lows: Highlights EQH / EQL to pinpoint Liquidity pools. Fair Value Gaps (FVG): Displays FVGs with
Range Directional Force Indicator – Designed for You to Optimize! The Range Directional Force Indicator is a cutting-edge tool designed to empower traders by visualizing market dynamics and directional strength. Built to offer insights into market trends and reversals, this indicator is an invaluable asset for traders seeking precision in their strategies. However, it is important to note that this indicator is not optimized, leaving room for you to tailor it to your unique trading preferences.
WolfSight AI
Marius Ovidiu Sunzuiana
The WolfSight AI  is a next‑generation market analyzer built for traders who demand speed, clarity, and institutional‑grade intelligence. Powered by a multi‑layer AI decision framework, this indicator evaluates market conditions in real time and transforms them into clear BUY, SELL, or WAIT signals — all displayed through a sleek, interactive panel. This system doesn’t rely on simple crossovers or retail‑grade formulas. Instead, it uses a proprietary AI‑inspired scoring model that processes mul
Manyal trading system, CovEchoTrend Robot, focuses on reliability and flexibility. By employing statistical analysis methods to study the relationships between the base indicator and market patterns, the system enables a deeper understanding of market processes. Intelligent pattern analysis: The application of statistical data processing helps identify key trend reversal points more accurately, signaling significant market shifts. Informed decision-making is based on the intersection of indicato
The indicator determines the state of the market: trend or flat. The state of the market is determined by taking into account volatility. The flat (trading corridor)is displayed in yellow. The green color shows the upward trend. The red color shows the downward trend. The height of the label corresponds to the volatility in the market. The indicator does not redraw . Settings History_Size   - the amount of history for calculation. Period_Candles  - the number of candles to calculate the indicat
Turn your chart into a professional trading dashboard that shows where price is flowing and when the next shock is coming —without loading a single extra window. This indicator combines a price-following MA ribbon with a live news radar directly on the chart, giving you both trend and event risk in one glance. Trend Ribbon – Read the market bias instantly A smooth, step-style moving average ribbon follows price action bar by bar. Color change shows the active trend: aqua for bullish flow , gold
Introduction The Wave Trend Oscillator Indicator for MT5 is one of the well known indicators in the market, helping traders find strong entry points into the market. Like any other MetaTrader 5 indicator , it can produce both good and bad signals, but the number of accurate buy/sell signals is significantly higher than the weak ones. This makes it a powerful tool for improving your forex trading strategy , whether you are a beginner or an advanced trader. How does this indicator work? This indic
This product is designed for the MT5 platform and offers two key features: VWAP (Volume Weighted Average Price) calculation and Volume Profile analysis. Advantages: VWAP Calculation: The product calculates the VWAP, which is a popular indicator used by traders to determine the average price of a security based on its trading volume. It helps identify potential buying or selling opportunities by comparing the current price to the average price weighted by volume. Volume Profile Analysis: The prod
BTMM State Engine Pro is a MetaTrader 5 indicator for traders who use the Beat The Market Maker approach: Asian session context, kill zone timing, level progression, peak formation detection, and a multi-pair scanner from a single chart. It combines cycle state logic with a built-in scanner dashboard so you do not need the same tool on many charts at once. What it does Draws the Asian session range; session times can follow broker server offset or be set in inputs. Tracks level progression (L
The  Market Sessions Indicator for MT5 helps you  predict market turnarounds  by detecting major supply and demand areas. These pivot points tend to occur after a new session has started and the previous one is still open. It is also used to gauge how many points or pips the market moves on average during a session. This helps us to place better our take profits and stop losses. The indicator works on all forex pairs, gold, silver, commodities, stocks, indices and any other instrument that you
Indicator of trend deviation with a static level. The deviation coefficient is set for the trend histogram. Signals are the intersection of the level trend histogram in the direction of the trend or during a trend reversal - the option is selected in the indicator settings by the "Revers" parameter. There are all the necessary settings for the design of the indication and sending messages to mail or a mobile terminal. All input parameters have an intuitive name. Analog for MT4: https://www.mql5.
An invention that will turn your working principles upside down. Especially in horizontal and stagnant markets, annoying losses can occur. Besides, following trend lines, support and resistance can be tiring. To put an end to all this, I decided to create a professional "moving average" indicator. All you have to do is follow the colors. If you need additional support, I recommend the "Heiken-Ashi" candle indicator in my profile. I wish you lots of profit..
Limitless MT5 is a universal indicator suitable for every beginner and experienced trader. works on all currency pairs, cryptocurrencies, raw stocks Limitless MT5 - already configured and does not require additional configuration And now the main thing Why Limitless MT5? 1 complete lack of redrawing 2 two years of testing by the best specialists in trading 3 the accuracy of correct signals exceeds 80% 4 performed well in trading during news releases Trading rules 1 buy signal - the ap
All 11 indicators quickly turn off and turn on quickly! Set of indicators: 2 indicators "TREND"   : - fast = line 4 colors - slow = dots 4 colors The coloring of the indicators depends on the direction of the trend and the RSI indicator: 1) uptrend and RSI<50% 2) uptrend and RSI>50% 3) downtrend RSI<50% 4) downtrend RSI   >   50% Set indicator periods for each timeframe: M5 M10 M15 M30 H1 H2 H4 H6 H12 D1 W1 MN Do not enter trades if at least 1 of the indicators is horizontal. For a trade,
「調整可能なフラクタル」はフラクタル インジケーターの高度なバージョンで、非常に便利なトレーディング ツールです。 - ご存知のとおり、標準フラクタル MT5  インジケーターには設定がまったくありません。これはトレーダーにとって非常に不便です。 - 調整可能なフラクタルは、この問題を解決しました。必要な設定がすべて揃っています。 - インジケーターの調整可能な期間 (推奨値 - 7 以上)。 - 価格の高値/安値からの距離を調整可能。 - フラクタル矢印のデザインを調整可能。 - インジケーターにはモバイルおよび PC アラートが組み込まれています。 高品質のトレーディングロボットとインジケーターをご覧になるにはここをクリックしてください! これは、この MQL5 Web サイトでのみ提供されるオリジナル製品です。
Do you use volume in your reading of the market? Certainly many traders use it, and do not imagine operating without it. The Color Histogram Volume Set indicator allows the user to choose the value that he considers interesting to monitor. When you pass this you will have visual confirmation and if you want you will also have the audible alert that is given by the indicator. Of course, there are other ways to try to find a high volume, such as assessing whether the volume is above av
SMC Institutional Pro HERE – Advanced ICT/SMC Market Structure Tool (MT5 HERE Trade with institutional precision. Eliminate retail noise. SMC Institutional Pro is a high-performance MetaTrader 5 indicator engineered for traders who follow ICT (Inner Circle Trader) and Smart Money Concepts (SMC) . It automates the identification of key institutional footprints—giving you a structured, data-driven view of price action. ️ CORE FEATURES Smart Fair Value Gap (FVG) Detection Auto-identifies bullis
回帰取引を意味する専門的かつ定量的なアプローチを実装する独自の指標。これは、価格が予測可能かつ測定可能な方法で迂回して平均に戻るという事実を利用しており、非定量的な取引戦略を大幅に上回る明確な出入りルールを可能にします。 [ Installation Guide | Update Guide | Troubleshooting | FAQ | All Products ] 明確な取引シグナル 驚くほど簡単に取引できます カスタマイズ可能な色とサイズ パフォーマンス統計を実装します ほとんどの取引戦略を上回ります 適切なSLおよびTPレベルを表示します 電子メール/音声/視覚アラートを実装します 使い方 インディケータは、より高い時間枠からの完全にカスタマイズ可能な移動平均の周りの標準偏差を測定し、トレンドフォローアプローチを使用して正確に取引を見つけます。取引は、現在のチャートの価格アクションに飛び込むことによって見つけられ、価格が選択したより高い時間枠から計算された平均価格帯に戻ったときに閉じられます。それがコード化される方法のために、指標は高ボラティリティと強いトレンドの市場か
Global Market Risk Sentiment Meter 1. Overview The Global Market Risk Sentiment Meter is an analytical indicator designed for the MetaTrader 5 (MQL5) platform. It employs an Inter-Market Analysis approach to assess the aggregate data of specific global financial markets. By evaluating real-time price changes across US Indices, Global Equities, Cryptocurrencies, and historical Safe Haven assets (Gold and the US Dollar Index), the indicator calculates a composite sentiment score. This data is vis
FREE
The Tik Tok indicator was created on the basis of the original extreme search indicators, the indicator is well suited for determining a reversal or a big sharp jerk in one direction, thanks to it you will know when this happens it will notify you when a blue dot for buying red for sale appears. It basically uses the process of detecting the rate of change in price growth and allows you to find entry and exit points from the market. fundamental technical indicator that allows you to assess the
Matrix Currency – Multi-Timeframe Analysis Tool The Matrix Currency is an advanced indicator designed to analyze currency strength in the Forex market. It provides efficient monitoring and strategic support for traders seeking clear and actionable insights. Key Features Multi-Timeframe Analysis : Simultaneously monitors multiple timeframes (from M1 to MN1) with real-time updates, displayed in an intuitive matrix format. Alert System : Customizable notifications via pop-up, email, and mobile devi
FREE
Was: $249  Now: $99   Market Profile defines a number of day types that can help the trader to determine market behaviour. A key feature is the Value Area, representing the range of price action where 70% of trading took place. Understanding the Value Area can give traders valuable insight into market direction and establish the higher odds trade. It is an excellent addition to any system you may be using. Inspired by Jim Dalton’s book “Mind Over Markets”, this indicator is designed to suit the
Liquidity Sniper QQE Merge Liquidity Sniper QQE Merge is a technical analysis indicator for MetaTrader 5 designed to combine price level detection with momentum filtering. The indicator identifies potential price levels based on pivot structures and evaluates market conditions using a smoothed momentum calculation. Signals are generated when both price structure and momentum criteria are satisfied. It provides a visual representation of levels and signals directly on the chart. Main features: P
VWAP Z-Score (Rolling) Positive values indicate price trading above VWAP, while negative values indicate price trading below VWAP. Typical Use Cases Mean-reversion strategies Overbought / oversold detection VWAP-based statistical analysis Confirmation tool for discretionary or algorithmic trading Risk-aware trade entries and exits Notes Uses tick volume for VWAP weighting (standard for Forex symbols). The indicator does not repaint. Designed for analytical and decision-support purposes only.
The indicator is the advanced form of the MetaTrader 4 standard Fibonacci tool. It is unique and very reasonable for serious Fibonacci traders. Key Features Drawing of Fibonacci retracement and expansion levels in a few seconds by using hotkeys. Auto adjusting of retracement levels once the market makes new highs/lows. Ability to edit/remove any retracement & expansion levels on chart. Auto snap to exact high and low of bars while plotting on chart. Getting very clear charts even though many ret
このプロダクトを購入した人は以下も購入しています
ARIPoint is a powerful trading companion designed to generate high-probability entry signals with dynamic TP/SL/DP levels based on volatility. Built-in performance tracking shows win/loss stats, PP1/PP2 hits, and success rates all updated live. Key Features: Buy/Sell signals with adaptive volatility bands Real-time TP/SL/DP levels based on ATR Built-in MA Filter with optional ATR/StdDev volatility Performance stats panel (Success, Profit/Loss, PP1/PP2) Alerts via popup, sound, push, or email Cu
このインジケーターを購入された方には、以下の特典を 無料 で提供しています: 各トレードを自動で管理し、ストップロスとテイクプロフィットを設定し、戦略ルールに基づいてポジションを決済する補助ツール 「Bomber Utility」 様々な銘柄に合わせたインジケーターの設定ファイル(セットファイル) 「最小リスク」、「バランスリスク」、「待機戦略」 の3つのモードで使用できる Bomber Utility 用の設定ファイル このトレーディング戦略をすぐに導入・設定・開始できる ステップバイステップのビデオマニュアル ご注意: 上記の特典を受け取るには、MQL5のプライベートメッセージシステムを通じて販売者にご連絡ください。 オリジナルのカスタムインジケーター 「Divergence Bomber(ダイバージェンス・ボンバー)」 をご紹介します。これは、MACDのダイバージェンス(乖離)戦略に基づいた 「オールインワン」型のトレーディングシステム です。 このテクニカルインジケーターの主な目的は、価格とMACDインジケーターの間に発生するダイバージェンスを検出 し、将来の価格の動きを示す
SignalTech MT5 is an unique fully rule based trading system for EURUSD, USDCHF, USDJPY, AUDUSD, NZDUSD, EURJPY, AUDJPY, NZDJPY, CADJPY.  All the winning trades with chart setups are published on the comments page. 2026-05 2802 Pips (Until 05-15 NY Closed) 2026-04 2243 Pips 2026-03 2165 Pips 2026-02 2937 Pips 2026-01 2624 Pips 2025-12 1174 Pips It can generate signals with Buy/Sell Arrows and Pop-Up/Sound Alerts. Each signal has clear Entry and Stop Loss levels, which should be automatically flag
Power Candles V3 - 自己最適化型強弱インジケーター Power Candles V3は 、通貨や銘柄の強さを、適用されたすべてのチャート上で実行可能なトレードプランに変換します。単にローソク足を色分けするだけでなく、バックグラウンドでリアルタイムの自動最適化を実行し、目の前の銘柄に対して最適なストップロス、テイクプロフィット、およびシグナルの閾値を提示します。ワンクリックで実取引に適用でき、エントリーポイント、ストップロス、テイクプロフィットのラインが正確な価格位置にチャート上に表示され、方向性を示すアラートがリアルタイムで発動します。 このツールは、Stein Investmentsのエコシステムの一部です。  18種類以上のツールをすべて閲覧し、AIを活用したセットアップの推奨事項を入手し、  https://stein.investments でコミュニティに参加しましょう クローズしたバーごとに3,000回以上のトレードシミュレーション。9つの強さの状態。2つの戦略を並行してテスト。勝率の高い設定をワンクリックで適用。 なぜこれが必要なのか ほとんどの強
このインジケーターを購入すると、プロ仕様のトレードマネージャーを無料で差し上げます。 まず第一に、このトレーディングシステムがノンリペイント、ノンリドロー、ノンラグのインジケーターであることを強調する価値がある。これにより、手動取引とロボット取引の両方に理想的なものになっています。 オンラインコース、マニュアル、プリセットのダウンロード。 「スマートトレンドトレーディングシステム MT5」は、新規および経験豊富なトレーダー向けにカスタマイズされた包括的なトレーディングソリューションです。10以上のプレミアムインジケーターを組み合わせ、7つ以上の堅実なトレーディング戦略を備えており、多様な市場状況に対応する多目的な選択肢となっています。 トレンドフォロー戦略:トレンドを効果的に乗り越えるための正確なエントリーとストップロス管理を提供します。 リバーサル戦略:潜在的なトレンドの反転を特定し、トレーダーがレンジ相場を活用できるようにします。 スキャルピング戦略:高速で正確なデイトレードおよび短期取引のために設計されています。 安定性:すべてのインジケーターはノンリペイント、ノンリドロー、ノ
ご紹介     Quantum Breakout PRO は 、ブレイクアウト ゾーンの取引方法を変革する画期的な MQL5 インジケーターです。 13年以上の取引経験を持つ経験豊富なトレーダーのチームによって開発されました。     クォンタム ブレイクアウト プロ   は、革新的でダイナミックなブレイクアウト ゾーン戦略により、あなたのトレーディングの旅を新たな高みに押し上げるように設計されています。 クォンタム ブレイクアウト インジケーターは、5 つの利益ターゲット ゾーンを備えたブレイクアウト ゾーン上のシグナル矢印と、ブレイクアウト ボックスに基づいたストップロスの提案を提供します。 初心者トレーダーにもプロのトレーダーにも適しています。 量子EAチャネル:       ここをクリック 重要!購入後、インストールマニュアルを受け取るためにプライベートメッセージを送ってください。 推奨事項: 時間枠: M15 通貨ペア: GBPJPY、EURJPY、USDJPY、NZDUSD、XAUUSD アカウントの種類: ECN、Raw、またはスプレッドが非常に低い R
Azimuth Pro
Ottaviano De Cicco
5 (7)
Azimuth Pro V2:MT5向けシンセティック・フラクタル構造分析と確認済みエントリー 概要 Azimuth Pro は Merkava Labs によるマルチレベルスイング構造インジケーターです。4つのネストされたスイングレイヤー、スイングアンカーVWAP、ABCパターン検出、3タイムフレーム構造フィルタリング、そして確定バーでの確認済みエントリー — 1つのチャートで、ミクロスイングからマクロサイクルまでを網羅するワークフロー。 これはブラインドシグナル製品ではありません。ロケーション、コンテキスト、タイミングを重視するトレーダーのための構造ファーストワークフローです。 V2発売記念オファー — Azimuth Pro V2をUSD 399で(次の100本)。最終価格:USD 499。 1. V2での変更点 シンセティック・マルチタイムフレームエンジン 上位タイムフレーム分析をMeridian Proと同じ独自のシンセティックアーキテクチャで一から再構築。よりクリーンなHTFコンテキスト、安定したライブ動作、従来のMTF同期問題なし。シンセティックエンジンは 固定比率タ
Meridian Pro
Ottaviano De Cicco
5 (2)
Meridian Pro 2.00:MT5向けプロ仕様マルチタイムフレーム・トレンドマトリクス Meridian Pro 2.00 は、MetaTrader 5 向けのプロ仕様の適応型トレンドマトリクスです。オリジナルの Meridian トレンドエンジン、クリーンなチャート ribbon、確定足ベースのシグナル矢印、8時間足 dashboard、Fuel momentum、weighted consensus、synthetic HTF processing、そしてチャート上に直接表示される上位足コンテキストラインを統合します。 目的はシンプルです。現在のトレンド、マルチタイムフレーム構造、強度、momentum、EA-ready 状態を、複数チャートに無関係なインジケータを重ねるのではなく、1つの整理された workflow で読むことです。 Meridian Pro の違い 1つの適応型エンジン - 同じ volatility-aware Meridian ロジックを M1 から W1 まで適用します。 Synthetic HTF architecture - 上位足行は下位足デ
まず第一に、この取引ツールはノンリペイント、ノンリドロー、ノンラグの指標であり、プロの取引に理想的ですことを強調する価値があります。 オンラインコース、ユーザーマニュアル、デモ。 スマートプライスアクションコンセプトインジケーターは、新米から経験豊富なトレーダーまで、非常 に強力なツールです。Inner Circle Trader AnalysisやSmart Money Concepts Trading Strategiesなど、20以上の有用な指標を1つに組み合わせています。このインジケーターはスマートマネーコンセプトに焦点を当て、大手機関の取引方法を提供し、彼らの動きを予測するのに役立ちます。 特に、流動性分析に優れており、機関がどのように取引しているかを理解しやすくしています。市場のトレンドを予測し、価格の動きを慎重に分析するのに優れています。機関の戦略とトレードを合わせることで、市場の動向についてより正確な予測ができます。このインジケーターは多目的であり、市場構造を分析し、重要な注文ブロックを特定し、さまざまなパターンを認識するのに優れています。 このインジケーター
FX Trend NG:次世代マルチマーケット・トレンドインテリジェンス 概要 FX Trend NG は、複数の時間足に対応したプロフェッショナル向けトレンド分析およびマーケット監視ツールです。 市場全体の構造を数秒で把握することができます。 複数のチャートを切り替える必要はありません。どの銘柄がトレンド中なのか、どこでモメンタムが弱まっているのか、そしてどの時間足で強い整合性があるのかを瞬時に確認できます。 ローンチ特別オファー – FX Trend NG を $30(6ヶ月) または $80 永久ライセンス でご利用いただけます。 すでに Stein Investments のユーザーですか? -> メッセージを送信 して、プライベートグループへアクセスしてください。 セットアップや詳細情報が必要ですか? -> Stein Investments 公式ページ をご覧ください。 1. FX Trend NG が他と異なる理由 3ステート・トレンドロジック ― Buy と Sell だけではない • 多くのインジケーターは Buy または Sell の2状態のみを表示します。
多くの矢印インジケーターは、シグナルだけを表示して、その後の判断をすべてトレーダーに任せてしまいます。KT Alpha Hunter Arrows は、完整なトレードプランをチャート上に提示します。 各シグナル矢印が表示されるたびに、エントリーライン、ストップロス、4つのテイクプロフィット水準、そして現在の銘柄と時間足が今トレードに値するかどうかを示すリアルタイムのエッジ判定が、すでに描画された状態で表示されます。付属の Trade Manager EA は、あなたが手動でエントリーした後の実行管理を担当し、相場が荒れて判断がぶれやすい場面でも規律あるトレードを保ちやすくします。リペイントなし。確定足シグナルのみ。Forex、ゴールド、指数、その他あなたが取引するあらゆる銘柄に対応します。 主な機能 リペイントしない買い矢印と売り矢印を、足の確定後にのみ表示。 各シグナルに、エントリーライン、構造的ストップロス、4つのテイクプロフィット水準を表示。 Edge Dashboard が、現在のチャートで買いセットアップと売りセットアップを別々に評価。 判定システム:No Edge、Mar
GEM Signal Pro GEM Signal Pro は、MetaTrader 5 向けのトレンドフォロー型インジケーターです。より明確なシグナル、より整理されたトレードセットアップ、そして実用的なリスク管理をチャート上で確認したいトレーダーのために設計されています。 単純な矢印だけを表示するのではなく、GEM Signal Pro はトレード全体の考え方を、より見やすく分かりやすい形で表示します。条件が確認されると、インジケーターはエントリー価格、ストップロス、利確目標をチャート上に表示し、トレードセットアップをより効率的に確認できるようにします。 動作の仕組み このインジケーターは、まず内部ロジックに基づいて有効なシードシグナルを検出します。 確認条件が満たされると、GEM Signal Pro はチャート上に完全なセットアップを表示します。これにより、トレーダーはトレード構造をより明確に把握し、手作業による分析を減らすことができます。 チャート上のトレードレベル 確認済みシグナルに対して、GEM Signal Pro は以下を表示できます。 エントリー価格 ストップロス テ
これはMT5のインジケーターで、再描画なしで取引に参入するための正確なシグナルを提供します。 外国為替、暗号通貨、金属、株式、インデックスなど、あらゆる金融資産に適用できます。かなり正確な見積もりを提供し、取引を開始して終了するのに最適な時期を教えてくれます。1つのシグナルを処理しただけでインジケーターの元が取れた例の 動画 (6:22)をご覧ください。Entry PointsPro インジケーターの助けを借りたほとんどのトレーダーの最初の1週間の結果が改善しています。 Telegramグループ に登録してください。Entry Points Proインジケーターのメリットは次の通りです。 再描画のないエントリーシグナル 再描画されるインジケーターでは一度表示されたシグナルが削除されて大きな金銭的損失につながることがありますが、これと異なり、表示されて確認されたシグナルは消えることがありません。 エラーなしの取引開始 インジケーターアルゴリズムによって取引を開始する(資産を売買する)理想的な瞬間を見つけることができます。それを使用するすべてのトレーダーの成功率が向上します。 あら
このダッシュボードは、選択されたシンボルの最新の利用可能なハーモニックパターンを表示するので、時間を節約し、より効率的に /   MT4バージョン 。 無料インジケーター:   Basic Harmonic Pattern インジケーター列 Symbol : 選択したシンボルが表示されます。 Trend :   強気または弱気 Pattern : パターンの種類(ガートレー、バタフライ、バット、カニ、サメ、サイファー、ABCD) Entry : エントリー価格 SL: ストップロス価格 TP1: 1回目の利食い価格 TP2: 2回目の利食い価格 TP3:   3回目の利食い価格 Current price :   現在値 Age (in bars):    最後に描画されたパターンの年齢 主な入力項目 Symbols:   "28 Major Currency Pairs "または "Selected Symbols "から選択。 Selected Symbols:   カンマで区切られた監視したいシンボル("EURUSD,GBPUSD,XAUUSD")。ブローカーがペアに接
Trend Forecaster – Since 2023. The Trend Forecaster indicator utilizes a unique proprietary algorithm to determine entry points for a breakout trading strategy. The indicator identifies price clusters, analyzes price movement near levels, and provides a signal when the price breaks through a level. The Trend Forecaster indicator is suitable for all financial assets, including currencies (Forex), metals, stocks, indices, and cryptocurrencies. You can also adjust the indicator to work on any time
Quantum TrendPulse を ご紹介します。これは、   SuperTrend   、   RSI   、および Stochastic のパワーを 1 つの包括的なインジケーターに組み合わせて、取引の可能性を最大限に引き出す究極の取引ツールです。精度と効率を求めるトレーダー向けに設計されたこのインジケーターは、市場のトレンド、勢いの変化、最適なエントリー ポイントとエグジット ポイントを自信を持って特定するのに役立ちます。 主な特徴: SuperTrend 統合: 現在の市場動向に簡単に追従し、収益性の波に乗ることができます。 RSI精度: 買われすぎと売られすぎのレベルを検出し、市場の反転のタイミングに最適で、SuperTrendのフィルターとして使用されます。 確率的精度: 確率的振動を活用して、変動の激しい市場で隠れたチャンスを見つけます。SuperTrend のフィルターとして使用されます。 マルチタイムフレーム分析:   M5 から H1 または H4 まで、さまざまなタイムフレームで市場を常に把握します。 カスタマイズ可能なアラート: カスタム取引条件が満たされ
優れたテクニカルインジケーター「Grabber」をご紹介します。これは、すぐに使える「オールインワン」トレーディング戦略として機能します。 ひとつのコードに、市場のテクニカル分析ツール、取引シグナル(矢印)、アラート機能、プッシュ通知が強力に統合されています。 このインジケーターを購入された方には、以下の特典を無料で提供します: Grabberユーティリティ:オープンポジションを自動で管理するツール ステップバイステップのビデオマニュアル:インジケーターのインストール、設定、取引方法を解説 カスタムセットファイル:インジケーターをすばやく自動設定し、最大限の成果を出すための設定ファイル 他の戦略はもう忘れてください!Grabberだけが、あなたを新たなトレードの高みへと導いてくれるのです。 Grabber戦略の主な特徴: 推奨タイムフレーム:M5〜H4 対応通貨ペア・資産:どれでも使用可能ですが、私が実際に検証した以下を推奨します(GBPUSD、GBPCAD、GBPCHF、AUDCAD、AUDUSD、AUDSGD、AUDCHF、NZDUSD、NZDCAD、EURCAD、EURUSD、E
FX Power: 通貨の強弱を分析して、より賢い取引を実現 概要 FX Power は主要通貨と金の実際の強弱をあらゆる市場状況で理解するための必須ツールです。強い通貨を買い、弱い通貨を売ることで、 FX Power は取引の意思決定を簡素化し、高い確率の取引機会を見出します。トレンドを追従する場合でも、極端なデルタ値を使用して反転を予測する場合でも、このツールはあなたの取引スタイルに完全に適応します。ただ取引するだけではなく、 FX Power で賢く取引をしましょう。 1. なぜ FX Power がトレーダーにとって非常に有益なのか 通貨と金のリアルタイム強弱分析 • FX Power は主要通貨と金の相対的な強弱を計算し、マーケットダイナミクスに関する明確な洞察を提供します。 • どの資産がリードしているか、または後れを取っているかを監視して、取引するペアを賢く選びましょう。 マルチタイムフレームの包括的なビュー • 短期、中期、長期のタイムフレームで通貨と金の強弱を追跡し、マーケットトレンドに基づいて取引戦略を調整できます。 • スキャルピングからスイングトレード
まず第一に、この取引インジケーターは再描画されず、再描画されず、遅延しないことを強調する価値があります。これにより、手動取引とロボット取引の両方に理想的なものになります。 ユーザーマニュアル:設定、入力、戦略。 アトミックアナリストは、価格の強さとモメンタムを利用して市場でより良いエッジを見つけるためのPA価格アクションインジケーターです。ノイズや誤ったシグナルを除去し、取引ポテンシャルを高めるための高度なフィルターを備えています。複雑なインジケーターの複数のレイヤーを使用して、アトミックアナリストはチャートをスキャンし、複雑な数学的計算をシンプルなシグナルと色に変換します。これにより、どのような初心者トレーダーでも理解して使用し、一貫した取引の決定を行うことができます。 「アトミックアナリスト」は、新規および経験豊富なトレーダー向けにカスタマイズされた包括的な取引ソリューションです。プレミアムインジケーターとトップノッチの機能を1つの取引戦略に組み合わせ、すべてのタイプのトレーダーにとって汎用性のある選択肢にします。 デイリートレーディングとスキャルピング戦略:高速で正確なデイ
OrderFlux | MetaTrader 5 用フットプリント・オーダーフロー バージョン 2.0 – アクティブトレーダー向けのリアルタイム Bid/Ask 可視化 OrderFlux は MT5 用のフットプリントおよびオーダーフローインジケーターです。価格がどこに動いたかだけでなく、その動きの中で何が起きているか(各価格レベルの Bid/Ask ボリューム、デルタ、インバランス、ボリューム分布)を表示します。 多くのチャートはローソク足の最終結果しか表示しません。OrderFlux はそこに至るまでの過程を表示します。ローソク足の形状だけでなく、市場参加者の動向を読み取りたい場合にまさに役立ちます。 ライブチャートにおいて、OrderFlux は主に次の3つの質問に答えます: 現在、どこで積極的な買いまたは売りの圧力が市場に参入しているか? どの価格レベルでボリュームが吸収、または拒否されているか? 現在の動きはセッションのコンテキスト(背景)にどう適合しているか? インターフェースで得られるもの メインチャートは、Canvas ベースでフットプリントを直接レンダリングします
RelicusRoad Pro: 定量的市場オペレーティングシステム 【期間限定】無制限アクセス 70% OFF - 2,000人超のトレーダーと共に なぜ多くのトレーダーは「完璧な」インジケーターを使っても失敗するのでしょうか? それは、文脈を無視して 単一の概念 だけでトレードしているからです。文脈のないシグナルは単なるギャンブルです。勝ち続けるには、 根拠の重なり(コンフルエンス) が必要です。 RelicusRoad Proは単なる矢印インジケーターではありません。完全な 定量的市場エコシステム です。独自のボラティリティモデリングを用いて、価格が推移する「適正価値の道(Fair Value Road)」をマッピングし、ノイズと真の構造的ブレイクを判別します。 推測はやめましょう。機関投資家レベルの「ロード・ロジック」でトレードを。 コアエンジン:「Road」アルゴリズム システムの中心となる Road Algo は、市場環境にリアルタイムで適応するダイナミックなボラティリティチャネルです。 安全ライン(平衡点) と、価格が数学的に反転しやすい 拡張レベル を投影します。 Si
Hydra Trend Rider is a non-repainting, multi-timeframe trend indicator that delivers precise buy/sell signals and real-time alerts for high-probability trade setups. With its color-coded trend line, customizable dashboard, and mobile notifications, it's perfect for traders seeking clarity, confidence, and consistency in trend trading. Setup & Guide:  Download  MT4 Version here. To learn how to use the Indicator: Indicator Manual & Guide -   Read Here Follow our MQL5 channel for daily market ins
トレンドラインプロ   市場の真の方向転換点を理解するのに役立ちます。この指標は、真のトレンド反転と主要プレーヤーが再び参入するポイントを示します。 分かりますか     BOSライン   複雑な設定や不要なノイズなしに、より長い時間足でのトレンドの変化と重要なレベルを把握できます。シグナルは再描画されず、バーが閉じた後もチャート上に残ります。 MT4バージョン   -   RFI LEVELS PRO インジケーター と組み合わせることで、その最大限の能力を発揮します インジケーターが示す内容: 本当の変化   トレンド(BOSライン) 一度シグナルが現れたら、それは有効です!これは、リペイント機能を持つインジケーターとの重要な違いです。リペイント機能を持つインジケーターは、シグナルを発した後、それを変更し、資金の損失につながる可能性があります。これにより、より高い確率と精度で市場に参入できます。また、矢印が現れた後、目標値(利益確定)に達するか、反転シグナルが現れるまで、ローソク足の色を変更する機能もあります。 繰り返しエントリ   主要プレーヤーの補充 エントリーポイントを探す
Introducing Indicator for PainX and GainX Indices Traders on Weltrade Get ready to experience the power of trading with our indicator, specifically designed for Weltrade   broker's PainX and GainX Indices.  Advanced Strategies for Unbeatable Insights Our indicator employs sophisticated strategies to analyze market trends, pinpointing optimal entry and exit points.  Optimized for Maximum Performance To ensure optimal results, our indicator is carefully calibrated for 5-minute timeframe charts on
このインジケーターは、反転ポイントと価格戻りゾーンを正確に表示します。     主要プレーヤー 。新たなトレンドが形成される場所を把握し、最大限の精度で意思決定を行い、すべての取引をコントロールします。 TREND LINES PRO インジケーターと組み合わせることで、その潜在能力を最大限に発揮します。 VERSION MT4 インジケーターが示す内容: 新しいトレンドの始まりに活性化する反転構造と反転レベル。 リスクと報酬の比率を最小限に抑えた利益 確定 と 損失停止の レベルの表示     RR 1:2   。 インテリジェントな削減ロジックによるストップロス。 指定されたインジケーターから 2 つのトレンド タイプの反転パターンを表示します。 指標: トレンドを追う   TREND LINES PRO   (世界的なトレンドの変化) TREND PRO   (クイックトレンド変更) シンプルで効果的   スキャナー   リアルタイムトレンド(新機能)。 マルチタイムフレームのインストゥルメント フィルタリング。 画面   利益     LOGIC AI信号の後。 当日プラス方
OmniSync Projection
Antonio-alin Teculescu
5 (1)
Chronos Fractal Engine is an innovative price projection indicator for MetaTrader 5, designed to transform your technical analysis by intelligently identifying and projecting historical price patterns. Built upon an advanced correlation algorithm and the fractal principles of the market, this powerful tool visualizes potential future price movements, giving you a unique edge in your trading decisions. What is Chronos Fractal Engine? At its core, the Chronos Fractal Engine employs a sophisticat
このインディケータは、価格アクション分析とドンチャンチャネルのみを使用して、ジグザグ方式で価格の反転を検出します。再描画やバックペインティングを一切行わずに、短期取引向けに特別に設計されています。それは彼らの操作のタイミングを増やすことを目指している賢明なトレーダーにとって素晴らしいツールです。 [ インストールガイド | 更新ガイド | トラブルシューティング | よくある質問 | すべての製品 ] 驚くほど簡単に取引できます すべての時間枠で価値を提供します 自己分析統計を実装します 電子メール/音声/視覚アラートを実装します 可変長のブレイクアウトと混雑ゾーンに基づいて、インディケータは価格アクションのみを使用して取引を選択し、市場が非常に高速に行っていることに反応します。 過去のシグナルの潜在的な利益が表示されます この指標は、独自の品質とパフォーマンスを分析します 負けブレイクアウトは強調表示され、説明されます インジケータは、非バックペインティングおよび非再ペイントです この指標は、日中のトレーダーが単一の価格反転を見逃さないようにするのに役立ちます。ただし、すべての
FX Volume MT5
Daniel Stein
4.79 (24)
FX Volume:ブローカー視点で捉える本物の市場センチメント クイック概要 トレード手法をさらに高めたいとお考えですか? FX Volume は、リテールトレーダーやブローカーのポジション状況をリアルタイムで提供します。これは、COTのような遅延レポートよりもはるかに早く知ることができます。安定した利益を目指す方も、さらなる優位性を求める方も、 FX Volume は大きな不均衡を見極め、ブレイクアウトを確認し、リスク管理を洗練させるのに役立ちます。今すぐ始めて、実際の出来高データがどのように意思決定を変革するかを体感してください! 1. FX Volume がトレーダーにとって非常に有益な理由 高精度の早期警戒シグナル • 各通貨ペアを売買しているトレーダー数を、他者よりも早く、ほぼリアルタイムで把握できます。 • FX Volume は、複数のリテールブローカーから得られる本物の出来高データを収集し、分かりやすい形式で提供する 唯一 のツールです。 強力なリスク管理 • ロングやショートの大きな偏り(インバランス)を特定し、潜在的なトレンド転換を見逃しません。ストップ
Smart Structure Concepts MT5
Cristhian Alexander Gaibor Cuasquer
Smart Structure Concepts MT5 は MetaTrader 5 で最も完全な機関投資家向け SMC ツールキットです — 4言語の教育的ツールチップと、価格がゾーンに入った瞬間のライブプッシュアラートを備えています。 ほとんどの SMC インジケーターはボックスを描くだけで、あなたに推測を強いります。このインジケーターはチャート上で各シグナルを直接説明します。任意の BOS、CHoCH、Order Block、FVG、流動性レベルにマウスを合わせれば、その意味と次に何をすべきかが即座にわかります — 英語、スペイン語、ポルトガル語、フランス語で。 含まれる機能 — Internal & Swing BOS / CHoCH をリアルタイムで検出(リペイントなし) — Internal & Swing Order Blocks と自動ミティゲーション — 上昇・下降 Fair Value Gaps — Equal Highs & Lows(EQH / EQL)流動性マッピング — Premium / Discount / Equilibrium ゾーン —
初心者やエキスパートトレーダーに最適なソリューション! このインジケーターは、独自の機能と新しい計算式を取り入れた、ユニークで高品質、かつ手頃な価格のトレーディングツールです。たった1枚のチャートで28の為替ペアの通貨強度を読み取ることができます。新しいトレンドやスキャルピングチャンスの引き金となるポイントを正確に特定することができるので、あなたのトレードがどのように改善されるか想像してみてください。 ユーザーマニュアルはこちら  https://www.mql5.com/en/blogs/post/697384 これが最初の1本、オリジナルだ! 価値のないクローンを買わないでください。 特別な サブウィンドウの矢印で強い通貨の勢いを表示 GAPがあなたのトレードを導く! 基準通貨や気配値が売られすぎ・買われすぎのゾーン(外相フィボナッチレベル)にあるとき、個別チャートのメインウィンドウに警告表示。 通貨がレンジの外側から反落した場合、プルバック/リバーサルのアラート。 クロスパターンの特別なアラート 複数の時間枠を選択可能で、トレンドを素早く確認できます。通貨強度のライン
作者のその他のプロダクト
Morvan
Nguyen Thanh Trieu
MORVAN 私はMorvanです。 方向を読み、構造を待ち、価格が動きが展開する可能性が最も高いレベルに達した時にのみ仕掛けます。 推測なし。リベンジトレードなし。ノイズの中でローソク足を追いかけることなし。 構造が揃った時にのみ執行し、エントリーからエグジットまで全てのポジションを規律を持って管理します。 ほとんどのトレーダーはチャートが読めないから負けるのではありません。エントリーが遅すぎ、ポジションサイズが緩すぎ、流動性が狙うところにストップを置き、感情が出口判断を上書きするから負けるのです。 私はその弱点を排除するために設計されました。 私は市場を予測しません。する必要がないのです。 バイアスを読み、構造の形成を待ち、継続またはブレイクアウトがより高い確率の結果となるゾーンに価格が到達した時にのみ展開します。 運用方法 私の執行フレームワークは3つの原則に基づいています: トレンドが第一。構造が第二。リスクは常に。 まず、上位時間軸の構造から支配的な市場方向を読みます。方向が不明確なら、ポジションを取りません。 次に、継続圧力が最も強い価格ゾーンを見つけます。ノイズには飛び込
NFP発表時の価格急騰。日次損失限度額が数秒で超過。口座が制限されました。 これは、高ボラティリティイベント中に証拠金が手動反応より速く低下するときに発生します。 PropFirm Risk Guardは、証拠金をリアルタイムで監視し、定義した限度額に近づくと自動的に反応します。 厳格なリスク規則を持つプロップファームチャレンジ向けに設計:FTMO、The5ers、Funded Trading Plus、MFF。 パーセンテージベース(日次5%、最大10%)および米ドルベースのドローダウン計算の両方をサポートし、異なる企業の要件に対応します。 高ボラティリティシナリオに最適化:金(XAUUSD)取引、主要指数、ニュースイベント、オーバーナイトギャップ。 主な機能: リアルタイム証拠金監視: 日次および口座のドローダウンを100ミリ秒ごとに追跡します。限度額に近づくと反応し、さらなる損失を防ぎます。 ソフト/ハード保護モード: ソフトモードは、ポジションを閉じる前にカウントダウンタイマー付きの警告を提供します。ハードモードは即座に実行します。反応スタイルを選択できます。 決済済み損益の時
Manual position management. Missing SL. Price moves against you. No protection. Trade Manager Lite automates Stop Loss, Take Profit, Trailing Stop, and Break-Even for your open positions. Attach to one chart. Configure your default SL/TP distance. Let it manage your positions automatically. What's Included (FREE Version) Auto SL/TP: Applies missing Stop Loss and Take Profit to positions based on your configured distance in points Trailing Stop: Adjusts SL dynamically as price moves in your favor
FREE
SMC Liquidity Channel Guard Prices reverse just as your breakout trade triggers. Account suffers unexpected drawdown. Because standard channels ignore institutional liquidity sweeps and trap retail stop-loss orders. This utility automatically monitors highest buy-side and lowest sell-side liquidity pools to flag false breakouts. Key Features: Dynamic Liquidity Tracking: Maps Buy-Side (BSL) and Sell-Side (SSL) boundaries without lagging moving averages. Sweep Identification: Prints precise direct
FREE
ファンド口座。一度のロット計算ミス。ドローダウン上限を突破。口座閉鎖。 戦略が悪かったのではない。執行の瞬間にリスクが管理されていなかったからだ。 Trade Command Center はビジュアル注文執行・リスク管理パネルです。 SL距離からロットを計算。ポジションを自動管理。ドローダウン上限をリアルタイム監視。 5タブ。1チャートパネル。DLLなし。外部接続なし。 正確な執行とプロップファーム準拠を必要とする裁量トレーダー向けに設計。 プロップファーム系ルールに対応した柔軟なRisk Guard設定。日次損失、週次損失、エクイティ・ドローダウン、フローティング損失に対応。 コア機能 ビジュアル・トレード・プランニング: チャート上でEntry、SL、TPボックスをドラッグ。ロット、ピップス距離、ドル金額、R:Rをリアルタイム表示。ワンクリック執行。 リスク計算: リスクモードを選択 — 残高比率、固定金額、固定ロット。パネルがポジションサイズを自動計算。 カスタムR:Rコントロール: クイックRRボタン、または独自のリワード:リスク目標を入力して、より素早く計画。 マルチレベル
Volume Pressure Meter MT5 ローソク足は強く見えた。出来高は高く見えた。ブレイクアウトでエントリーした。 数分で価格が反転した。その動きには真の参加がなかった。 Volume Pressure Meterは機関投資家が見ているものを明らかにする:価格の動きの背後に実際の買い圧力または売り圧力が存在するか、それとも空虚な出来高に対してトレードしているか。 M5からH4のタイムフレームでゴールド(XAUUSD)、インデックス、主要外国為替ペアを分析するイントラデイおよびスイングトレーダー向けに設計されています。8つの機関レベルの出来高分析ツールを、AIパターン認識とリアルタイム確率計算を備えた1つの統合システムに融合しています。 表示内容 HUD(ヘッドアップディスプレイ)インターフェース: シグナルステータス: 現在の市場推奨(BUY、SELL、WAIT、AVOID)をリアルタイムで更新 圧力バランスゲージ: 買い手と売り手の参加を色分けされた強度で視覚的に表現 シグナルスコア: 複数の出来高確認要素に基づく0から10までの強度評価 勝率確率: 現在の条件と過去の
Volume Pressure Meter breakdown tick volume to reveal the buying and selling pressure inside every candle. Unlike standard volume which only shows total activity, this indicator splits volume to show who is actually in control of the market. It helps you identify trend strength and spot potential reversals through volume divergence. Key Features: Pressure Gauge: Visual bar showing real-time Buy vs Sell percentages. Trend Bias: Automatically identifies if the market is dominated by Buyers or Sell
FREE
Smart Session Box Displays Asia, London, and New York trading sessions with automatic timezone adjustment and session overlap highlighting. Main Features Complete session analysis with no limitations. Key Features The indicator draws session boxes with high and low lines for each trading session. Session overlaps are highlighted with distinct colors to identify high liquidity periods. Breakout alerts notify when price crosses previous session levels. A control panel provides quick toggles for al
FREE
大きなボディを持つローソク足が確定。ブレイクアウトのように見える。エントリー。 次のバーが反転し、ストップアウト。出来高は平均的で、モメンタムはすでに衰えていた。 Impulse Momentum Shift は真のインパルスを持つバーを識別し、そのインパルスが反転する瞬間をマークします。 多くのトレーダーはローソク足のサイズだけを見ます。しかし本物のインパルスには3つの要素が必要です:ボディの支配性、直近平均を上回る出来高スパイク、そしてATRで正規化された方向性モメンタム。 このインジケーターは3次元すべてで各バーをスコアリングし、5色のインパルスカラースケールでチャートをペイントし、強いインパルスフェーズが方向を反転させた瞬間にシフト矢印を配置します——確定済みバーのみ。 表示内容: 5色インパルスキャンドル: 強い強気インパルスはブライトブルー、中程度はライトブルー、中立はグレー、中程度の弱気はコーラル、強い弱気はクリムゾン。各バーはリアルタイムで0〜100のスコアを取得 Impulse Trail ライン: ATRベースの動的ラインで、支配的なインパルス方向にラチェット式に追
FREE
Price breaks out. You want the continuation, but the entry usually comes too early, too late, or directly into a weak pullback. Without structure, most traders can see the move but still cannot define where the retracement remains healthy and where the setup starts to fail. Pullback Execution Map turns the current swing into a visual execution plan on the chart and a pullback meter below price. What it shows: Fibonacci execution pocket: Maps the active swing with a clear pullback pocket from the
FREE
Murrey Math Channels Identifying key market reversal points and core trading ranges can be challenging. Traditional analysis often lacks clear mathematical structure, leading to inconsistent entries. Murrey Math Channels provides a mathematically grounded price framework based on the Law of Octaves to help traders define precise support, resistance, and reversal zones. How to Read the Chart: The indicator divides the price action into 8 main octaves (levels), each representing a different marke
FREE
良いセットアップ。間違った市場状態。トレードは実行される前に無効になる。 広いスプレッド、セッション外の時間帯、ボラティリティの急騰、高インパクトニュースへの近接——すべてが実行前にエッジを破壊する。 Market Bias Monitor はライブ環境を分類し、実行品質を0から100でスコアリングし、条件が変化した瞬間に通知します。 ゴールド(XAUUSD)、Forex通貨ペア、インデックスをM5からW1のタイムフレームで分析する裁量および半自動トレーダー向けに設計されています。レジーム、セッション、スプレッド、ニュースリスク、マルチタイムフレームバイアスのアラインメントをリアルタイムで監視します。 何を表示するか: 市場レジーム分類: ATRボラティリティと移動平均からの価格偏差を使用してTREND、RANGE、TRANSITION、またはHIGH RISKを識別——不安定なレジーム中の実行を回避するために。 Market Quality Score(0-100): レジーム、スプレッド、ボラティリティ、セッション、バイアスの明瞭度、ニュース近接度からの複合スコア——条件を客観的に
Smart Entry Levels - Fractal and ATR Based Indicator Smart Entry Levels identifies key support and resistance zones using classical fractal detection and ATR-based volatility measurement. The indicator is designed for clarity, stability, and compliance with MQL5 Market rules. Features Upper Zone - Resistance area based on recent fractal highs Lower Zone - Support area based on recent fractal lows ATR-based sizing - Zones adapt dynamically to market volatility with selectable timeframe Non-repain
FREE
Keltner Breakout Caught in market chop. Fake breakouts trigger unwanted trades. Because standard indicators lack dynamic volatility context. This utility automatically combines a Dynamic Volatility Channel, Dual MA trend detection, and RSI momentum filtering into one visual system. Key Features: Trend Cloud: Visually fills the trend zone with a dynamic Keltner-style volatility channel. Multi-Factor Breakout: Only issues a signal when price breaks the volatility channel AND trend/momentum confirm
FREE
Parabolic Trend Corridor Identifying trend direction and volatility boundaries is a common challenge for day traders. Standard indicators often lack a holistic view of both trend structure and market noise. Parabolic Trend Corridor solves this by combining the adaptive nature of Parabolic SAR with dynamic ATR volatility bands. Key Features: Adaptive Trend Core: Uses Parabolic SAR as the foundation to follow price movement and volatility changes without lag. Dual-Color Cloud: Dynamic visual feedb
FREE
Smart Confluence Radar 3つの指標を個別に分析してコンフルエンスを見つけるには時間がかかります。マルチタイムフレームのオーバーレイ、アラート、セッションフィルターについては、 Smart Confluence Radar Advanced をご覧ください。 Smart Confluence Radar は、ATR 拡張、出来高モメンタム、変化率を1つの視覚的なレイヤーにまとめ、ローソク足に直接重ねて表示します。 表示内容: 色付きローソク足: 明るい色 = 高コンフルエンス(スコア ≥70)。薄い色 = 中。グレー = 低モメンタム。 モメンタムライン: チャートに描画。青 = 買い圧力、赤 = 売り圧力、グレー = 中立。 バーラベル(+/-): 高コンフルエンスの確定バーのみ表示。上昇バーの下に "+"、下降バーの上に "-"。 バーカウントダウン: 右上 — 現在の時間足と残り秒数。 適用場面: ゴールド(XAUUSD)、主要通貨ペア、指数の日中取引。M5〜H4。 このツールができないこと: 売買シグナルを自動生成しません。 将来の価格動向を予測しません。
FREE
ターミナルを開きます。3つのポジションが動いています。チャートが動いています。 しかし、ロンドンは今本当にアクティブですか?それともニューヨーク前のノイズですか? Session Pulse Monitorは、取引セッションのリアルタイムステータス、ボラティリティコンテキスト、各ポジションのエントリーセッションをチャート上に直接表示します。 複数のセッションにまたがってポジションを管理し、市場に機関投資家の参加があるかを知る必要があるトレーダー向けに設計されています。 すべてのシンボルで動作 — ゴールド(XAUUSD)、主要FX通貨ペア、インデックスに最適化。 表示内容: リアルタイムセッションステータス: アジア、ロンドン、ニューヨークのLIVE/カウントダウン表示。 ボラティリティコンテキスト: 各セッションの過去のボラティリティ状態(HIGH / MED / LOW)を表示。 トレードタギング: 各オープンポジションにエントリーセッション(アジア、ロンドン、ニューヨーク、重複)を表示。 セッションカウントダウン: アクティブセッションの残り時間と次のセッションの開始時間。 この
FREE
You read the breakout correctly. Price pushed through the level. You entered. Then it reversed — and stopped you out before the real move happened. GoldStructure Pro identifies that pattern before you enter, not after. Gold fakes breakouts constantly. A candle closes above resistance, volume looks right, structure seems clear — then price snaps back and hunts your stop. Most indicators cannot separate a confirmed expansion from a liquidity sweep. GoldStructure Pro classifies every breakout in re
SMC Liquidity Channel Guard Premium レジスタンスを上抜けブレイクアウト。ストップロスはすぐ下に設置。 価格は即座に反転——本当の動きが始まる前にリテールのエントリーを罠にかける流動性スイープ。 SMC Liquidity Channel Guard Premiumは、機関投資家の流動性プールをリアルタイムでマッピングし、方向性トレンドロジックでスイープをフィルタリングし、マルチタイムフレームのコンテキストで確認済みセットアップを提供します。 ゴールド(XAUUSD)、インデックス、主要FXペアをM5からD1で分析するSmart Money Conceptトレーダー向けに設計。構造的流動性境界における機関投資家のストップハント行動の特定に最適化。 表示内容: ダイナミック流動性チャネル: バイサイド(BSL)とセルサイド(SSL)の境界をマッピング——ストップロスクラスターの蓄積場所を確認 機関スイープ検出: 価格が流動性プールを突破してもチャネル内で引ける場合を特定——ストップハント反転を発見 高確信シグナル: スイープがトレンドフィルターと一致した
活発に見える市場で取引を開始。しかしセッション終了まで残り12分。 流動性が低下し、スプレッドが拡大。ポジションは方向感なく漂う。 Session Pulse Monitor Advancedはリアルタイムのセッション分析を提供 — ライブ状態、過去のパフォーマンス統計、チャート上のビジュアルゾーン、ATR予測、セッション切替アラート — 常にどのセッションで取引しているかを把握できます。 アジア、ロンドン、ニューヨークセッションでポジションを管理するトレーダー向けに設計。単なる時計以上の機能を提供。 全シンボルに対応 — ゴールド(XAUUSD)、主要FX通貨ペア、セッション切替時に最も大きな価格変動が生じるインデックスに最適化。 主な機能: リアルタイムセッションパネル: アジア、ロンドン、ニューヨークセッションのLIVE/カウントダウン表示。ティックごとに更新。 セッション別パフォーマンス統計: セッションごとの勝率、平均損益、取引数 — 30日間の口座履歴から算出。どのセッションが戦略に合っているかを把握。 セッションハイライトゾーン: 過去5日間の各セッションにカラーコード付
Many pullbacks look tradable for a moment, but the expensive mistake comes from treating every retracement as equal. The real workflow problem is deciding whether the pullback is still worth your attention, whether it is only building, or whether it should be ignored completely. Pullback Execution Map Confluence is built as a decision-first pullback engine: it separates WAIT, BUILD, READY and AVOID conditions before it draws a full execution plan. What this version adds: Decision states instead
Liquidity Trap Confirmation 活発なデイトレード時間帯では、価格が明確な流動性ポイントを先に取りに行き、その後セットアップが本当に整う前に反転することがあります。 Liquidity Trap Confirmation は、より多くのシグナルを求めるのではなく、質の低いエントリーを減らしたい裁量トレーダー向けの バークローズ確認ツールです。流動性、構造、ディスプレイスメント、ボラティリティ、市場コンテキストを評価し、 そのセットアップを監視すべきか、準備すべきか、確認済みか、無効か、見送るべきかを示します。 表示内容 アクティブな流動性ゾーンと、そのライフサイクルをチャート上に表示します。 NO TRADE、WATCH、ARMED、CONFIRMED、INVALID の状態を表示します。 構造、ディスプレイスメント、ボラティリティ、コンテキストを組み合わせた確認ロジックを提供します。 信頼度、invalidaiton、アクティブプロファイル、リスクゲート、次の行動を示す判断パネルを表示します。 CONFIRMED と INVALID のアラートに加え、コンテキ
Ultimate Trader Suite is a professional all-in-one indicator for MetaTrader 5, combining five independent analytical modules into a single clean chart interface. Designed for traders who follow institutional price action methodology, it eliminates the need to stack multiple separate indicators. Key features Trend Engine Dual EMA system (fast/slow) combined with an ATR-based Supertrend band. Color-coded direction lines and automatic crossover arrows mark confirmed trend shifts on closed bars only
フィルタ:
レビューなし
レビューに返信