Pullback Execution Map

Price breaks out. You want the continuation, but the entry usually comes too early, too late, or directly into a weak pullback.
Without structure, most traders can see the move but still cannot define where the retracement remains healthy and where the setup starts to fail.
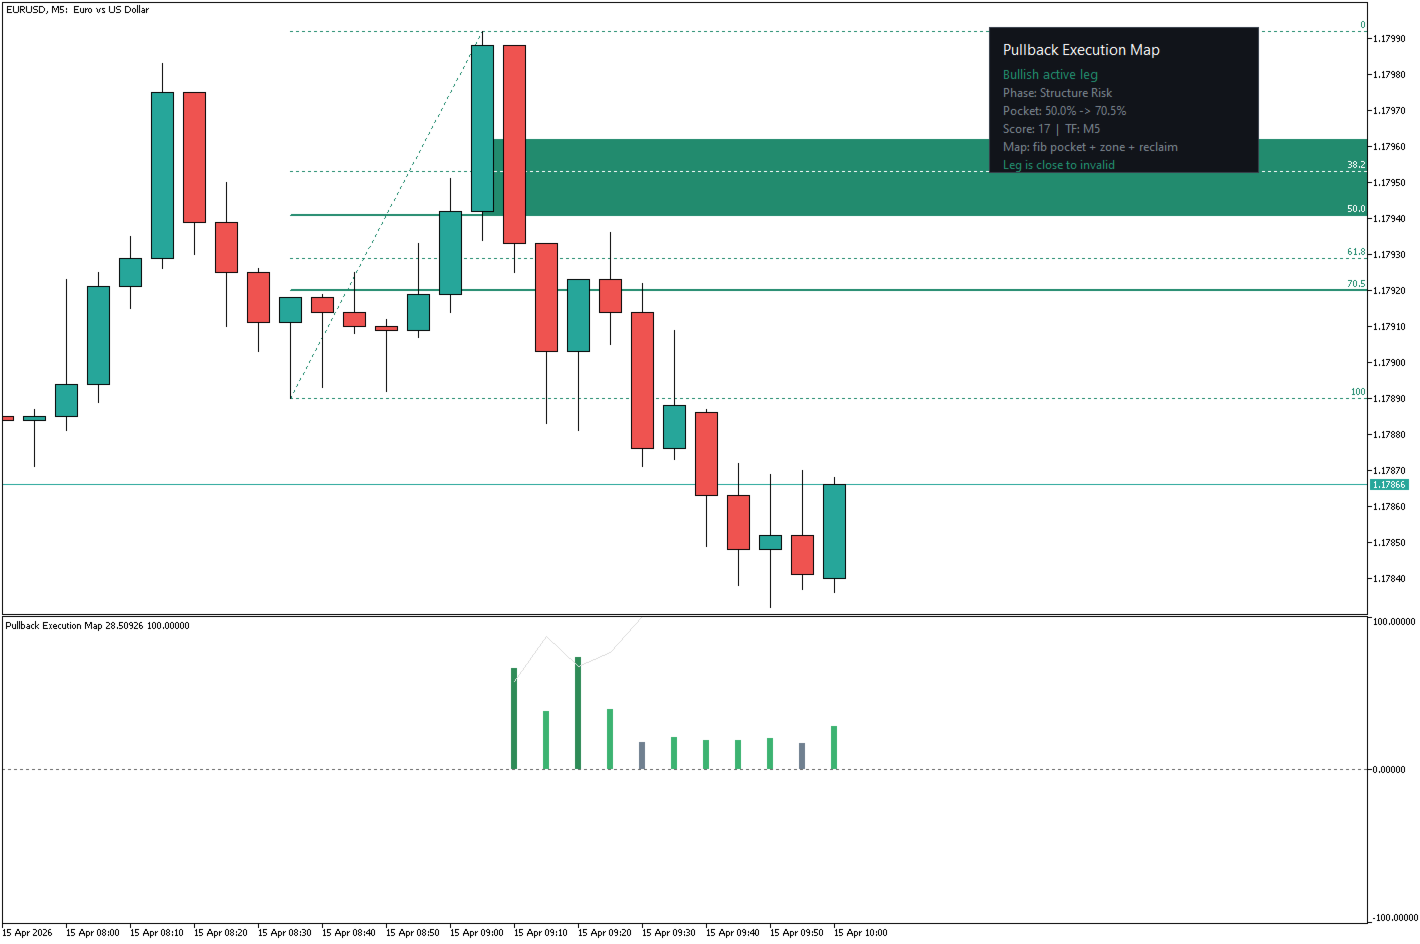
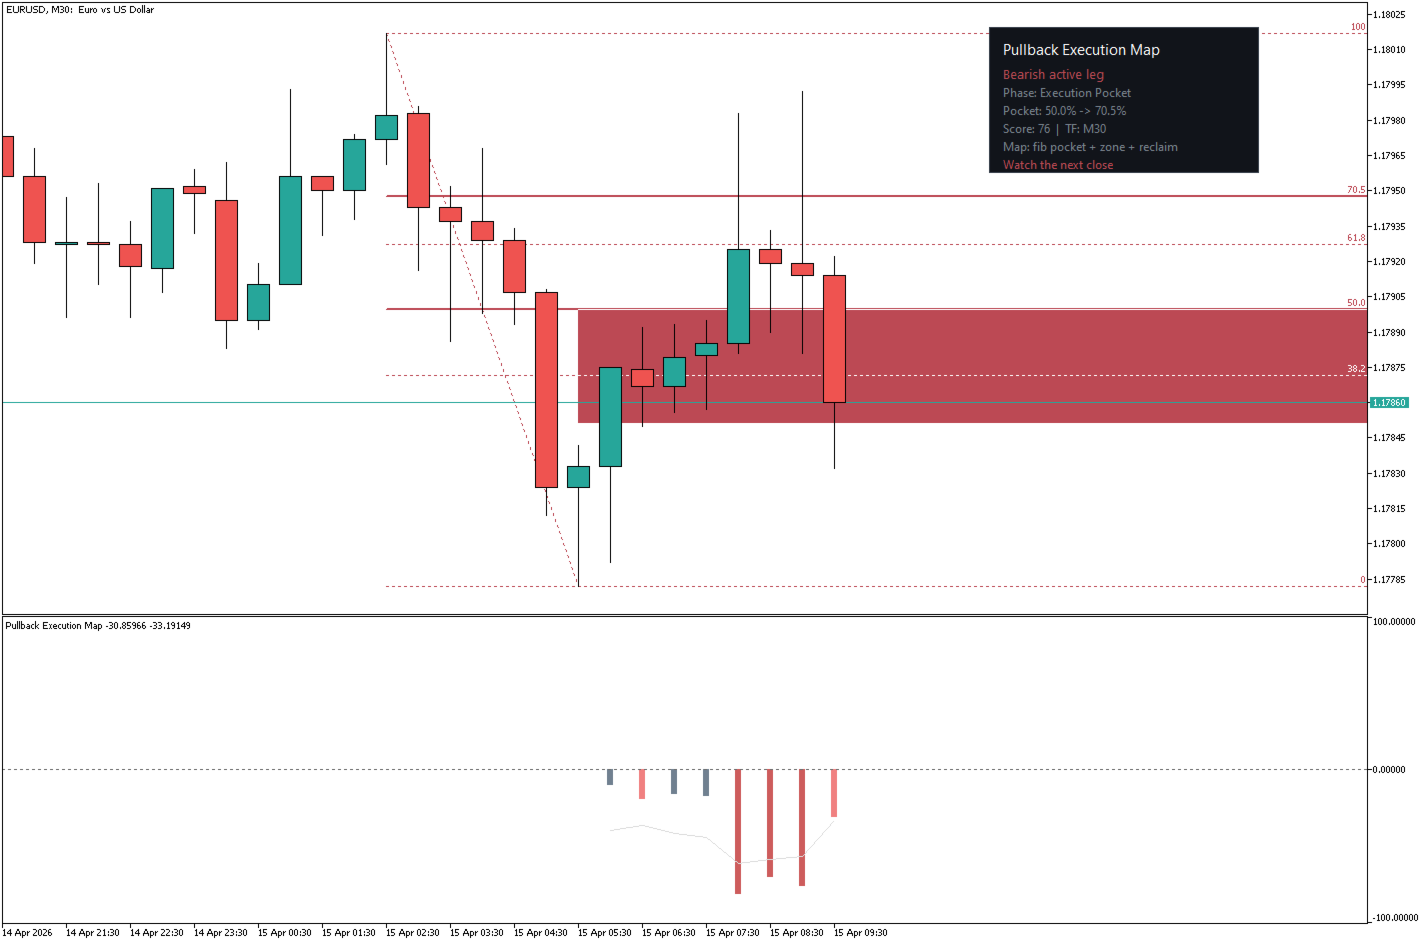
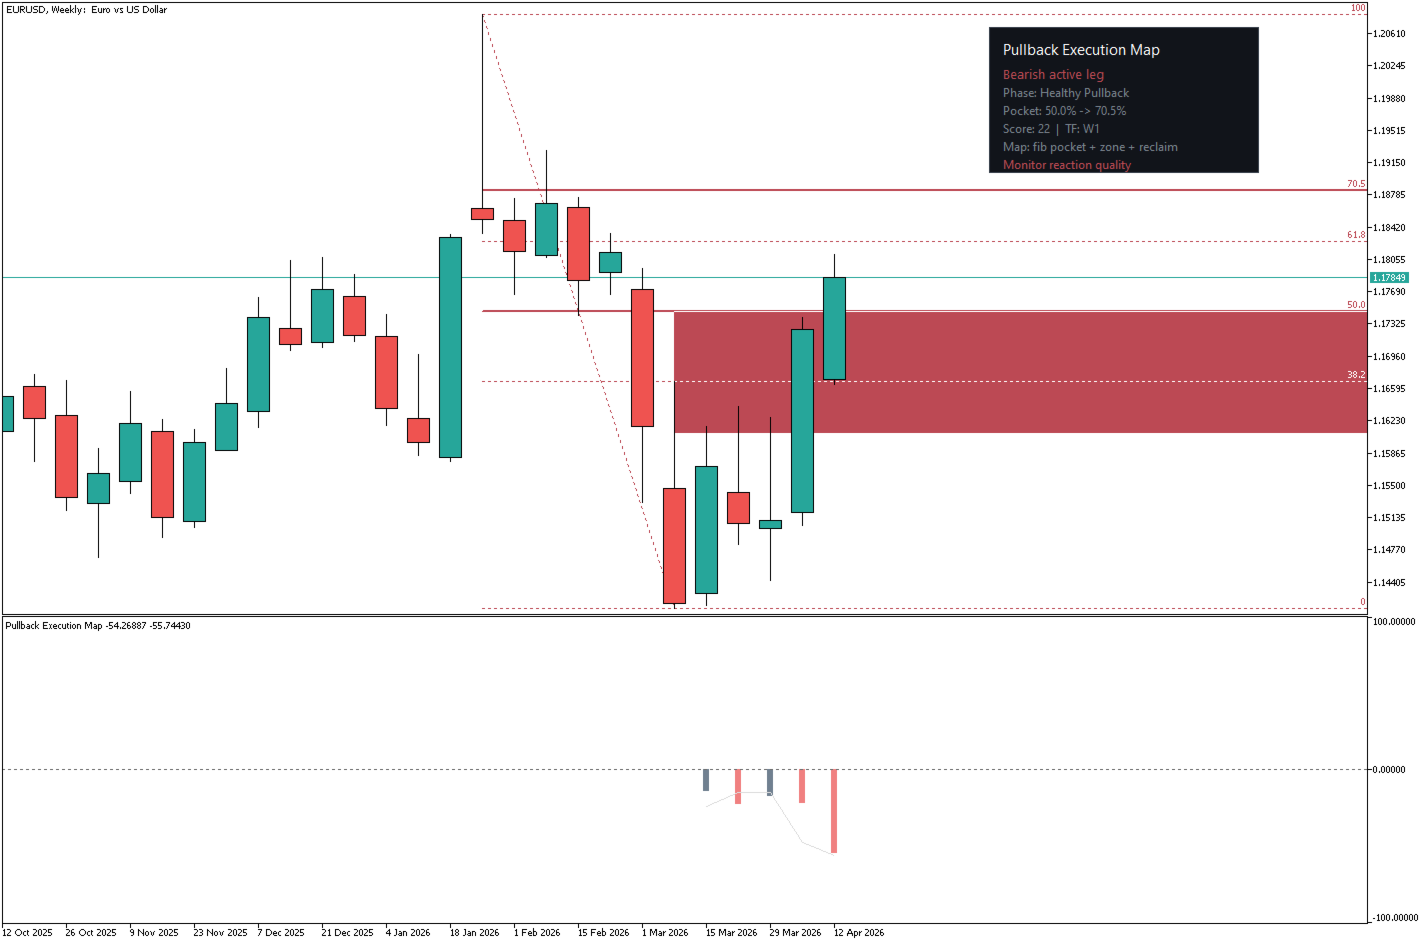
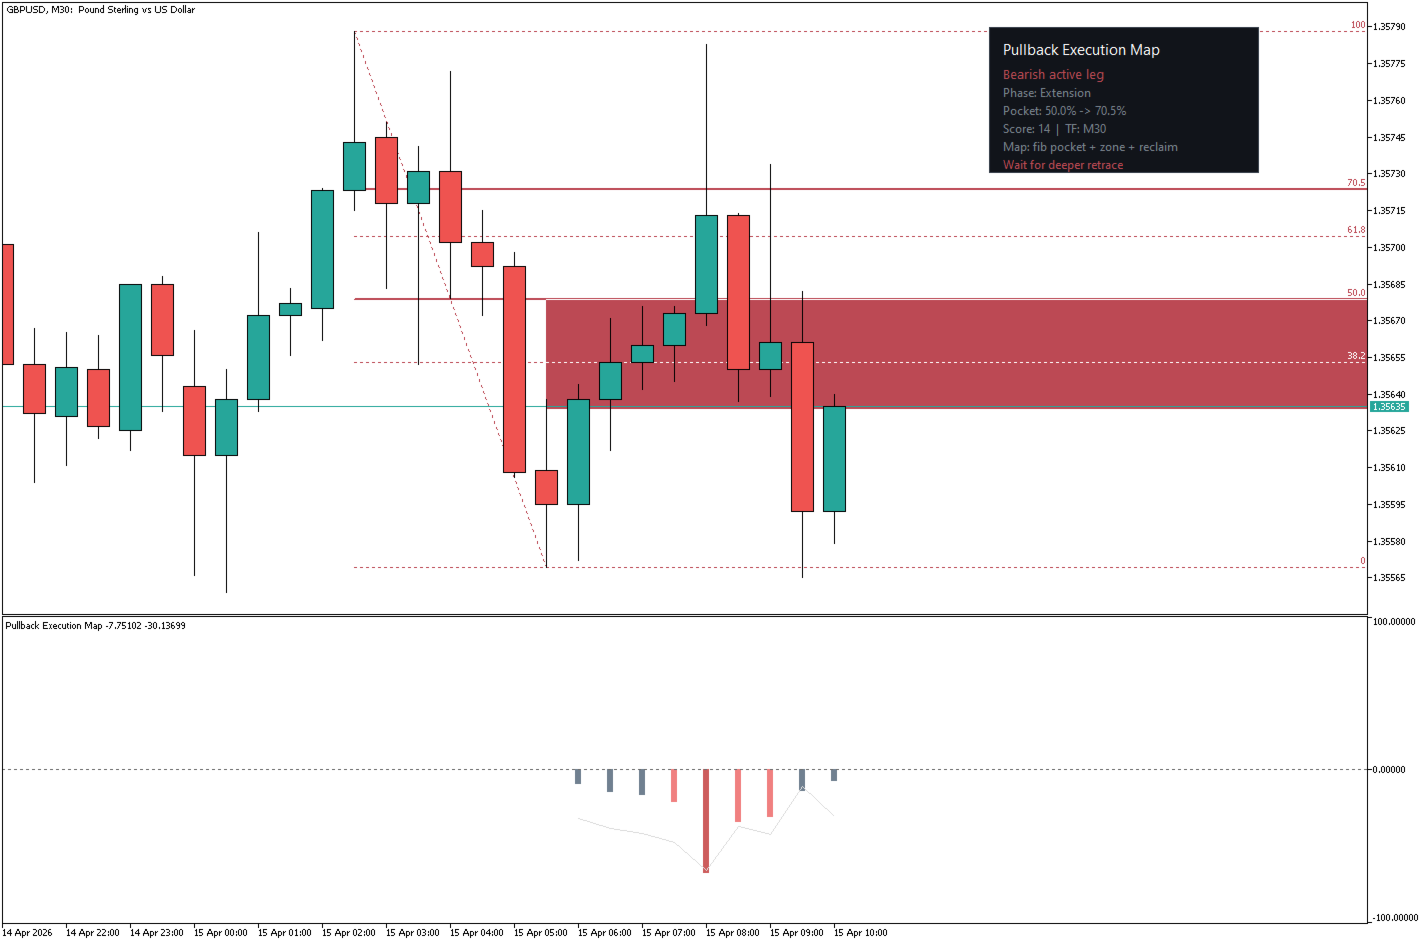
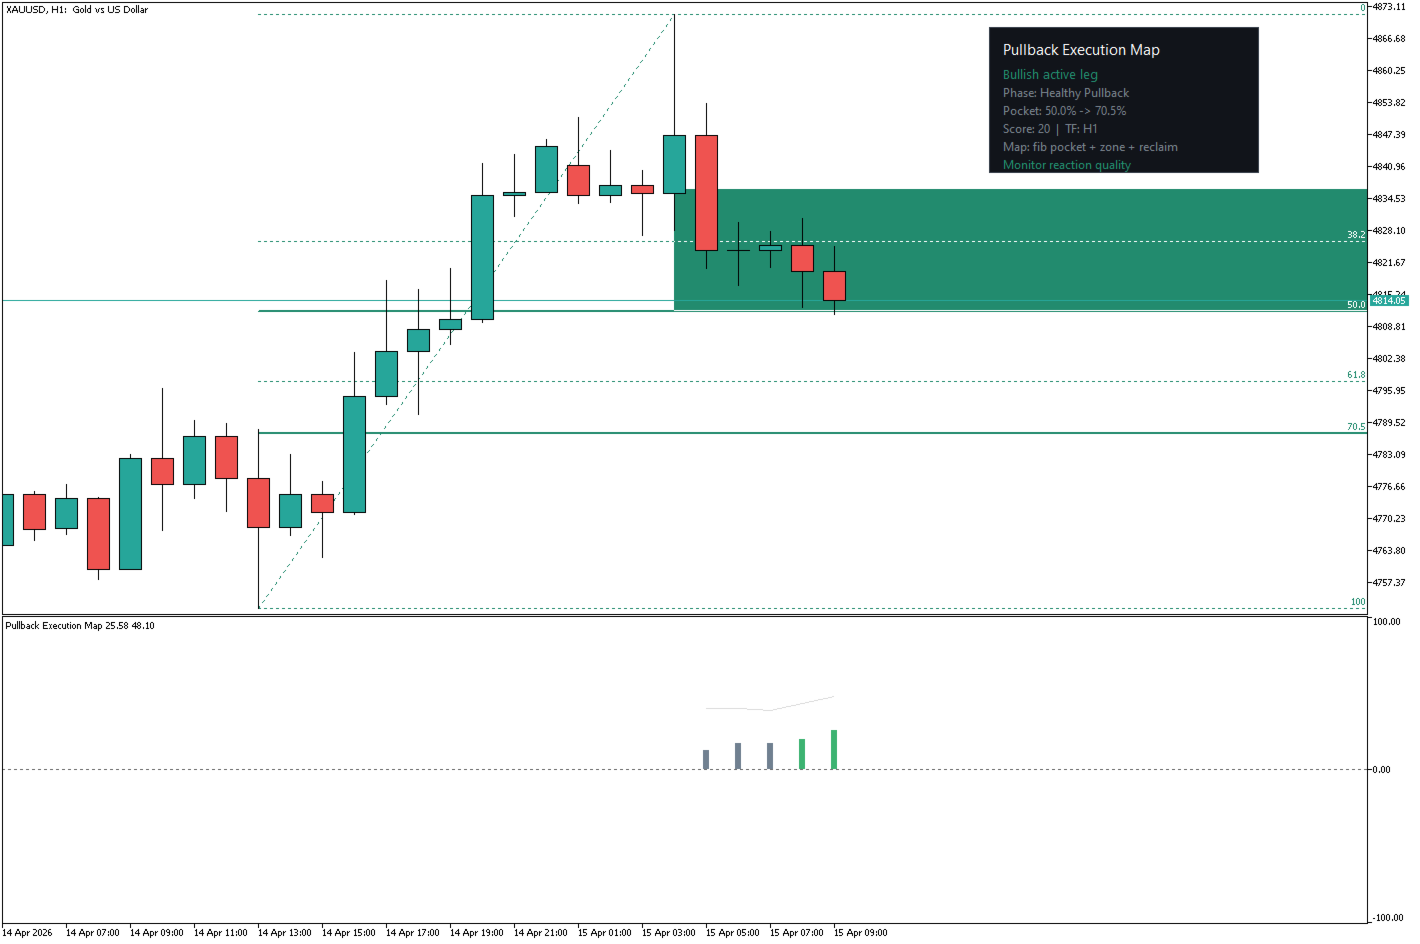
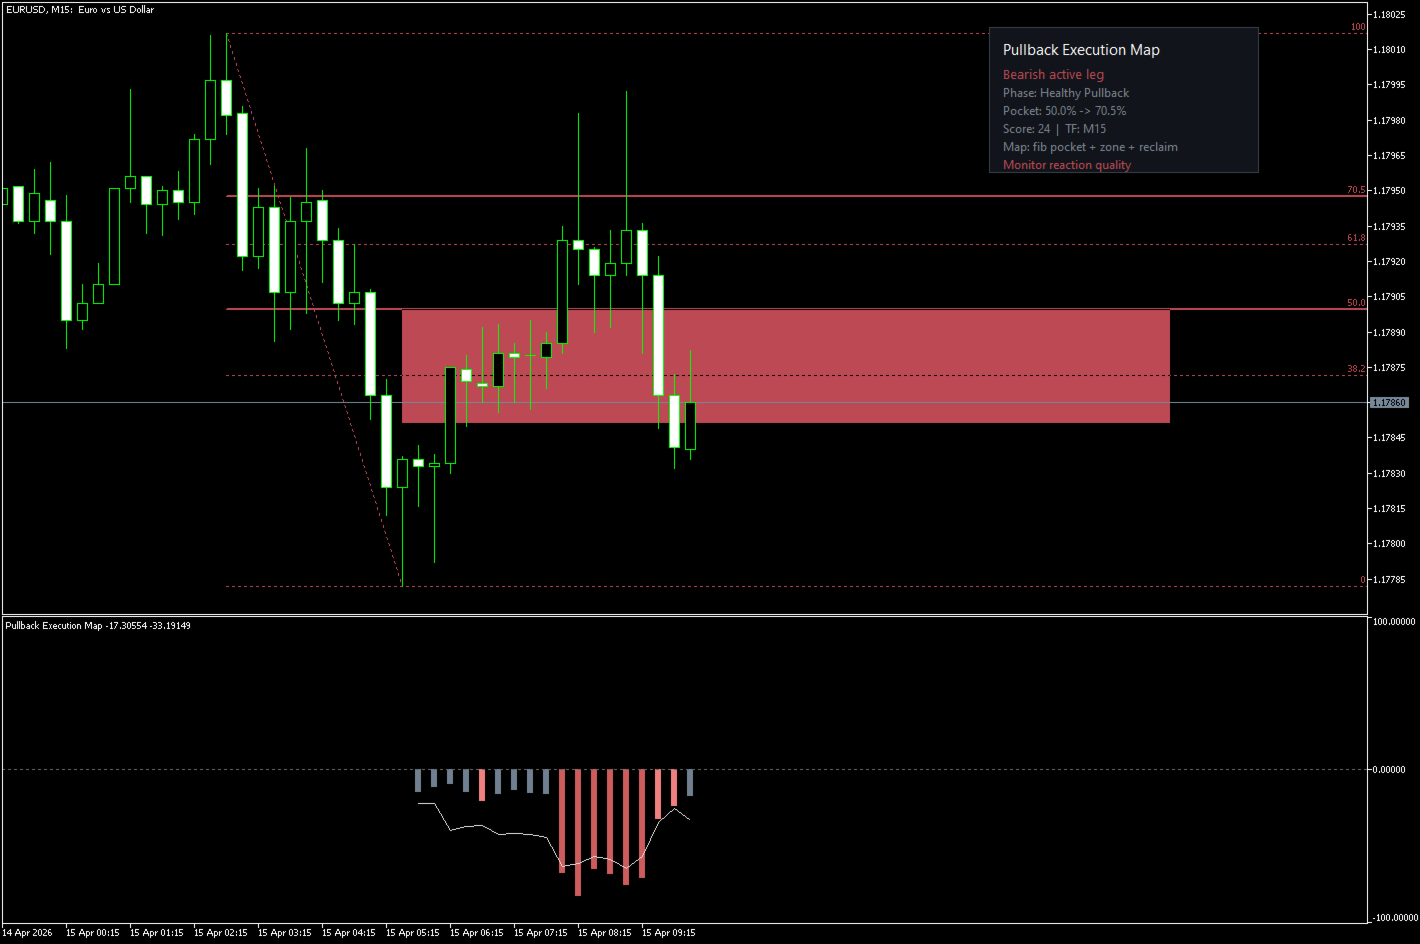
Pullback Execution Map turns the current swing into a visual execution plan on the chart and a pullback meter below price.

What it shows:

  • Fibonacci execution pocket: Maps the active swing with a clear pullback pocket from the selected retracement range so you can see where the leg is still tradable
  • Execution zone box: Projects the pullback pocket forward as one clean zone on the chart, so the important area stays visible without clutter
  • Reclaim line and arrows: A mid-leg reclaim line stays on chart, and arrows appear only when a closed bar rejects the pocket with enough execution quality
  • Separate execution meter: The subwindow histogram scores the current pullback, while the depth line shows how far price has retraced inside the active leg

How to read it:

Start with the active leg direction on the panel.
Wait for price to move from extension into the execution pocket.
Use the histogram score, reclaim line and closed-bar arrow together: the pocket shows location, the score shows quality, and the arrow confirms the reclaim on the finished candle.

Signal stability:

The map refreshes when a new swing is confirmed.
Reclaim arrows appear only on closed bars.
The current pocket, zone and reclaim structure can update while the active leg is still developing.

Best fit:

Built for Forex, Gold, indices and crypto traders who execute from M5 to H4 and want a cleaner way to trade pullbacks instead of chasing candles.

What it does NOT do:

It does not open or close trades.
It does not guarantee that a retracement will hold.
It does not replace your trading plan or risk management.
It visualizes the active execution context so your decision process becomes more structured.
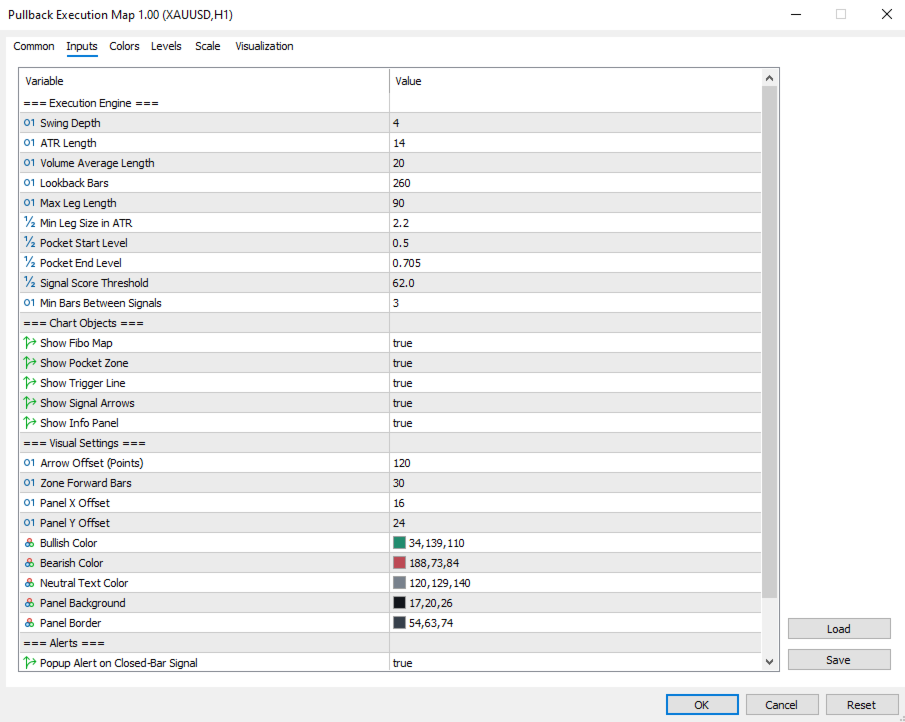
Core settings:
Detection: swing depth, ATR period, volume period, active-leg filters.
Display: Fibonacci, execution zone, reclaim line, arrows and panel.
Alerts: optional popup alert on the latest closed-bar reclaim.
Confirmation: arrows require a closed bar with pocket touch, reclaim and minimum execution score.

Free version scope:

This version focuses on one active leg at a time and one clear execution map on the chart.

For a decision-first workflow with WAIT / BUILD / READY / AVOID states, higher-timeframe confluence, session intelligence, event-risk filtering, setup grading, execution planner lines and smarter alerts, see Pullback Execution Map Confluence.

Questions or support: visit the developer profile on MQL5.

おすすめのプロダクト
VFI Quantum
Nikita Berdnikov
5 (1)
Introducing VFI (Volume Flow Indicator) – a trading indicator that analyzes the relationship between volume and price movement to identify key trading opportunities. The indicator displays the strength and direction of volume flow, providing clear signals about potential entry and exit points. Signals are formed based on zero line crossovers, crossovers between the VFI line and its exponential moving average (EMA), and when the indicator exits overbought and oversold zones. Attention! This stra
FREE
これは、ほぼ10年前に初めて公開された私の有名なスキャルパー、ゴールドフィンチEAの最新版です。短期間で起こる急激なボラティリティの拡大で市場をスキャルピングします。突然の価格上昇の後、価格変動の慣性を利用しようとします。この新しいバージョンは、トレーダーがテスターの最適化機能を簡単に使用して最適な取引パラメーターを見つけられるように簡素化されています。 [ インストールガイド | 更新ガイド | トラブルシューティング | よくある質問 | すべての製品 ] 最適化を容易にするシンプルな入力パラメーター カスタマイズ可能な取引管理設定 取引セッションの選択 平日の選択 資金管理 注意してください... 多くの要因が見返りを台無しにする可能性があるため、ダニのダフ屋は危険です。変動スプレッドとスリッページは、取引の数学的期待値を低下させ、ブローカーからの低いティック密度は幻の取引を引き起こす可能性があり、ストップレベルは利益を確保する能力を損ない、ネットワークラグはリクオートを意味します。注意が必要です。 バックテスト Expert Advisorはティックデータのみを使用します
FREE
QuantumAlert Stoch Navigator is a free indicator available for MT4/MT5 platforms, its work is to provide "alerts" when the market is inside "overbought and oversold" regions in the form of "buy or sell" signals. This indicator comes with many customization options mentioned in the parameter section below, user can customise these parameters as needful. Join our   MQL5 group , where we share important news and updates. You are also welcome to join our private channel as well, contact me for the p
FREE
QuantumAlert RSI Navigator is a free indicator available for MT4/MT5 platforms, its work is to provide "alerts" when the market is inside "overbought and oversold" regions in the form of "buy or sell" signals. This indicator comes with many customization options mentioned in the parameter section below, user can customise these parameters as needful. Join our MQL5 group , where we share important news and updates. You are also welcome to join our private channel as well, contact me for the priva
FREE
PROMETHEUS TECHNICAN VERSION Free | By THE SONS A gift from The Sons — no strings, no trial, no expiry. Every trader deserves access to professional-grade market intelligence. That belief is why Prometheus Technical Version exists, and why it costs nothing. Consider it our handshake to the trading community. What You're Getting This is not a simplified tool dressed up as a gift. Prometheus Technican Version is a fully built, institutional-quality technical analysis indicator running a dual-model
FREE
Indicator Description Range Filter Pro is a sophisticated trading tool for XAUUSD (Gold) that combines adaptive price filtering with volume analysis and real-time market monitoring. Designed for both novice and professional traders, this indicator helps identify trend direction, potential reversals, and significant market movements through its multi-layered approach. Key Components 1.Dynamic Range Filter 2.Volatility-Adjusted Bands 3.Volume-Enhanced Candles 4.Professional Trading Dashboard 5.M
FREE
Free automatic Fibonacci is an indicator that automatically plots a Fibonacci retracement based on the number of bars you select on the BarsToScan setting in the indicator. The Fibonacci is automatically updated in real time as new highest and lowest values appears amongst the selected bars. You can select which level values to be displayed in the indicator settings. You can also select the color of the levels thus enabling the trader to be able to attach the indicator several times with differe
FREE
Follow The Line MT5
Oliver Gideon Amofa Appiah
4.6 (35)
This indicator obeys the popular maxim that: "THE TREND IS YOUR FRIEND" It paints a GREEN line for BUY and also paints a RED line for SELL. (you can change the colors). It gives alarms and alerts of all kinds. IT DOES NOT REPAINT and can be used for all currency pairs and timeframes. Yes, as easy and simple as that. Even a newbie can use it to make great and reliable trades. NB: For best results, get my other premium indicators for more powerful and reliable signals. Get them here: https://www.m
FREE
The idea of the system is to indentify the reversal patterns using the calculation of the composite candle. The reversal patterns is similar to the "Hammer" and "Hanging Man" patterns in Japanese candlestick analysis. But it uses the composite candle instead the single candle and doesn't need the small body of the composite candle to confirm the reversal. Input parameters: Range - maximal number of bars, used in the calculation of the composite candle. Minimum - minimal size of the composite can
FREE
SUPERTREND; It is a trend following indicator based on the SuperTrend ATR created by Olivier Seban. It can be used to detect changes in trend direction and locate stops. When the price falls below the indicator curve, it turns red and indicates a downtrend. Conversely, when the price moves above the curve, the indicator turns green, indicating an uptrend. Like other indicators, it works well on SuperTrend when used in conjunction with other indicators such as MACD, parabolik SAR, Bollinger Band
FREE
Drream Catcher FX
Michael Prescott Burney
DREAM CATCHER FX is the ultimate EURUSD H1 trading solution, built on 16 years of relentless development and precision-engineered algorithms. This game-changing EA has executed over 4,000 trades with only 99 losses, achieving an astounding win rate that sets it apart from all competitors. Designed for both aggressive and conservative traders, it features advanced exit signals that preemptively close unfavorable trades, ensuring controlled drawdowns and consistent, long-term capital growth. Key
FREE
Girassol Sunflower MT5 Indicator
Saullo De Oliveira Pacheco
3.86 (7)
This is the famous Sunflower indicator for Metatrader5. This indicator marks possible tops and bottoms on price charts. The indicator identifies tops and bottoms in the asset's price history, keep in mind that the current sunflower of the last candle repaints, as it is not possible to identify a top until the market reverses and it is also not possible to identify a bottom without the market stop falling and start rising. If you are looking for a professional programmer for Metatrader5, please
FREE
Donchian Pro
Paulo Henrique Faquineli Garcia
4.75 (4)
The Donchian Channel Channels are among the most popular tools of technical analysis, as they visually convey to the analyst the limits within which most price movement tends to occur. Channel users know that valuable information can be obtained at any time, whether prices are in the central region of a band or close to one of the border lines. One of the best known techniques to explore these concepts is Bollinger Bands. However, John Bollinger was not the only one to research the application
FREE
シンプルだが効果的。 反転インジケーター - それは何か? スーパートレンドのロジックと指数曲線技術を組み合わせたトレンドフォロー型オーバーレイインジケーターです。トレンドの方向を検知し、チャート上に動的なチャネルを描画し、トレンドが反転した際にリアルタイムでアラートを送信します。 仕組み ATRとスーパートレンド係数を用いて指数ベースラインを算出。価格がこのベースラインを上抜け/下抜けした時点でトレンド反転を確認。緑矢印は買いトレンド開始、赤矢印は売りトレンド開始を示す。 特徴: ATRベースの動的チャネル付き指数トレンドベースライン 緑/赤で色分けされたトレンドラインと塗りつぶしチャネル トレンド反転時の買い/売り矢印シグナル 内蔵アラート:ポップアップ、プッシュ通知、メール、サウンド 重複アラート防止(1バーあたり1アラート) 完全カスタマイズ可能:色、線幅、矢印サイズ、チャネル幅 遅延のないクリーンなチャートオーバーレイ 入力パラメータ: 指数係数、スーパートレンド係数、ATR期間、チャネル幅 オン/オフ切り替え:チャネル塗りつぶし、矢印、各アラートタイプ 全視覚
FREE
Expert description Algorithm optimized for Nasdaq trading The Expert Advisor is based on the constant maintenance of long positions with daily profit taking, if there is any, and temporary interruption of work during the implementation of prolonged corrections The Expert Advisor's trading principle is based on the historical volatility of the traded asset. The values of the Correction Size (InpMaxMinusForMarginCallShort) and Maximum Fall (InpMaxMinusForMarginCallLong) are set manually. Recomm
FREE
FlatBreakout MT5 (Free Version) Flat Range Detector and Breakout Panel for MT5 — GBPUSD Only FlatBreakout MT5   is the free version of the professional FlatBreakoutPro MT5 indicator, specially designed for flat (range) detection and breakout signals on the   GBPUSD   pair only. Perfect for traders who want to experience the unique fractal logic of FlatBreakout MT5 and test breakout signals on a live market without limitations. Who Is This Product For? For traders who prefer to trade breakout of
FREE
FusionTrailing EA – Your Ultimate Weapon for Market Domination! Transform your trading and crush every market move with the most advanced trailing stop system available. FusionTrailing EA delivers unstoppable power with its dual-mode setup: • Fusion Mode: Automatically sets a bulletproof stop loss using a maximum loss threshold and activates smart trailing
Coral trend is   a trend-following indicator that is widely popular among FOREX traders . It is usually used as a confluence with other indicators. It uses combinations of moving averages with complex smoothing formulas! It has two configurable parameters: Coefficient   - smoothing ratio (*) Applied price Calculation: Coral = (-0.064) * B6 + 0.672 * B5 - 2.352 * B4 + 2.744 * B3
FREE
This EA was made for educational purposes.  You can find a full overview of how it was made in the YouTube video (Literally a step by step guide) We used AI and ML to create the whole thing, with no coding.  Can you trust this to make money? Possibly, but do so at your own risk.  It could be a nice addition to a large porfolio.  Big picture It’s a   trend + breakout system for buys , and a   pullback/fake breakout system for sells . It only checks signals when a new candle opens. Buy (Long) log
FREE
RSI abcd
Francisco Gomes Da Silva
4.33 (3)
RSI ABCDパターンファインダー:テクニカル戦略 1. インジケーターの仕組み 古典的RSI と ABCD調和パターン の自動検出を組み合わせたものです。 主要コンポーネント 標準RSI (調整可能な期間) 高値・安値マーカー (矢印) ABCDパターン (緑/赤の線) 過買(70)・過売(30)フィルター 2. MT5設定 period = 14 ; // RSI期間 size = 4 ; // 最大パターンサイズ OverBought = 70 ; // 過買水準 OverSold = 30 ; // 過売水準 Filter = USE_FILTER_ YES ; // 確認フィルター 3. 取引戦略 3.1. 買いエントリー(強気ABCD) 条件: RSIが以下を形成: 谷( A )→ 山( B )→ より高い谷( C ) D が過売域(30)より上だが C より下 確認:A-B-C-Dを結ぶ緑色の線 目標: TP1: B-Cの61.8% TP2: B-Cの100% ストップロス: D より下 3.2. 売りエントリー(弱気ABCD) 条件: RSIが以下を形成: 山( A
FREE
Value Chart Candlesticks
Flavio Javier Jarabeck
4.69 (13)
The idea of a Value Chart indicator was presented in the very good book I read back in 2020 , " Dynamic Trading Indicators: Winning with Value Charts and Price Action Profile ", from the authors Mark Helweg and David Stendahl. The idea is simple and the result is pure genius: Present candlestick Price analysis in a detrended way! HOW TO READ THIS INDICATOR Look for Overbought and Oversold levels. Of course, you will need to test the settings a lot to find the "correct" one for your approach. It
FREE
WaveTrend Plus
Nguyen Thanh Cong
5 (6)
Introduction WaveTrend Plus is an amazing oscillator that can detect optimal entry points in the market with high precision using complex computations of price and momentum. This version packs many improvements compared to the original WaveTrend such as cleaner visuals, oversold/overbought signals and divergence detection Signal Buy when oversold signal appear (green dot below) or when a bullish divergence is detected (green dashed line) Sell when overbought signal appear (red dot above) or
FREE
MACD Enhanced
Nikita Berdnikov
5 (3)
Introducing the MACD  Enhanced – an advanced MACD (Moving Average Convergence Divergence) indicator that provides traders with extended capabilities for trend and momentum analysis in financial markets. The indicator uses the difference between the fast and slow exponential moving averages to determine momentum, direction, and strength of the trend, creating clear visual signals for potential entry and exit points. Attention! To achieve the best results, it is recommended to adapt the indicator
FREE
Necessary for traders: tools and indicators Waves automatically calculate indicators, channel trend trading Perfect trend-wave automatic calculation channel calculation , MT4 Perfect trend-wave automatic calculation channel calculation , MT5 Local Trading copying Easy And Fast Copy , MT4 Easy And Fast Copy , MT5 Local Trading copying For DEMO Easy And Fast Copy , MT4 DEMO Easy And Fast Copy , MT5 DEMO The homeopathic indicator is also called the CCI indicator. The CCI indicator was proposed
FREE
OmniSignal Navigator – Smart Entries at Key Levels Trade Like a Professional  with this daily/weekly High-Low-Close indicator, designed for   scalping or intraday short term trading   and precision breakout trading. Suggested Timeframes to trade with: M5 |  DONT USE THE INDICATOR ON THE M1 TIMEFRAME!!! Why It Works   Perfect for Scalping/Intraday:   Targets key zones ( PDH/PDL/PDC & PWH/PWL/PWC ) on   M2, M3, M5, M15   timeframes. (Lower Timeframes = More Signals, Higher Timeframes = Le
FREE
Looks for strong price movements and draws levels upon their completion. You determine the strength of the movement yourself by specifying in the settings the number of points and the number of candles of the same color in a row in one direction. There are 2 types of building in the settings: extrenum - high / low close - close price You can also adjust the number of displayed levels and the number of candles for calculations. By default, the settings indicate 5 levels for 360 candles. That
FREE
My other indicators: https://www.mql5.com/en/market/product/156702   (FREE) https://www.mql5.com/en/market/product/153968 (FREE) https://www.mql5.com/en/market/product/153960 (FREE) This indicator displays higher timeframe candles directly on your lower timeframe chart, allowing you to monitor higher timeframe price action without switching between charts. It also plots session highs and lows for the Asia, London, and New York kill zones, giving you key liquidity levels directly on your chart.
FREE
Indicator and Expert Adviser  EA Available in the comments section of this product. Download with Indicator must have indicator installed for EA to work. Mt5 indicator alerts for bollinger band and envelope extremes occurring at the same time. Buy signal alerts occur when A bullish candle has formed below both the lower bollinger band and the lower envelope  Bar must open and close below both these indicators. Sell signal occur when A bear bar is formed above the upper bollinger band and upper
FREE
強力なNRTR(Nick Rypock Trailing Reverse)インディケーターをご紹介します。トレンドの反転を特定し、効果的なトレーリングストップレベルを設定することを目指すトレーダーにとって必須のテクニカルツールです。ニック・ライポックによって開発されたこのインディケーターは、常に変化する市場条件に適応する独自のアルゴリズムを採用しており、どんなトレーダーのツールキットにも欠かせない存在となっています。 以下は、トレーダーがこのインディケーターを使用する人気のある方法です: 1. トレンドの反転:NRTRインディケーターは、トレンドが反転する予兆があるときに明確なシグナルを生成します。インディケーターラインが価格チャートを交差することに注意し、トレンドの方向が変わる可能性を示します。 2. トレーリングストップ:NRTRは、トレンド市場で利益を保護する頼りになるトレーリングストップツールとしても機能します。価格が望む方向に動くと、NRTRラインが価格の下または上に動的に追随し、適応可能なストップロスレベルを提供します。 カスタマイズ可能なパラメータ:NRTRイン
FREE
IMPORTANT NOTE: This is a professional Trade Management Utility and on-chart assistant. It is NOT an automated trading robot. It does not open trades on its own. The UltraFast Trade Manager MT5 is the ultimate execution and risk-management suite designed to give you absolute control over your manual and algorithmic trades. When managing multiple positions, calculating complex net break-even points, or constantly monitoring the economic calendar, hesitation can lead to costly mistakes. This utili
FREE
このプロダクトを購入した人は以下も購入しています
SuperScalp Pro
Van Minh Nguyen
4.57 (21)
SuperScalp Pro — 高度なマルチフィルター対応スキャルピングインジケーターシステム SuperScalp Pro は、クラシックな Supertrend と複数のインテリジェントな確認フィルターを組み合わせた高度なスキャルピング用インジケーターシステムです。M1〜H4 のすべての時間足で効率的に機能し、特に XAUUSD、BTCUSD、および主要なFX通貨ペアに適しています。単体のシステムとして、また既存の取引戦略へ柔軟に統合して使用できます。 本インジケーターは 11 以上のフィルターを統合しており、短期・長期の EMA、トレンド判定に用いる 3 本の EMA、EMA スロープ(EMA slope)、RSI、ADX、出来高、VWAP、ボリンジャーバンドのブレイクアウト、MACD ダイバージェンスフィルターなどを含みます。スマートキャンドルフィルターはローソク足の終値を確認して弱いシグナルを排除し、3 本の EMA と MACD ダイバージェンスを組み合わせたトレンド認識メカニズムにより勝率の高いシグナルの選別を支援します。 SuperScalp Pro は ATR に基
Entry In The Zone and SMC Multi Timeframe is a real-time 2-in-1 market analysis tool that combines market structure analysis and a No Repaint BUY / SELL signal system into a single indicator, built on Smart Money Concepts (SMC) — a widely adopted framework used by professional traders to understand market structure. This indicator helps you see the market more clearly, make decisions based on structure rather than guesswork, and focus on high-probability zones where price is more likely to react
このインジケーターを購入された方には、以下の特典を 無料 で提供しています: 各トレードを自動で管理し、ストップロスとテイクプロフィットを設定し、戦略ルールに基づいてポジションを決済する補助ツール 「Bomber Utility」 様々な銘柄に合わせたインジケーターの設定ファイル(セットファイル) 「最小リスク」、「バランスリスク」、「待機戦略」 の3つのモードで使用できる Bomber Utility 用の設定ファイル このトレーディング戦略をすぐに導入・設定・開始できる ステップバイステップのビデオマニュアル ご注意: 上記の特典を受け取るには、MQL5のプライベートメッセージシステムを通じて販売者にご連絡ください。 オリジナルのカスタムインジケーター 「Divergence Bomber(ダイバージェンス・ボンバー)」 をご紹介します。これは、MACDのダイバージェンス(乖離)戦略に基づいた 「オールインワン」型のトレーディングシステム です。 このテクニカルインジケーターの主な目的は、価格とMACDインジケーターの間に発生するダイバージェンスを検出 し、将来の価格の動きを示す
Azimuth Pro
Ottaviano De Cicco
5 (6)
Azimuth Pro V2:MT5向けシンセティック・フラクタル構造分析と確認済みエントリー 概要 Azimuth Pro は Merkava Labs によるマルチレベルスイング構造インジケーターです。4つのネストされたスイングレイヤー、スイングアンカーVWAP、ABCパターン検出、3タイムフレーム構造フィルタリング、そして確定バーでの確認済みエントリー — 1つのチャートで、ミクロスイングからマクロサイクルまでを網羅するワークフロー。 これはブラインドシグナル製品ではありません。ロケーション、コンテキスト、タイミングを重視するトレーダーのための構造ファーストワークフローです。 V2発売記念オファー — Azimuth Pro V2をUSD 399で(次の100本)。最終価格:USD 499。 1. V2での変更点 シンセティック・マルチタイムフレームエンジン 上位タイムフレーム分析をMeridian Proと同じ独自のシンセティックアーキテクチャで一から再構築。よりクリーンなHTFコンテキスト、安定したライブ動作、従来のMTF同期問題なし。シンセティックエンジンは 固定比率タ
Gold Entry Sniper – ゴールドスキャルピング&スイングトレード用プロフェッショナル多時間足ATRダッシュボード Gold Entry Sniper は、XAUUSDや他の銘柄向けに正確な 売買シグナル を提供する、MetaTrader 5用の高度なインジケーターです。 ATRトレーリングストップロジック と 多時間足分析ダッシュボード を搭載し、スキャルピングからスイングトレードまで対応します。 主な特徴と利点 多時間足シグナル分析 – M1、M5、M15 のトレンドを同時表示。 ATRベースのトレーリングストップ – ボラティリティに応じて動的に調整。 プロ仕様のチャートダッシュボード – シグナル状況、ATRレベル、回帰線、売買方向を表示。 明確な売買マーカー – 自動矢印とテキストラベル。 エグジットアラートとトレード管理 – 利益確定のための自動検出。 完全カスタマイズ可能 – パネル位置、色、フォント、ATR/回帰設定を調整可能。 ゴールド(XAUUSD)に最適化 – M1〜M15のスキャルピングに最適、FXや指数、暗号資産にも対応。 Gold Entry
Quantum TrendPulse を ご紹介します。これは、   SuperTrend   、   RSI   、および Stochastic のパワーを 1 つの包括的なインジケーターに組み合わせて、取引の可能性を最大限に引き出す究極の取引ツールです。精度と効率を求めるトレーダー向けに設計されたこのインジケーターは、市場のトレンド、勢いの変化、最適なエントリー ポイントとエグジット ポイントを自信を持って特定するのに役立ちます。 主な特徴: SuperTrend 統合: 現在の市場動向に簡単に追従し、収益性の波に乗ることができます。 RSI精度: 買われすぎと売られすぎのレベルを検出し、市場の反転のタイミングに最適で、SuperTrendのフィルターとして使用されます。 確率的精度: 確率的振動を活用して、変動の激しい市場で隠れたチャンスを見つけます。SuperTrend のフィルターとして使用されます。 マルチタイムフレーム分析:   M5 から H1 または H4 まで、さまざまなタイムフレームで市場を常に把握します。 カスタマイズ可能なアラート: カスタム取引条件が満たされ
Gann Made Easy   は、ミスター・ギャンの理論を使用した取引の最良の原則に基づいた、プロフェッショナルで使いやすい外国為替取引システムです。 W・D・ガン。このインジケーターは、ストップロスとテイクプロフィットレベルを含む正確な買いと売りのシグナルを提供します。 PUSH通知を利用して外出先でも取引可能です。 ご購入後、取引方法の説明と優れた追加インジケーターを無料で入手するには、私にご連絡ください! おそらく、ギャンの取引手法についてはすでに何度も聞いたことがあるでしょう。通常、ギャンの理論は初心者のトレーダーだけでなく、すでにある程度の取引経験がある人にとっても非常に複雑なものです。なぜなら、ギャンの取引手法は理論的にはそれほど簡単に適用できるものではないからです。私はその知識を磨き、最良の原則を私の外国為替インジケーターに組み込むために数年を費やしました。 このインジケーターは非常に簡単に適用できます。必要なのは、それをチャートに添付し、簡単な取引推奨事項に従うだけです。このインジケーターは常に市場分析の仕事を行い、取引の機会を探します。適切なエントリーポイントを検
このインジケーターを購入すると、プロ仕様のトレードマネージャーを無料で差し上げます。 まず第一に、このトレーディングシステムがノンリペイント、ノンリドロー、ノンラグのインジケーターであることを強調する価値がある。これにより、手動取引とロボット取引の両方に理想的なものになっています。 オンラインコース、マニュアル、プリセットのダウンロード。 「スマートトレンドトレーディングシステム MT5」は、新規および経験豊富なトレーダー向けにカスタマイズされた包括的なトレーディングソリューションです。10以上のプレミアムインジケーターを組み合わせ、7つ以上の堅実なトレーディング戦略を備えており、多様な市場状況に対応する多目的な選択肢となっています。 トレンドフォロー戦略:トレンドを効果的に乗り越えるための正確なエントリーとストップロス管理を提供します。 リバーサル戦略:潜在的なトレンドの反転を特定し、トレーダーがレンジ相場を活用できるようにします。 スキャルピング戦略:高速で正確なデイトレードおよび短期取引のために設計されています。 安定性:すべてのインジケーターはノンリペイント、ノンリドロー、ノ
FX Trend NG:次世代マルチマーケット・トレンドインテリジェンス 概要 FX Trend NG は、複数の時間足に対応したプロフェッショナル向けトレンド分析およびマーケット監視ツールです。 市場全体の構造を数秒で把握することができます。 複数のチャートを切り替える必要はありません。どの銘柄がトレンド中なのか、どこでモメンタムが弱まっているのか、そしてどの時間足で強い整合性があるのかを瞬時に確認できます。 ローンチ特別オファー – FX Trend NG を $30(6ヶ月) または $80 永久ライセンス でご利用いただけます。 すでに Stein Investments のユーザーですか? -> メッセージを送信 して、プライベートグループへアクセスしてください。 セットアップや詳細情報が必要ですか? -> Stein Investments 公式ページ をご覧ください。 1. FX Trend NG が他と異なる理由 3ステート・トレンドロジック ― Buy と Sell だけではない • 多くのインジケーターは Buy または Sell の2状態のみを表示します。
OmniSync Projection
Antonio-alin Teculescu
5 (1)
Chronos Fractal Engine is an innovative price projection indicator for MetaTrader 5, designed to transform your technical analysis by intelligently identifying and projecting historical price patterns. Built upon an advanced correlation algorithm and the fractal principles of the market, this powerful tool visualizes potential future price movements, giving you a unique edge in your trading decisions. What is Chronos Fractal Engine? At its core, the Chronos Fractal Engine employs a sophisticat
ご紹介     Quantum Breakout PRO は 、ブレイクアウト ゾーンの取引方法を変革する画期的な MQL5 インジケーターです。 13年以上の取引経験を持つ経験豊富なトレーダーのチームによって開発されました。     クォンタム ブレイクアウト プロ   は、革新的でダイナミックなブレイクアウト ゾーン戦略により、あなたのトレーディングの旅を新たな高みに押し上げるように設計されています。 クォンタム ブレイクアウト インジケーターは、5 つの利益ターゲット ゾーンを備えたブレイクアウト ゾーン上のシグナル矢印と、ブレイクアウト ボックスに基づいたストップロスの提案を提供します。 初心者トレーダーにもプロのトレーダーにも適しています。 量子EAチャネル:       ここをクリック 重要!購入後、インストールマニュアルを受け取るためにプライベートメッセージを送ってください。 推奨事項: 時間枠: M15 通貨ペア: GBPJPY、EURJPY、USDJPY、NZDUSD、XAUUSD アカウントの種類: ECN、Raw、またはスプレッドが非常に低い R
Power Candles – あらゆる市場に対応した強度ベースのエントリーシグナル Power Candles は、Stein Investments が長年培ってきた強度分析を価格チャート上に直接反映します。価格だけに反応するのではなく、各ローソク足は実際の市場の強さに基づいて色分けされ、モメンタムの蓄積、強度の加速、明確なトレンド転換を瞬時に把握できます。 すべての市場に共通する単一ロジック Power Candles は すべての取引シンボル で自動的に動作します。現在のシンボルが Forex か非 Forex 市場かを自動判別し、内部で適切な強度モデルを適用します。 Forex および Gold :FX Power のデルタ値を使用(絶対値レンジ最大 100) 指数、暗号資産、CFD :IX Power の強度値を使用(絶対値レンジ最大 50) 必要な強度計算は Power Candles に直接組み込まれています。ローソク足のカラーリングやシグナルロジックに、追加のインジケーターは不要です。 価格ノイズではなく「強度状態」 各ローソク足は、以下の 9 つの明確に定義された強
CGE Trading Suite
Carl Gustav Johan Ekstrom
5 (2)
Institutional-Grade Analytics for MT5 C GE Trading Suite delivers the analytical edge typically reserved for professional trading desks. The platform integrates a full suite of analytical tools into one seamless workflow: dynamic grid mapping, liquidity behavior analysis, ECM, trend lines, MIDAS, trade cycles, and directional channel projections. Together, these provide a unified view of market structure and momentum. Directional clarity is further enhanced by the capital flow index, which meas
あなたのシンボルでどの戦略が実際に機能するか確認しましょう - リアルマネーをリスクにさらす前に。 Power Barは、あらゆるシンボルとあらゆるタイムフレームで 極端な価格バー を検出し、3つの異なるトレード戦略を即座にバックテストします。勝率、プロフィットファクター、損益を並べて比較できます。すべてが1つのインタラクティブなパネルに集約されています。 推測なし。カーブフィッティングなし。データだけです。 Power Barが特別な理由 ほとんどのインジケーターはシグナルを出すだけで、それが機能するかどうかは推測に任されます。Power Barはさらに先を行きます - すべてのシグナルを 3つの戦略 に対してテストし、統計を表示します。FlipFlop、Momentum、Reversalをワンクリックで切り替え、数値が即座に変化するのを確認できます。 FlipFlop - 常にポジションを保有。シグナルでエントリーし、反対シグナルでイグジット。当社のリサーチでは、US30、US500、DAXなどのトレンドのあるインデックスで最も効果的です。 Momentum - シグナルの方向に
Meridian Pro
Ottaviano De Cicco
5 (1)
Meridian Pro:MT5用プロフェッショナル・マルチタイムフレーム・トレンドマトリックス 概要 Meridian Pro は Merkava Labs が開発したマルチタイムフレーム・トレンドマトリックスで、方向性の状態、強度、モメンタムの状況、マトリックスの合意をひとつのコンパクトなパネルに集約します。ひとつのアダプティブエンジンがM1からW1まで一貫して適用されます。シンボルごとの調整は不要。インジケーターの積み重ねも不要。すべてのアセットとすべてのタイムフレームをカバーするひとつの構造化された読み取りです。 発売キャンペーン — Meridian Proを USD 99 (導入価格)で入手。通常価格:USD 149 。 1. Meridian Proが他と異なる理由 ひとつのエンジン、バラバラなインジケーターのダッシュボードではない 多くのMTFダッシュボードは、タイムフレームごとに生のインジケーター値を繰り返すだけです。Meridian Proはマトリックス全体でひとつのアダプティブ・トレンドエンジンを使用するため、パネルの各行が同じ構造化フレームワークから導出されます
優れたテクニカルインジケーター「Grabber」をご紹介します。これは、すぐに使える「オールインワン」トレーディング戦略として機能します。 ひとつのコードに、市場のテクニカル分析ツール、取引シグナル(矢印)、アラート機能、プッシュ通知が強力に統合されています。 このインジケーターを購入された方には、以下の特典を無料で提供します: Grabberユーティリティ:オープンポジションを自動で管理するツール ステップバイステップのビデオマニュアル:インジケーターのインストール、設定、取引方法を解説 カスタムセットファイル:インジケーターをすばやく自動設定し、最大限の成果を出すための設定ファイル 他の戦略はもう忘れてください!Grabberだけが、あなたを新たなトレードの高みへと導いてくれるのです。 Grabber戦略の主な特徴: 推奨タイムフレーム:M5〜H4 対応通貨ペア・資産:どれでも使用可能ですが、私が実際に検証した以下を推奨します(GBPUSD、GBPCAD、GBPCHF、AUDCAD、AUDUSD、AUDSGD、AUDCHF、NZDUSD、NZDCAD、EURCAD、EURUSD、E
まず正直に言いましょう。 どんなインジケーターも、それ単体であなたを利益化させることはできません。もしそう言う人がいるなら、それは夢を売っているだけです。完璧な売買シグナル(矢印)を表示するインジケーターは、いくらでも“完璧に見せる”ことができます。正しい過去の区間を拡大して、勝ちトレードだけを切り取ればいいだけです。私たちはそれをしません。 SMC Intraday Formula はツールです。 市場構造を読み取り、最も高い確率の価格ゾーンを特定し、今この瞬間のスマートマネーの痕跡をシンプルな言葉で正確に示します。最終判断はあなたが行います。トレードを実行するのもあなたです。しかし今は「希望」ではなく「精度」でエントリーできます。 私たちはこのインジケーターを、ゴールド(XAUUSD)および主要FX通貨ペアで約3年間、日々のスキャルピングに使用してきました。M1、M5、M15、M30の主要ツールです。これは未来を予測しようとするのではなく、今まさに形成されている高確率セットアップを示し、その理由を説明します。 他のすべてのインジケーターと何が違うのか? ほとんどのトレーディングイ
トレンド スクリーナー インジケーターでトレンド取引の力を解き放ちます。ファジー ロジックと複数通貨システムを活用した究極のトレンド取引ソリューションです。 ファジー ロジックを活用した革新的なトレンド インジケーターである Trend Screener を使用して、トレンド取引を向上させます。 これは、13 を超えるプレミアム ツールと機能、および 3 つの取引戦略を組み合わせた強力なトレンド追跡インジケーターであり、Metatrader をトレンド アナライザーにする多用途の選択肢となります。 期間限定オファー : トレンド スクリーナー インジケーターは、わずか 100 ドルで生涯ご利用いただけます。 (元の価格 50$ ) (オファー延長) Trend Screener の 100% 非再描画精度の揺るぎない精度を体験して、取引の決定が過去の価格変動の影響を受けないようにしてください。 マルチタイムフレームおよびマルチ通貨機能の多用途性を解放し、比類のない自信を持って外国為替、商品、暗号通貨、インデックスの世界を取引できるようにします。 Trend Screener の包括的な
BTMM State Engine Pro is a MetaTrader 5 indicator for traders who use the Beat The Market Maker approach: Asian session context, kill zone timing, level progression, peak formation detection, and a multi-pair scanner from a single chart. It combines cycle state logic with a built-in scanner dashboard so you do not need the same tool on many charts at once. What it does Draws the Asian session range; session times can follow broker server offset or be set in inputs. Tracks level progression (L
まず第一に、この取引インジケーターは再描画されず、再描画されず、遅延しないことを強調する価値があります。これにより、手動取引とロボット取引の両方に理想的なものになります。 ユーザーマニュアル:設定、入力、戦略。 アトミックアナリストは、価格の強さとモメンタムを利用して市場でより良いエッジを見つけるためのPA価格アクションインジケーターです。ノイズや誤ったシグナルを除去し、取引ポテンシャルを高めるための高度なフィルターを備えています。複雑なインジケーターの複数のレイヤーを使用して、アトミックアナリストはチャートをスキャンし、複雑な数学的計算をシンプルなシグナルと色に変換します。これにより、どのような初心者トレーダーでも理解して使用し、一貫した取引の決定を行うことができます。 「アトミックアナリスト」は、新規および経験豊富なトレーダー向けにカスタマイズされた包括的な取引ソリューションです。プレミアムインジケーターとトップノッチの機能を1つの取引戦略に組み合わせ、すべてのタイプのトレーダーにとって汎用性のある選択肢にします。 デイリートレーディングとスキャルピング戦略:高速で正確なデイ
Smart Stop Indicator – チャート上で実現するインテリジェントなストップロス精度 概要 Smart Stop Indicator は、ストップロスを勘や感情ではなく、明確で体系的に設定したいトレーダーのために設計されています。本ツールは、クラシックなプライスアクション(高値更新・安値切り下げ)と最新のブレイクアウト認識ロジックを組み合わせ、次に来るべき論理的なストップレベルを正確に特定します。トレンド相場、レンジ、急速なブレイクアウト局面のいずれであっても、最適な SL ゾーンとその状態(“new”、“broken”、“valid”)をチャート上に直接表示します。さらに今回、SL 距離の %ADR 表示も新たに追加されています。 主な特徴 マーケット構造に基づく自動ストップ配置 • 市場構造とリアルタイムの値動きに基づき、意味のあるストップロスレベルを自動検出します。 スマートなブレイクアウト感知 • 急激な方向転換やブレイクアウトにも柔軟に対応し、早すぎるストップ調整を避けます。 SL %ADR の表示 • ストップロスまでの距離を ADR(Averag
Crystal Heikin Ashi Signals - Professional Trend & Signal Detection Indicator Advanced Heikin Ashi Visualization with Intelligent Signal System for Manual & Automated Trading Final Price: $149 ---------> Price goes up $10 after every 10 sales . Limited slots available — act fast . Overview Crystal Heikin Ashi Signals is a professional-grade MetaTrader 5 indicator that combines pure Heikin Ashi candle visualization with an advanced momentum-shift detection system. Designed for both manual traders
FX Power: 通貨の強弱を分析して、より賢い取引を実現 概要 FX Power は主要通貨と金の実際の強弱をあらゆる市場状況で理解するための必須ツールです。強い通貨を買い、弱い通貨を売ることで、 FX Power は取引の意思決定を簡素化し、高い確率の取引機会を見出します。トレンドを追従する場合でも、極端なデルタ値を使用して反転を予測する場合でも、このツールはあなたの取引スタイルに完全に適応します。ただ取引するだけではなく、 FX Power で賢く取引をしましょう。 1. なぜ FX Power がトレーダーにとって非常に有益なのか 通貨と金のリアルタイム強弱分析 • FX Power は主要通貨と金の相対的な強弱を計算し、マーケットダイナミクスに関する明確な洞察を提供します。 • どの資産がリードしているか、または後れを取っているかを監視して、取引するペアを賢く選びましょう。 マルチタイムフレームの包括的なビュー • 短期、中期、長期のタイムフレームで通貨と金の強弱を追跡し、マーケットトレンドに基づいて取引戦略を調整できます。 • スキャルピングからスイングトレード
Auto Optimized Parabolic RSI: 高度な3Dモメンタムエンジン ほとんどのリテール向けインジケーターは、市場のボラティリティが変化した瞬間に破綻する静的な入力値に依存しているため、失敗に終わります。Auto Optimized Parabolic RSIは、自らの数学的優位性を継続的に再計算することで「インジケーターの陳腐化」問題を解決し、機関投資家レベルの定量的適応力をMT5ターミナルに直接もたらします。 最大の強み: カスタムインメモリ3D最適化 標準的な自動最適化ツールは、インジケーターの呼び出しで端末に過負荷をかけるため、頻繁にMT5プラットフォームをフリーズさせます。本ツールは、このボトルネックを完全に回避しています。RAMベースのカスタムネイティブ計算機を内蔵した内部エンジンは、チャートを読み込んだりタイムフレームを変更したりするたびに、超高速の3Dグリッド探索を実行します。RSI期間(頻度)、SARステップ(加速度)、SAR最大値(制限速度)を同時にスイープし、プラットフォームを遅延させることなく、数万通りものパラメーターの組み合わせを絶対的なミ
RelicusRoad Pro: 定量的市場オペレーティングシステム 【期間限定】無制限アクセス 70% OFF - 2,000人超のトレーダーと共に なぜ多くのトレーダーは「完璧な」インジケーターを使っても失敗するのでしょうか? それは、文脈を無視して 単一の概念 だけでトレードしているからです。文脈のないシグナルは単なるギャンブルです。勝ち続けるには、 根拠の重なり(コンフルエンス) が必要です。 RelicusRoad Proは単なる矢印インジケーターではありません。完全な 定量的市場エコシステム です。独自のボラティリティモデリングを用いて、価格が推移する「適正価値の道(Fair Value Road)」をマッピングし、ノイズと真の構造的ブレイクを判別します。 推測はやめましょう。機関投資家レベルの「ロード・ロジック」でトレードを。 コアエンジン:「Road」アルゴリズム システムの中心となる Road Algo は、市場環境にリアルタイムで適応するダイナミックなボラティリティチャネルです。 安全ライン(平衡点) と、価格が数学的に反転しやすい 拡張レベル を投影します。 Si
Market Structure Order Block Dashboard MT5 は、チャート上でマーケットストラクチャーと主要な価格反応ゾーンを直接読み取りたいトレーダー向けに設計された MT5 インジケーターです。BOS、ChoCH、Order Blocks、Fair Value Gaps (FVG)、Liquidity、Kill Zones、Volume Profile、そして高速分析のためのコンパクトな dashboard を組み合わせています。 このインジケーターは、マーケットストラクチャー、ICT コンセプト、Smart Money コンセプトを意思決定の基準として使うトレーダー向けに作られています。トレンド継続、反転の可能性、価格の不均衡、流動性ターゲット、重要な注目ゾーンを、より構造的に把握するのに役立ちます。 Version 1.19 では重要な機能が追加されました。 Pending BOS / Pending ChoCH detection です。ローソク足が前回の swing を超えてクローズすると、標準的な swing 確認を待たずに、インジケーターが pe
ARICoin is a powerful trading companion designed to generate high-probability entry signals with dynamic TP/SL/DP levels based on volatility. Built-in performance tracking shows win/loss stats, PP1/PP2 hits, and success rates all updated live. Key Features: Buy/Sell signals with adaptive volatility bands Real-time TP/SL/DP levels based on ATR Built-in MA Filter with optional ATR/StdDev volatility Performance stats panel (Success, Profit/Loss, PP1/PP2) Alerts via popup, sound, push, or email Cust
ARIPoint is a powerful trading companion designed to generate high-probability entry signals with dynamic TP/SL/DP levels based on volatility. Built-in performance tracking shows win/loss stats, PP1/PP2 hits, and success rates all updated live. Key Features: Buy/Sell signals with adaptive volatility bands Real-time TP/SL/DP levels based on ATR Built-in MA Filter with optional ATR/StdDev volatility Performance stats panel (Success, Profit/Loss, PP1/PP2) Alerts via popup, sound, push, or email Cu
MERAVITH SCANNERは、MetaTrader 5用のプロフェッショナルな金融市場インジケーターで、複数の分析ツールを一つの統合システムにまとめています。独自の出来高加重平均価格(VWAP)手法を使用してすべての計算を自動で行い、主観的な解釈を完全に排除します。 このインジケーターは、すべての資産クラス(FX、株式、指数、商品、暗号通貨)およびM1から月足までのすべての時間軸で動作します。基本原理は「価格は出来高に従う」というものです。MERAVITHは機関投資家の出来高が集中するポイントを特定し、その集中から数学的に正確な価格レベルを導き出します。予測や投機は行わず、計算のみを行います。 MERAVITH SCANNERを使用すると、28の主要FX通貨ペアをすべての時間軸でわずか2~3分でスキャンできます。また、任意の市場をスキャンすることも可能です。例えば、約100銘柄の株式を約10分でスキャンできます。 インジケーターは、消耗レベル、均衡線、偏差、統計レベル、およびターゲット予測を算出します。 チャート要素 Origin Point :すべての計算が始まる起点です。イン
Market Structure Patterns
Samuel Manoel De Souza
4.47 (19)
Available for   MT4   and   MT5 . Join the Market Structure Patterns channel to download materials available for study and/or additional informations. Related posts: Market Structure Patterns - Introduction Beyond Fancy Order Blocks: Using True Volumetric Analysis with Market Structure Patterns & Timeless Charts Market Structure Patterns – Complete SMC Indicator Guide (Concepts + Settings) Market Structure Patterns   is an indicator based on   smart money concepts   that displays   SMC/ICT   e
作者のその他のプロダクト
Morvan
Nguyen Thanh Trieu
MORVAN 私はMorvanです。 方向を読み、構造を待ち、価格が動きが展開する可能性が最も高いレベルに達した時にのみ仕掛けます。 推測なし。リベンジトレードなし。ノイズの中でローソク足を追いかけることなし。 構造が揃った時にのみ執行し、エントリーからエグジットまで全てのポジションを規律を持って管理します。 ほとんどのトレーダーはチャートが読めないから負けるのではありません。エントリーが遅すぎ、ポジションサイズが緩すぎ、流動性が狙うところにストップを置き、感情が出口判断を上書きするから負けるのです。 私はその弱点を排除するために設計されました。 私は市場を予測しません。する必要がないのです。 バイアスを読み、構造の形成を待ち、継続またはブレイクアウトがより高い確率の結果となるゾーンに価格が到達した時にのみ展開します。 運用方法 私の執行フレームワークは3つの原則に基づいています: トレンドが第一。構造が第二。リスクは常に。 まず、上位時間軸の構造から支配的な市場方向を読みます。方向が不明確なら、ポジションを取りません。 次に、継続圧力が最も強い価格ゾーンを見つけます。ノイズには飛び込
Manual position management. Missing SL. Price moves against you. No protection. Trade Manager Lite automates Stop Loss, Take Profit, Trailing Stop, and Break-Even for your open positions. Attach to one chart. Configure your default SL/TP distance. Let it manage your positions automatically. What's Included (FREE Version) Auto SL/TP: Applies missing Stop Loss and Take Profit to positions based on your configured distance in points Trailing Stop: Adjusts SL dynamically as price moves in your favor
FREE
SMC Liquidity Channel Guard Prices reverse just as your breakout trade triggers. Account suffers unexpected drawdown. Because standard channels ignore institutional liquidity sweeps and trap retail stop-loss orders. This utility automatically monitors highest buy-side and lowest sell-side liquidity pools to flag false breakouts. Key Features: Dynamic Liquidity Tracking: Maps Buy-Side (BSL) and Sell-Side (SSL) boundaries without lagging moving averages. Sweep Identification: Prints precise direct
FREE
ファンド口座。一度のロット計算ミス。ドローダウン上限を突破。口座閉鎖。 戦略が悪かったのではない。執行の瞬間にリスクが管理されていなかったからだ。 Trade Command Center はビジュアル注文執行・リスク管理パネルです。 SL距離からロットを計算。ポジションを自動管理。ドローダウン上限をリアルタイム監視。 5タブ。1チャートパネル。DLLなし。外部接続なし。 正確な執行とプロップファーム準拠を必要とする裁量トレーダー向けに設計。 FTMOおよびMFFルールのプリセット内蔵。日次損失、週次損失、エクイティ・ドローダウン、フローティング損失に対応。 コア機能 ビジュアル・トレード・プランニング: チャート上でEntry、SL、TPボックスをドラッグ。ロット、ピップス距離、ドル金額、R:Rをリアルタイム表示。ワンクリック執行。 リスク計算: リスクモードを選択 — 残高比率、固定金額、固定ロット。パネルがポジションサイズを自動計算。 マルチレベル・テイクプロフィット: 最大5段階の部分決済。各レベルに独自のトリガー距離と決済割合。 オーバーライド付きブレイクイーブン: グローバ
NFP発表時の価格急騰。日次損失限度額が数秒で超過。口座が制限されました。 これは、高ボラティリティイベント中に証拠金が手動反応より速く低下するときに発生します。 PropFirm Risk Guardは、証拠金をリアルタイムで監視し、定義した限度額に近づくと自動的に反応します。 厳格なリスク規則を持つプロップファームチャレンジ向けに設計:FTMO、The5ers、Funded Trading Plus、MFF。 パーセンテージベース(日次5%、最大10%)および米ドルベースのドローダウン計算の両方をサポートし、異なる企業の要件に対応します。 高ボラティリティシナリオに最適化:金(XAUUSD)取引、主要指数、ニュースイベント、オーバーナイトギャップ。 主な機能: リアルタイム証拠金監視: 日次および口座のドローダウンを100ミリ秒ごとに追跡します。限度額に近づくと反応し、さらなる損失を防ぎます。 ソフト/ハード保護モード: ソフトモードは、ポジションを閉じる前にカウントダウンタイマー付きの警告を提供します。ハードモードは即座に実行します。反応スタイルを選択できます。 決済済み損益の時
Volume Pressure Meter breakdown tick volume to reveal the buying and selling pressure inside every candle. Unlike standard volume which only shows total activity, this indicator splits volume to show who is actually in control of the market. It helps you identify trend strength and spot potential reversals through volume divergence. Key Features: Pressure Gauge: Visual bar showing real-time Buy vs Sell percentages. Trend Bias: Automatically identifies if the market is dominated by Buyers or Sell
FREE
大きなボディを持つローソク足が確定。ブレイクアウトのように見える。エントリー。 次のバーが反転し、ストップアウト。出来高は平均的で、モメンタムはすでに衰えていた。 Impulse Momentum Shift は真のインパルスを持つバーを識別し、そのインパルスが反転する瞬間をマークします。 多くのトレーダーはローソク足のサイズだけを見ます。しかし本物のインパルスには3つの要素が必要です:ボディの支配性、直近平均を上回る出来高スパイク、そしてATRで正規化された方向性モメンタム。 このインジケーターは3次元すべてで各バーをスコアリングし、5色のインパルスカラースケールでチャートをペイントし、強いインパルスフェーズが方向を反転させた瞬間にシフト矢印を配置します——確定済みバーのみ。 表示内容: 5色インパルスキャンドル: 強い強気インパルスはブライトブルー、中程度はライトブルー、中立はグレー、中程度の弱気はコーラル、強い弱気はクリムゾン。各バーはリアルタイムで0〜100のスコアを取得 Impulse Trail ライン: ATRベースの動的ラインで、支配的なインパルス方向にラチェット式に追
FREE
Smart Session Box Displays Asia, London, and New York trading sessions with automatic timezone adjustment and session overlap highlighting. Main Features Complete session analysis with no limitations. Key Features The indicator draws session boxes with high and low lines for each trading session. Session overlaps are highlighted with distinct colors to identify high liquidity periods. Breakout alerts notify when price crosses previous session levels. A control panel provides quick toggles for al
FREE
Smart Confluence Radar 3つの指標を個別に分析してコンフルエンスを見つけるには時間がかかります。マルチタイムフレームのオーバーレイ、アラート、セッションフィルターについては、 Smart Confluence Radar Advanced をご覧ください。 Smart Confluence Radar は、ATR 拡張、出来高モメンタム、変化率を1つの視覚的なレイヤーにまとめ、ローソク足に直接重ねて表示します。 表示内容: 色付きローソク足: 明るい色 = 高コンフルエンス(スコア ≥70)。薄い色 = 中。グレー = 低モメンタム。 モメンタムライン: チャートに描画。青 = 買い圧力、赤 = 売り圧力、グレー = 中立。 バーラベル(+/-): 高コンフルエンスの確定バーのみ表示。上昇バーの下に "+"、下降バーの上に "-"。 バーカウントダウン: 右上 — 現在の時間足と残り秒数。 適用場面: ゴールド(XAUUSD)、主要通貨ペア、指数の日中取引。M5〜H4。 このツールができないこと: 売買シグナルを自動生成しません。 将来の価格動向を予測しません。
FREE
Smart Entry Levels - Fractal and ATR Based Indicator Smart Entry Levels identifies key support and resistance zones using classical fractal detection and ATR-based volatility measurement. The indicator is designed for clarity, stability, and compliance with MQL5 Market rules. Features Upper Zone - Resistance area based on recent fractal highs Lower Zone - Support area based on recent fractal lows ATR-based sizing - Zones adapt dynamically to market volatility with selectable timeframe Non-repain
FREE
Volume Pressure Meter MT5 ローソク足は強く見えた。出来高は高く見えた。ブレイクアウトでエントリーした。 数分で価格が反転した。その動きには真の参加がなかった。 Volume Pressure Meterは機関投資家が見ているものを明らかにする:価格の動きの背後に実際の買い圧力または売り圧力が存在するか、それとも空虚な出来高に対してトレードしているか。 M5からH4のタイムフレームでゴールド(XAUUSD)、インデックス、主要外国為替ペアを分析するイントラデイおよびスイングトレーダー向けに設計されています。8つの機関レベルの出来高分析ツールを、AIパターン認識とリアルタイム確率計算を備えた1つの統合システムに融合しています。 表示内容 HUD(ヘッドアップディスプレイ)インターフェース: シグナルステータス: 現在の市場推奨(BUY、SELL、WAIT、AVOID)をリアルタイムで更新 圧力バランスゲージ: 買い手と売り手の参加を色分けされた強度で視覚的に表現 シグナルスコア: 複数の出来高確認要素に基づく0から10までの強度評価 勝率確率: 現在の条件と過去の
Murrey Math Channels Identifying key market reversal points and core trading ranges can be challenging. Traditional analysis often lacks clear mathematical structure, leading to inconsistent entries. Murrey Math Channels provides a mathematically grounded price framework based on the Law of Octaves to help traders define precise support, resistance, and reversal zones. How to Read the Chart: The indicator divides the price action into 8 main octaves (levels), each representing a different marke
FREE
You read the breakout correctly. Price pushed through the level. You entered. Then it reversed — and stopped you out before the real move happened. GoldStructure Pro identifies that pattern before you enter, not after. Gold fakes breakouts constantly. A candle closes above resistance, volume looks right, structure seems clear — then price snaps back and hunts your stop. Most indicators cannot separate a confirmed expansion from a liquidity sweep. GoldStructure Pro classifies every breakout in re
良いセットアップ。間違った市場状態。トレードは実行される前に無効になる。 広いスプレッド、セッション外の時間帯、ボラティリティの急騰、高インパクトニュースへの近接——すべてが実行前にエッジを破壊する。 Market Bias Monitor はライブ環境を分類し、実行品質を0から100でスコアリングし、条件が変化した瞬間に通知します。 ゴールド(XAUUSD)、Forex通貨ペア、インデックスをM5からW1のタイムフレームで分析する裁量および半自動トレーダー向けに設計されています。レジーム、セッション、スプレッド、ニュースリスク、マルチタイムフレームバイアスのアラインメントをリアルタイムで監視します。 何を表示するか: 市場レジーム分類: ATRボラティリティと移動平均からの価格偏差を使用してTREND、RANGE、TRANSITION、またはHIGH RISKを識別——不安定なレジーム中の実行を回避するために。 Market Quality Score(0-100): レジーム、スプレッド、ボラティリティ、セッション、バイアスの明瞭度、ニュース近接度からの複合スコア——条件を客観的に
ターミナルを開きます。3つのポジションが動いています。チャートが動いています。 しかし、ロンドンは今本当にアクティブですか?それともニューヨーク前のノイズですか? Session Pulse Monitorは、取引セッションのリアルタイムステータス、ボラティリティコンテキスト、各ポジションのエントリーセッションをチャート上に直接表示します。 複数のセッションにまたがってポジションを管理し、市場に機関投資家の参加があるかを知る必要があるトレーダー向けに設計されています。 すべてのシンボルで動作 — ゴールド(XAUUSD)、主要FX通貨ペア、インデックスに最適化。 表示内容: リアルタイムセッションステータス: アジア、ロンドン、ニューヨークのLIVE/カウントダウン表示。 ボラティリティコンテキスト: 各セッションの過去のボラティリティ状態(HIGH / MED / LOW)を表示。 トレードタギング: 各オープンポジションにエントリーセッション(アジア、ロンドン、ニューヨーク、重複)を表示。 セッションカウントダウン: アクティブセッションの残り時間と次のセッションの開始時間。 この
FREE
Parabolic Trend Corridor Identifying trend direction and volatility boundaries is a common challenge for day traders. Standard indicators often lack a holistic view of both trend structure and market noise. Parabolic Trend Corridor solves this by combining the adaptive nature of Parabolic SAR with dynamic ATR volatility bands. Key Features: Adaptive Trend Core: Uses Parabolic SAR as the foundation to follow price movement and volatility changes without lag. Dual-Color Cloud: Dynamic visual feedb
FREE
Keltner Breakout Caught in market chop. Fake breakouts trigger unwanted trades. Because standard indicators lack dynamic volatility context. This utility automatically combines a Dynamic Volatility Channel, Dual MA trend detection, and RSI momentum filtering into one visual system. Key Features: Trend Cloud: Visually fills the trend zone with a dynamic Keltner-style volatility channel. Multi-Factor Breakout: Only issues a signal when price breaks the volatility channel AND trend/momentum confirm
FREE
SMC Liquidity Channel Guard Premium レジスタンスを上抜けブレイクアウト。ストップロスはすぐ下に設置。 価格は即座に反転——本当の動きが始まる前にリテールのエントリーを罠にかける流動性スイープ。 SMC Liquidity Channel Guard Premiumは、機関投資家の流動性プールをリアルタイムでマッピングし、方向性トレンドロジックでスイープをフィルタリングし、マルチタイムフレームのコンテキストで確認済みセットアップを提供します。 ゴールド(XAUUSD)、インデックス、主要FXペアをM5からD1で分析するSmart Money Conceptトレーダー向けに設計。構造的流動性境界における機関投資家のストップハント行動の特定に最適化。 表示内容: ダイナミック流動性チャネル: バイサイド(BSL)とセルサイド(SSL)の境界をマッピング——ストップロスクラスターの蓄積場所を確認 機関スイープ検出: 価格が流動性プールを突破してもチャネル内で引ける場合を特定——ストップハント反転を発見 高確信シグナル: スイープがトレンドフィルターと一致した
活発に見える市場で取引を開始。しかしセッション終了まで残り12分。 流動性が低下し、スプレッドが拡大。ポジションは方向感なく漂う。 Session Pulse Monitor Advancedはリアルタイムのセッション分析を提供 — ライブ状態、過去のパフォーマンス統計、チャート上のビジュアルゾーン、ATR予測、セッション切替アラート — 常にどのセッションで取引しているかを把握できます。 アジア、ロンドン、ニューヨークセッションでポジションを管理するトレーダー向けに設計。単なる時計以上の機能を提供。 全シンボルに対応 — ゴールド(XAUUSD)、主要FX通貨ペア、セッション切替時に最も大きな価格変動が生じるインデックスに最適化。 主な機能: リアルタイムセッションパネル: アジア、ロンドン、ニューヨークセッションのLIVE/カウントダウン表示。ティックごとに更新。 セッション別パフォーマンス統計: セッションごとの勝率、平均損益、取引数 — 30日間の口座履歴から算出。どのセッションが戦略に合っているかを把握。 セッションハイライトゾーン: 過去5日間の各セッションにカラーコード付
構造は確認済み。オーダーブロックも一致。ブレイクアウトでエントリーした。 価格は40pips反転した。プレミアムゾーン、FVGのサポートなし、キルゾーン時間外だったことを見逃していた。 3つの要素が「ノー」と言っていた。確認したのは1つだけだった。 SMC Confluence Score MT5 は8つの機関投資家分析レイヤーを同時にスキャンし、ブル/ベアのコンフルエンススコア(0-10)をリアルタイムで出力します。 インジケーターやタイムフレームを切り替える代わりに、トレード前にすべてのSMC要素を1つのパネルで確認できます。 表示内容: コンフルエンススコア (0-10): OB、FVG、構造、ゾーン、セッション、流動性、HTF方向を1つの数値に統合。セットアップの質を一目で把握。 市場構造 (BOS + CHoCH): スイングと内部レベルの検出。エントリー前にトレンド転換を確認。 強度評価付きオーダーブロック: 未消化OBの出来高ベース強度インジケーター。機関がポジションを置いているゾーンを優先。 フェアバリューギャップ (FVG): ATRフィルター済みの不均衡のみ。ノイズ
Many pullbacks look tradable for a moment, but the expensive mistake comes from treating every retracement as equal. The real workflow problem is deciding whether the pullback is still worth your attention, whether it is only building, or whether it should be ignored completely. Pullback Execution Map Confluence is built as a decision-first pullback engine: it separates WAIT, BUILD, READY and AVOID conditions before it draws a full execution plan. What this version adds: Decision states instead
フィルタ:
レビューなし
レビューに返信