Time Levels
- インディケータ
- バージョン: 1.3
- アップデート済み: 26 11月 2021

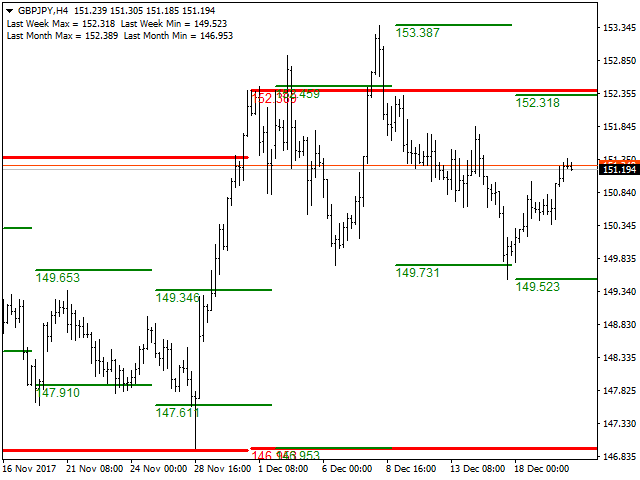
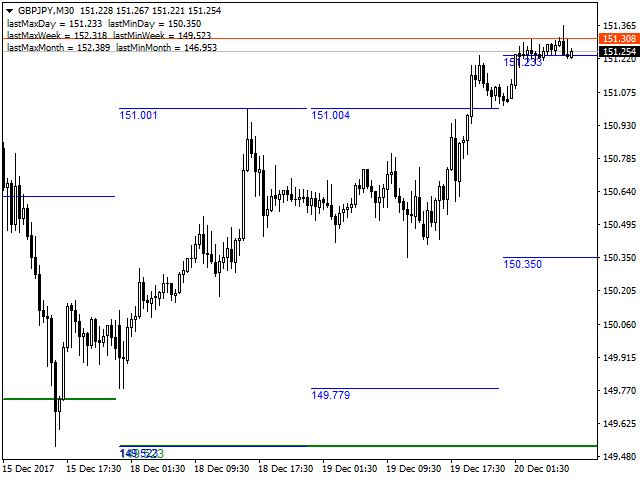
The indicator is designed for displaying the following price levels on the chart:
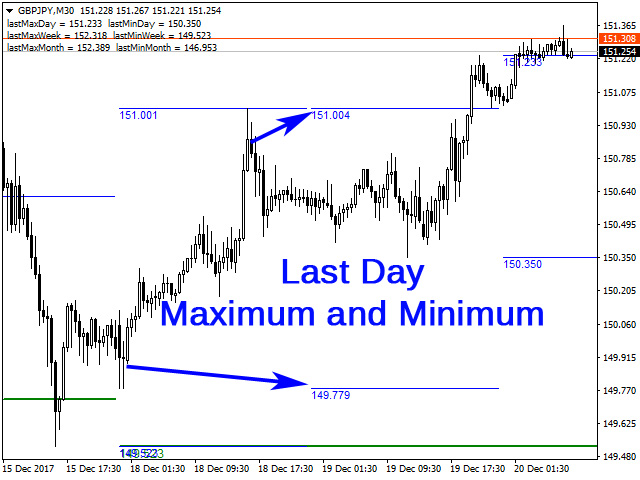
- Previous day's high and low.
- Previous week's high and low.
- Previous month's high and low.
Each of the level types is customizable. In the indicator settings, you set line style, line color, enable or disable separate levels. The version of the exact same indicator but only with sound alerts there - Time Levels with Alerts.
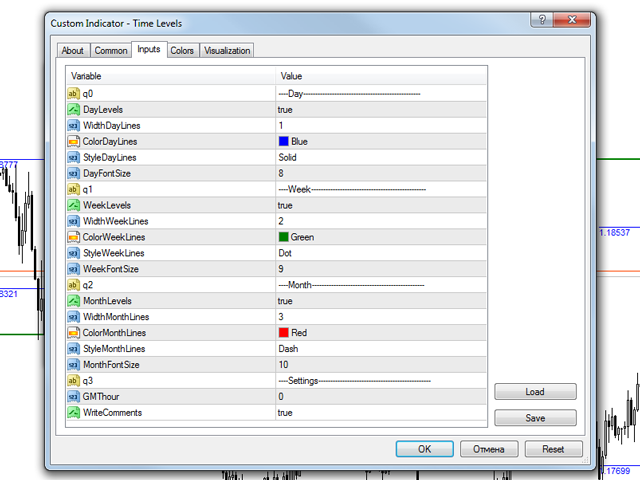
Configurations
- ----Day-------------------------------------------------
- DayLevels - enable/disable previous day's levels.
- WidthDayLines - line width of daily levels.
- ColorDayLines - line color of daily levels.
- StyleDayLines - line style of daily levels. The parameter only works if WidthDayLines =1.
- DayFontSize - font size for the daily level labels.
- ----Week------------------------------------------------
- WeekLevels - enable/disable previous week's levels.
- WidthWeekLines - line width of weekly levels.
- ColorWeekLines - line color of weekly levels.
- StyleWeekLines - line style of weekly levels. The parameter only works if WidthWeekLines =1.
- WeekFontSize - font size for the weekly level labels.
- ----Month-----------------------------------------------
- MonthLevels - enable/disable previous month's levels.
- WidthMonthLines - line width of monthly levels.
- ColorMonthLines - line color of monthly levels.
- StyleMonthLines - line style of monthly levels. The parameter only works if WidthMonthLines =1.
- MonthFontSize - font size for the monthly level labels.
- ----Settings-----------------------------------------------
- GMThour - terminal time zone.
- WriteComments - show text comments featuring level values.


Love it. Does exactly what it's supposed to do. Thank you Yurij!