Horizontal Channel Alert with Custom Fibo
- インディケータ
- バージョン: 2.0
- アップデート済み: 4 2月 2026
- アクティベーション: 20

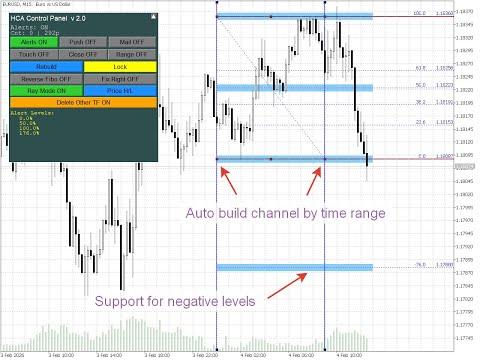
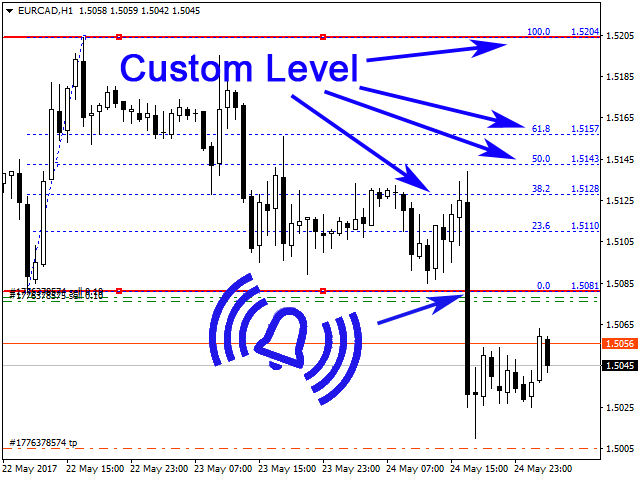
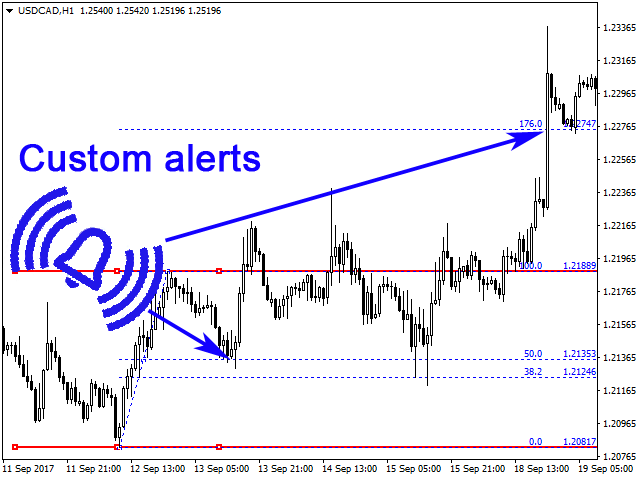
本インジケーターは、水平チャネルとシグナルゾーンの描画、極値のブレイクアウト・反発・カスタムフィボナッチレベルに基づくターゲットの検出を目的としています(音声アラートの有無は選択可)。選択したフィボナッチレベルを極値に自動で適用します。設定で有効にしたフィボナッチレベルを価格がブレイクした際、音声の再生、メッセージ表示、モバイル端末へのプッシュ通知またはメール送信(設定で有効化時)が可能です。
機能:
- 時間帯によるチャネルの自動構築(例:夜間レンジからのブレイクアウト検出)
- 新規反発の自動追跡
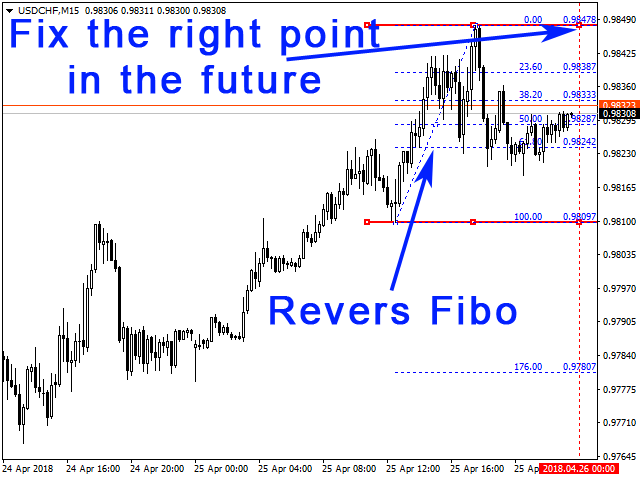
- フィボナッチレベルスケールの反転
- コントロールパネルの表示/非表示/折りたたみ
- パネルインターフェースの5言語から選択
- フィボナッチレベルに許容幅を追加し、線ではなくより広いシグナルゾーンとして表示
- 複数時間足で水平レベルとフィボナッチを描画し、他時間足のチャネルを残すか削除するかを選択可能
- High/Low または Open/Close 価格でチャネルを構築;チャネルは価格に自動でスナップ
- チャネルをロック(選択不可に)して誤削除を防止
設定
--------- 言語 -----------
- Interface Language — インジケーターパネルの言語。English(英語)、Russian(ロシア語)、Spanish(スペイン語)、German(ドイツ語)、Italian(イタリア語)。
--------- 設定 -----------
- Auto build channel by time range (broker time) — 時間帯でチャネルを自動構築(ブローカー時間)
- Time range HH:MM-HH:MM — 時間帯(開始–終了)
- Reverse Fibo — フィボナッチスケールを反転
- Fix the right point in the future (ignored when FixByTime) — 右端を将来に固定(「Auto build channel by time range」有効時は無効)
- Color Channel — チャネルの色
- Color Fibo lines — フィボナッチラインの色
- Channel Width — チャネルラインの太さ(ピクセル)
- Channel Length, bars — チャネルの長さ(バー数)
- Channel ray — チャネルをレイ(半直線)で描画
- Price Mode — 価格モード:High/Low または Open/Close
- Delete channels from other TF — 他時間足のチャネルを削除
- Lock channel (prevent line movement) — チャネルをロック(ラインの移動を防止)
- Log channel auto-update (Experts tab) — チャネル自動更新をログ(エキスパートタブ)に記録
--------- コントロールパネル -----------
- Show control panel — コントロールパネルを表示
- Panel X position (pixels from left edge) — パネルX位置(左端からのピクセル)
- Panel Y position (pixels from top) — パネルY位置(上端からのピクセル)
- Panel width (pixels) — パネル幅(ピクセル)
- Panel height (pixels) — パネル高さ(ピクセル)
--------- アラート設定 -----------
- Alerts — アラートの有効/無効
- Send Notifications — 通知を送信
- Send alerts to e-mail — アラートをメールで送信
- Alert only on first touch of level (for each direction) — レベル初回タッチ時のみアラート(方向ごと)
- Alert on candle close above/below level — 足の終値がレベル上/下でアラート
- Time-based alerts (N bars inside level range) — 時間ベースアラート(レベル範囲内でN本連続バー)
- Bottom level of range, % — 時間ベースアラート範囲の下限レベル、%(デフォルト 38.2)
- Top level of range, % — 時間ベースアラート範囲の上限レベル、%(デフォルト 61.8)
- Number of consecutive bars inside range — 時間ベースアラート範囲内の連続バー数
- Limit Alerts — アラート上限
--------- アラートマーカー -----------
- Show alert markers on chart — チャート上にアラートマーカーを表示
- Alert marker color — アラートマーカーの色
- Marker size (1-5) — マーカーサイズ(1–5)
- Maximum number of markers (0 = unlimited) — マーカー最大数(0 = 無制限)
---- カスタムフィボレベル(-1 = 無効) ----
- Level 0 … Level 29, % — レベル0 … レベル29の値、%
- Alert level 0 … Alert level 29 — レベル0 … レベル29のアラートの有効/無効
- Level 0 name … Level 29 name — レベル0 … レベル29のラベル
ヒント
- チャネルのサイズを変えずに左右に移動するには、チャネル上線または下線の中央付近をドラッグしてください。
- チャネルを伸ばす/縮めるには、上線または下線の左端または右端を目的の位置までドラッグして離してください。
- チャネル端をドラッグした後にラインがずれて見える場合は、チャート上でマウス左ボタンをクリックすると、チャネルとフィボナッチレベルが再整列します。
- フィボナッチスケールを反転するには、Reverse Fibo を有効にしてください。
- 反発を自動追跡するには、Fix the right point in the future を有効にしてください。チャネルの左端は固定され、右端は新しいバーに合わせます。
- 時間によるチャネル自動構築が有効な場合(例:レンジブレイク検出)、チャネルは時間による自動再構築のみ行われます。手動で調整するにはその設定を無効にしてください。
- Delete channels from other TF = false の場合、時間足を切り替えても既存チャネルは残り、選択した時間足に新チャネルが追加されます。Delete channels from other TF = true(デフォルト)の場合、時間足を切り替えると古いチャネルは削除され、新しい時間足上の新チャネルのみが描画されます。
- プッシュ通知を使用する場合、Limit Alerts を高くしすぎたり無制限にしたりすることは推奨しません。1アカウントから多数のプッシュ通知を送ると、MetaTrader のサービスにより送信が制限される可能性があります。


ユーザーは評価に対して何もコメントを残しませんでした