SMC Trading Tool

profasional version with TP/SL and trade alert Here

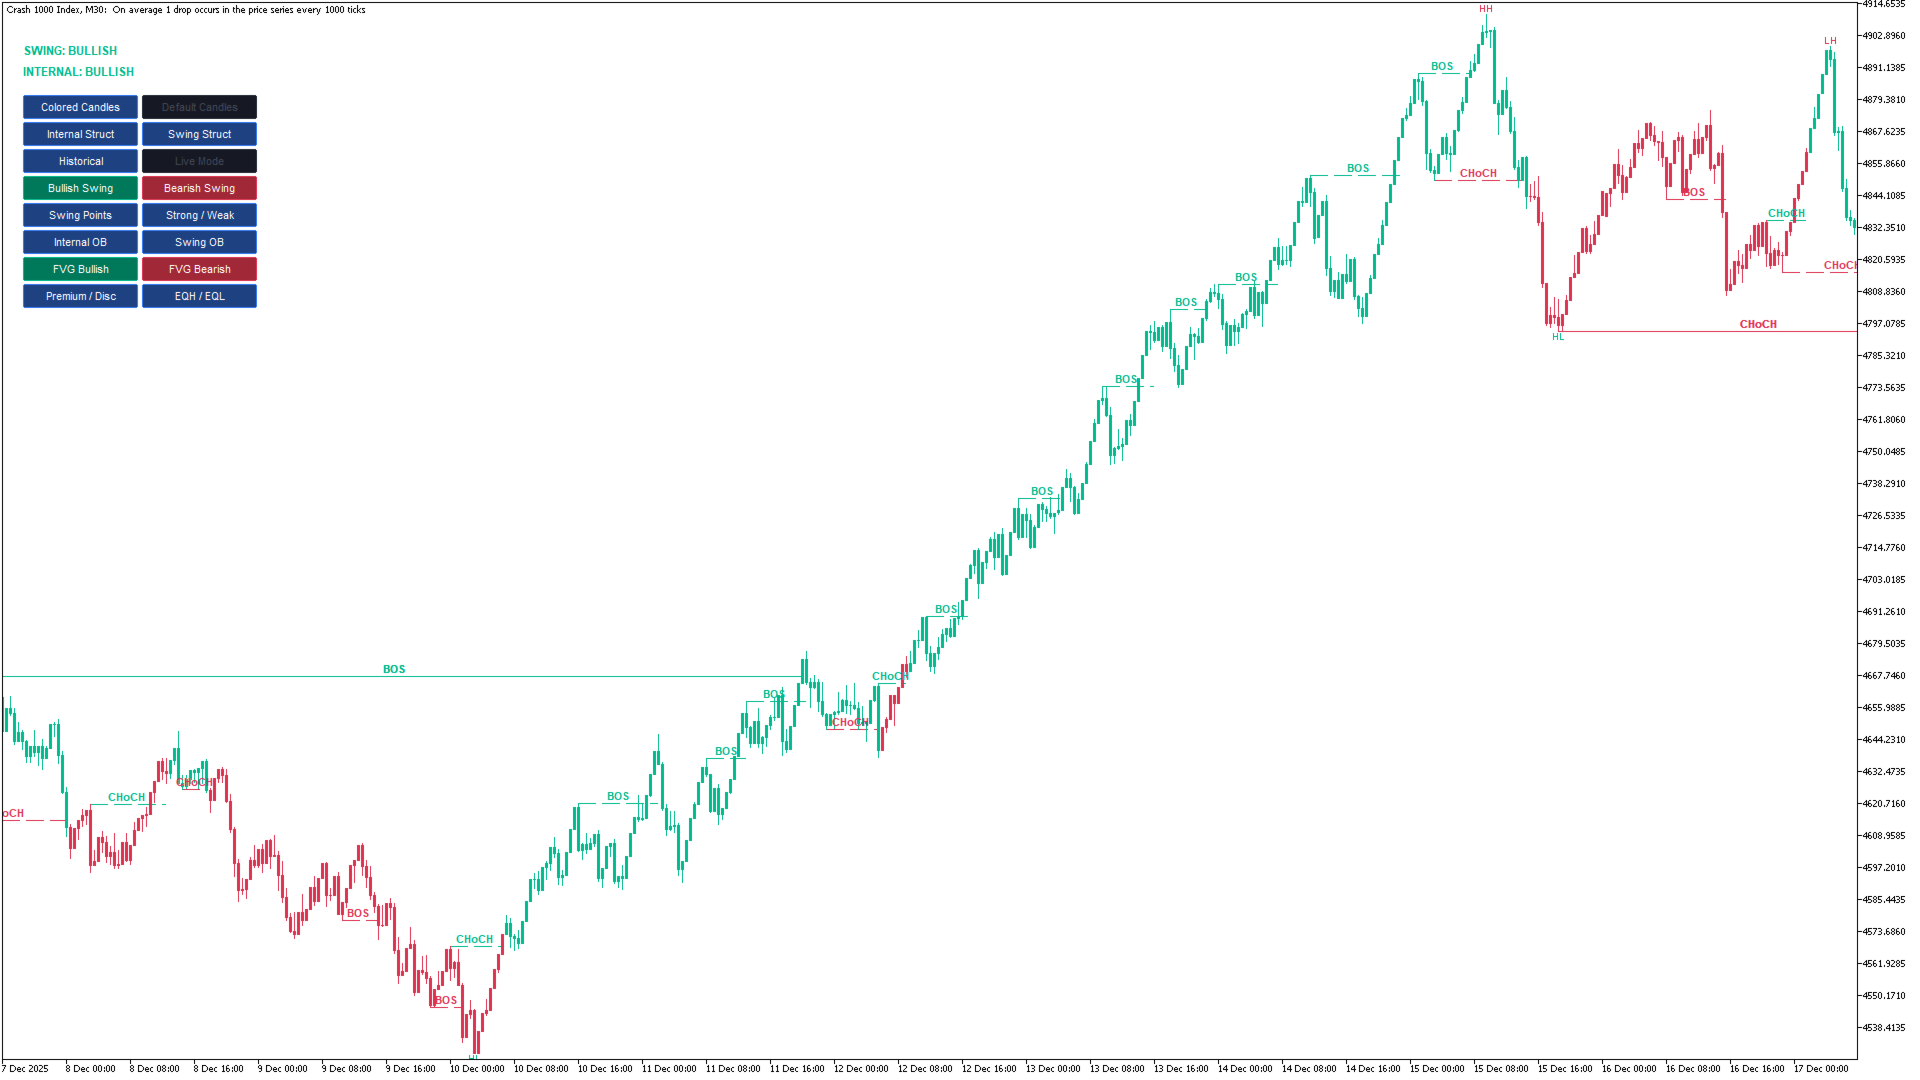
  • Full internal & swing market structure labeling in real-time
  • Break of Structure (BOS), Change of Character (CHoCH)
  • Support 3 types of Structure breakthrough options(Wick, Body, Two Candles)
  • Order Blocks ( bullish & bearish ) / Momentum shift (MS)
  • Order Blocks with Volume metrics
  • Swing Strong/Weak High/Low
  • Breaker Blocks labeling
  • Supply&Demand Zone/Order Blocks,  Strong Imbalance detection
  • High Timeframe ability. Big Bars, HTF-BOS HTF-CHoCH HTF-OB HTF-Swing High/Low.


おすすめのプロダクト
The CPR (Central Pivot Range) Indicator is a powerful technical analysis tool designed to identify key support and resistance levels on your MetaTrader 5 charts. It calculates the Central Pivot (CP) as the average of the previous day's high, low, and close prices, providing a central reference point. Calculates and plots 11 pivot levels (CP, BC, TC, S1-S4, R1-R4) Adjustable lookback period (default: 5 days) Option to show or hide price labels with customizable size and offset Fully customizable
FREE
Pivot Point Multi-Method with Dashboard This indicator is a technical analysis tool designed to calculate and display horizontal support and resistance levels based on various Pivot Point methodologies. It is built using the MQL5 Canvas library, ensuring efficient performance and a clean visual presentation on the chart. The tool calculates levels using the data from the previous completed candle of a user-defined reference timeframe. This ensures that the levels remain fixed for the duration of
FREE
Indicator Description Range Filter Pro is a sophisticated trading tool for XAUUSD (Gold) that combines adaptive price filtering with volume analysis and real-time market monitoring. Designed for both novice and professional traders, this indicator helps identify trend direction, potential reversals, and significant market movements through its multi-layered approach. Key Components 1.Dynamic Range Filter 2.Volatility-Adjusted Bands 3.Volume-Enhanced Candles 4.Professional Trading Dashboard 5.M
FREE
VWAP Anchor Tool
Jackson Mukurani Wanguthi
Anchored VWAP is a lightweight, interactive volume-weighted average price indicator designed for traders who need precision without clutter. Unlike standard VWAP that resets every session, this tool lets you drop up to five custom anchors directly on any candle. Each anchor calculates VWAP from that exact point forward, complete with standard deviation bands to highlight where price may find support or resistance relative to volume. Key Features: • Up to 5 simultaneous anchors — compare multi
FREE
B2U Market State System Part of the B2U Market State System A professional indicator suite designed to analyze market structure, trend state, and momentum. B2U Market State System 의 구성 요소입니다. 시장 구조, 추세 상태, 모멘텀을 입체적으로 분석하기 위한 전문 인디케이터 시스템입니다. Highlights structurally validated reaction zones after FVG inversion. The New Generation of Inversion Fair Value Gaps B2U IFVG BOX & Zone visually analyzes market reaction zones formed after Fair Value Gap (FVG) inversion. 차세대 Inversion Fair Value Gaps FVG 반
FREE
AC Pivot Panel – Your Ultimate Pivot Trading Tool The   AC Pivot Panel   is a powerful yet user-friendly pivot point indicator designed to help traders identify key support and resistance levels with ease. Whether you’re a beginner or an experienced trader, this indicator simplifies pivot trading and enhances your decision-making process. Key Features : Interactive Selection Panel : Easily adjust pivot settings directly on the chart with a compact and intuitive panel. Multiple Pivot Methods : C
FREE
The Advanced Support and Resistance Indicator for MetaTrader 5 leverages sophisticated pivot point detection algorithms to autonomously identify and visualize critical price levels on the chart. Utilizing a configurable pivot period (default: 20 bars) and data source (High/Low or Open/Close), it intelligently scans historical price action within a user-defined loopback window (default: 290 bars) to pinpoint pivot highs and lows with strict validation criteria for enhanced precision. Pivots are d
FREE
One of the simplest Pivot Point indicator, easy to operate, and most complete for a single chart in determining    Resistance   and   Support  level lines. In single chart,  it will show R&S Level Line with 5 popular types of Pivot Point, Highest&Lowest of closing price Include the Trend and up to 3 Time Frames. Five   types   (Floor, Woodie, Camarilla, DeMark, & Fibonacci)   of popular   Pivot Points   in determining   Resistance   and   Support   levels. With just using simple button on the
FREE
LZ Session Boxes PRO is a professional-grade tool for day traders, designed to beautifully visualize global trading sessions (Asia, Pacific/Sydney, London, New York) across your entire chart history. It eliminates the confusion of broker time offsets by automatically detecting timezones and adjusting for Daylight Saving Time (DST), ensuring your session boxes always align perfectly with real-market hours. **SPECIAL PROMOTION: All PRO features are FREE to use until June 30, 2026!** Enjoy the
FREE
Product Description  Clean, Smart Sessions is a professional trading sessions indicator designed to provide traders with a clear, accurate, and clutter-free view of the active market sessions directly on the chart. The indicator dynamically detects and displays the active trading session (Asian, London, and New York) in real time, drawing a clean session box that continuously updates to reflect the session’s true high and low. When sessions overlap, each active session is handled independently
FREE
Ultra Momentum Advanced Directional-Force Market Analyzer Ultra Momentum is a professional momentum indicator engineered to detect the market’s true speed and directional dominance . It combines the classic Momentum calculation with an adaptive multi-period structure and high-quality algorithmic smoothing to deliver a noise-resistant, market-contextual view of momentum. Unlike standard oscillators, Ultra Momentum does more than measure a simple price difference: it analyzes the coherence of m
FREE
EasyTrading Panel Basic by Vexo EasyTrading Panel Basic is a free manual trade execution panel for MetaTrader 5. It provides a streamlined workflow for placing market orders with automatic risk-based lot sizing, stop loss, and take profit calculation. The panel works on any symbol and any timeframe. How It Works The panel displays on-chart with your account balance, current lot size, risk percentage, reward-to-risk ratio, and calculated stop loss. All values update in real time as you adjust par
FREE
Correlation Matrix Pro - マルチ通貨ヘッジスキャナー 通貨ペア間の相関関係をリアルタイムで把握! 最大6つの通貨ペア間の統計的関係を同時に可視化する強力な分析ツールです。ポートフォリオ管理、リスク分散、ヘッジ戦略に最適です。 主な機能 - 対数リターンを使用したリアルタイムピアソン相関 - 最大6通貨ペアを同時監視 - 自動タイムフレーム検出 - 調整可能な遡及期間(5-200本) - ヘッジ機会の自動検出 - ミニマルで折りたたみ可能なパネルデザイン - 即座に解釈できるカラーコード付きマトリックス カラーコード 緑 (+0.70 〜 +1.00) = 強い正の相関 薄緑 (+0.50 〜 +0.69) = 中程度の正の相関 グレー (-0.49 〜 +0.49) = 弱い/相関なし オレンジ (-0.50 〜 -0.69) = 中程度の負の相関 赤 (-0.70 〜 -1.00) = 強い負の相関(ヘッジ) なぜ相関分析が重要? リスク管理 高相関ポジションによるリスクの二重化を回避。 ヘッジ戦略 効果的なヘッジのため、強い負の相関を持つペアを自動検出。
FREE
Alert Line Manager – FREE is a simple and reliable MT5 indicator that alerts you when price crosses horizontal lines . Designed for manual traders who work with key price levels. Features: Alerts on horizontal line crossing Popup and sound notifications Alert cooldown to prevent spam Alerts ON / OFF button on chart Works on any symbol and timeframe Limitations: Horizontal lines only No trend lines, channels or Fibonacci No push notifications Alert Settings Alert sound file Sound file played
FREE
BKT Monday MetaTrader 5 向けの多層テクニカルインジケーターで、供給・需要ゾーン、サポート・レジスタンスレベル、適応型MAトレンドシグナル、そして統合リスク管理パネルを1つのチャートオーバーレイに集約しています。 BKT Monday は MetaTrader 5 向けのチャートインジケーターであり、3つの相補的な分析レイヤーを使用して高確率のトレード設定を特定するためのサポートを提供します。インジケーターはスウィングピボットから自動的に供給・需要ゾーンをプロットし、過去の価格クラスターからサポート・レジスタンスラインを描画し、ユーザーが選択した上位時間足での設定可能な移動平均クロスオーバーからロング・ショートシグナル矢印を生成します。各シグナルに対してエントリー、ストップロス、3つのテイクプロフィットレベルがチャート上に直接計算・表示されます。   概要 インジケーターは2つの時間足のプライスデータを同時に処理します。メインチャートはピボットベースのゾーン検出を担い、設定可能な上位時間足がトレンドシグナル計算にデータを提供します。供給ゾーンは確認されたスウィング
FREE
High Low Open Close
Alexandre Borela
4.98 (44)
このプロジェクトが好きなら、5つ星レビューを残してください。 このインジケータは、指定されたためのオープン、ハイ、ロー、クローズ価格を描画します 特定のタイムゾーンの期間と調整が可能です。 これらは、多くの機関や専門家によって見られた重要なレベルです トレーダーは、彼らがより多くのかもしれない場所を知るために有用であり、 アクティブ。 利用可能な期間は次のとおりです。 前の日。 前週。 前の月。 前の四半期。 前年。 または: 現在の日。 現在の週。 現在の月。 現在の四半期。 現年。
FREE
Smart FVG Stats
- Md Rashidul Hasan
5 (1)
The  Smart FVG Statistics Indicator  is a powerful MetaTrader 5 tool designed to automatically identify, track, and analyze Fair Value Gaps (FVGs) on your charts. Love it? Hate it? Let me know in a review! Feature requests and ideas for new tools are highly appreciated. :) Try "The AUDCAD Trader": https://www.mql5.com/en/market/product/151841 Key Features Advanced  Fair Value Gap  Detection Automatic Identification : Automatically scans for both bullish and bearish FVGs across specified histo
FREE
Pivot Points are a classic technical analysis indicator that calculates the central pivot point (PP) as well as support (S1–S3) and resistance (R1–R3) levels based on the previous day’s High, Low, and Close. The indicator allows you to: • identify key zones where the price may bounce or break through • determine the direction of the trend • find good entry points, as well as set stop loss and take profit levels Indicator settings: • enable/disable PP, R1/S1, R2/S2, R3/S3 • enable/disable price l
FREE
Macro-R Pro Signal — Advanced Trading Signal Indicator Macro-R Pro Signal is a professional trading indicator designed to deliver high-quality BUY and SELL signals with enhanced precision and reduced market noise. By combining Bollinger Bands, RSI, and adaptive volatility filtering , this indicator helps traders identify high-probability reversal points while avoiding unfavorable market conditions. How the Strategy Works This indicator is built on a mean reversion + momentum confirmation concep
FREE
Golden Delta Library — Free MT5 Tools Market Description Short Description Golden Delta Library is a free MT5 toolkit for traders who want cleaner chart structure, Renko-based context, risk planning, and practical execution panels. The collection includes Renko indicators, SuperTrend / ADX Renko variants, XAUUSD helper panels, and RiskLab TradeDesk tools. Each product is designed to be lightweight, visual, and useful on live charts without promising automated profits or replacing trader judgme
FREE
Detailed Description: The   Pivot Points Indicator   is designed for traders who rely on pivot points, midpoints and support/resistance levels for their trading strategies. By automatically calculating and plotting these levels (based on   the   previous period's high, low, and close prices) , the indicator provides a clear, visual representation of critical price areas where the market may reverse or break out.The tool is particularly useful for day traders and swing traders looking to base th
FREE
White Weis Volume This indicator shows the sum of the volume in each wave, bulish or bearish, as idealized by David Weis , but it brings an important addition , which is the marking of the bar with the highest volume of the wave (White Bar)! In coding the indicator, it was sought to optimize the code to require minimal processing during use and not to overload mt5. The indicator can be used for pre-trading analysis and study, where the trader analyzes possible points of support and resistance
The Pivot Indicator is a vital tool for technical analysis used by traders in the financial markets. Designed to assist in identifying potential reversal points or trend changes, this indicator provides valuable insights into key levels in the market. Key features of the Pivot Indicator include: Automatic Calculations: The Pivot Indicator automatically calculates Pivot Point, Support, and Resistance levels based on the previous period's high, low, and close prices. This eliminates the complexity
FREE
Unlock Precision Trading: The ATR Dynamic Pivot System Download this free   ATR Pivot Signals   indicator and instantly gain an edge against market noise. This is the ultimate tool for traders who demand high-conviction entry points based on genuine market swing reversals, not guesswork. The   ATR Pivot Signals   system   is an innovative technical indicator that utilizes the Average True Range (ATR) to dynamically filter volatility, ensuring that a signal is triggered only when a price move is
FREE
KS FX Session Alert Indicator MetaTrader 5(MT5)用のFX市場セッション表示インジケーターです。ロンドン、ニューヨーク、東京、シドニーという主要な4つの取引セッションを視覚的に強調表示します。 ICT、SMC、およびプライスアクションを重視するトレーダー向けに設計されており、セッションに関する重要な背景情報を提供するとともに、市場のボラティリティが高まる時間帯や値動きを明確に示します。 主な機能 セッションの可視化 最大4つのセッション(ロンドン、ニューヨーク、東京、シドニー)を表示でき、それぞれ個別に表示・非表示を切り替え可能です。開始時刻と終了時刻は、ご自身のローカルタイムゾーンに合わせてカスタマイズできます。枠線の太さや表示範囲の延長設定を調整し、チャートを最適な見やすさに設定できます。 動的なセッションラベル セッション名はチャート上に直接表示され、リアルタイムで更新されます。オプションとして、曜日、価格レンジ(高値–安値)、およびレンジ幅(pips単位)を含めて表示させることも可能です。 内蔵された分析ツール 各セッションにおいて、
FREE
Amiguinhos Bar Counter
Eduardo Correia Da Silva
3.67 (3)
Amiguinho's Bar Counter is a price action indicator to display the bar count (candles) with some interesting options. About the "Period of analysis" parameter: if the current timeframe is in minutes, then the analysis period will be considered in days; if the current timeframe is in days, then the analysis period will be considered in months; or  if the period of analysis will be considered in years.
FREE
Overview QuantumEdge Oscillator is a professional-grade trading indicator that combines advanced momentum analysis with sophisticated trend detection algorithms. This 30-day trial version provides full access to all features, allowing you to thoroughly test its capabilities in live market conditions before making a purchase decision. Key Features Dual-Signal System : Combines RSI moving average with smoothed ATR-based volatility bands Multi-Timeframe Analysis : Built-in support for higher timefr
FREE
This indicator is based on Mr. Mark Fisher's ACD strategy, based on the book "The Logical Trader." - OR lines - A lines - C lines - Daily pivot range - N days pivot range - Customizable trading session - Drawing OR with the desired time Drawing levels A and C based on daily ATR or constant number - Possibility to display daily and last day pivots in color zone - Displaying the status of daily PMAs (layer 4) in the corner of the chart - Show the order of daily pivot placement with multi-day piv
FREE
概要 このインジケーターは、クラシックな ドンチャンチャネル を強化したバージョンで、実践的なトレード機能を追加しています。 標準の3本線(上限、下限、中央線)に加え、 ブレイクアウト を検出し、チャート上に矢印で視覚的に表示します。また、チャートを見やすくするために、 現在のトレンド方向と逆側のラインのみを表示 します。 インジケーターの機能: 視覚的シグナル :ブレイクアウト時にカラフルな矢印を表示 自動通知 :ポップアップ、プッシュ通知、Eメール RSIフィルター :市場の相対的な強弱に基づいてシグナルを検証 カスタマイズ可能 :色、ラインの太さ、矢印コード、RSI閾値など 動作原理 ドンチャンチャネルは次のように計算します: 上限線 :直近N本のクローズ済みローソク足の最高値 下限線 :直近N本のクローズ済みローソク足の最安値 中央線 :最高値と最安値の平均値 上方ブレイクアウト は終値が上限線を超えたときに発生し、 下方ブレイクアウト は終値が下限線を下回ったときに発生します。 インジケーターは以下を行います: 3本のドンチャンラインを描画 方向転換後の最初のブレイクアウト
FREE
PROMETHEUS TECHNICAN VERSION Free | By THE SONS A gift from The Sons — no strings, no trial, no expiry. Every trader deserves access to professional-grade market intelligence. That belief is why Prometheus Technical Version exists, and why it costs nothing. Consider it our handshake to the trading community. What You're Getting This is not a simplified tool dressed up as a gift. Prometheus Technican Version is a fully built, institutional-quality technical analysis indicator running a dual-model
FREE
このプロダクトを購入した人は以下も購入しています
ARIPoint is a powerful trading companion designed to generate high-probability entry signals with dynamic TP/SL/DP levels based on volatility. Built-in performance tracking shows win/loss stats, PP1/PP2 hits, and success rates all updated live. Key Features: Buy/Sell signals with adaptive volatility bands Real-time TP/SL/DP levels based on ATR Built-in MA Filter with optional ATR/StdDev volatility Performance stats panel (Success, Profit/Loss, PP1/PP2) Alerts via popup, sound, push, or email Cu
SuperScalp Pro
Van Minh Nguyen
4.63 (24)
SuperScalp Pro – 高度なマルチフィルタースキャルピングインジケーターシステム SuperScalp Pro は、クラシックな Supertrend と複数のインテリジェント確認フィルターを組み合わせた高度なスキャルピングインジケーターです。M1 から H4 まで複数の時間足で効率的に動作し、XAUUSD、BTCUSD、主要 Forex 通貨ペア向けに最適化されています。 このインジケーターは明確な Buy / Sell シグナルを提供し、ATR に基づいてエントリー価格、Stop Loss、Take Profit を自動計算します。Fibonacci Take Profit 機能により、重要な価格帯で早期決済し、到達時に通知を送信します。 初期設定では Fibonacci Take Profit が有効化されており、より安定した取引体験を重視しています。チャートに適用するだけですぐ利用可能です。上級者向けに、すべてのパラメータは自由にカスタマイズできます。 EMA、RSI、ADX、Volume、VWAP、Bollinger Bands、MACD Divergence な
このインジケーターを購入された方には、以下の特典を 無料 で提供しています: 各トレードを自動で管理し、ストップロスとテイクプロフィットを設定し、戦略ルールに基づいてポジションを決済する補助ツール 「Bomber Utility」 様々な銘柄に合わせたインジケーターの設定ファイル(セットファイル) 「最小リスク」、「バランスリスク」、「待機戦略」 の3つのモードで使用できる Bomber Utility 用の設定ファイル このトレーディング戦略をすぐに導入・設定・開始できる ステップバイステップのビデオマニュアル ご注意: 上記の特典を受け取るには、MQL5のプライベートメッセージシステムを通じて販売者にご連絡ください。 オリジナルのカスタムインジケーター 「Divergence Bomber(ダイバージェンス・ボンバー)」 をご紹介します。これは、MACDのダイバージェンス(乖離)戦略に基づいた 「オールインワン」型のトレーディングシステム です。 このテクニカルインジケーターの主な目的は、価格とMACDインジケーターの間に発生するダイバージェンスを検出 し、将来の価格の動きを示す
Entry In The Zone and SMC Multi Timeframe is a real-time 2-in-1 market analysis tool that combines market structure analysis and a No Repaint BUY / SELL signal system into a single indicator, built on Smart Money Concepts (SMC) — a widely adopted framework used by professional traders to understand market structure. This indicator helps you see the market more clearly, make decisions based on structure rather than guesswork, and focus on high-probability zones where price is more likely to react
Gold Entry Sniper – ゴールドスキャルピング&スイングトレード用プロフェッショナル多時間足ATRダッシュボード Gold Entry Sniper は、XAUUSDや他の銘柄向けに正確な 売買シグナル を提供する、MetaTrader 5用の高度なインジケーターです。 ATRトレーリングストップロジック と 多時間足分析ダッシュボード を搭載し、スキャルピングからスイングトレードまで対応します。 主な特徴と利点 多時間足シグナル分析 – M1、M5、M15 のトレンドを同時表示。 ATRベースのトレーリングストップ – ボラティリティに応じて動的に調整。 プロ仕様のチャートダッシュボード – シグナル状況、ATRレベル、回帰線、売買方向を表示。 明確な売買マーカー – 自動矢印とテキストラベル。 エグジットアラートとトレード管理 – 利益確定のための自動検出。 完全カスタマイズ可能 – パネル位置、色、フォント、ATR/回帰設定を調整可能。 ゴールド(XAUUSD)に最適化 – M1〜M15のスキャルピングに最適、FXや指数、暗号資産にも対応。 Gold Entry
Power Candles V3 - 自己最適化型強弱インジケーター Power Candles V3は 、通貨や銘柄の強さを、適用されたすべてのチャート上で実行可能なトレードプランに変換します。単にローソク足を色分けするだけでなく、バックグラウンドでリアルタイムの自動最適化を実行し、目の前の銘柄に対して最適なストップロス、テイクプロフィット、およびシグナルの閾値を提示します。ワンクリックで実取引に適用でき、エントリーポイント、ストップロス、テイクプロフィットのラインが正確な価格位置にチャート上に表示され、方向性を示すアラートがリアルタイムで発動します。 このツールは、Stein Investmentsのエコシステムの一部です。  18種類以上のツールをすべて閲覧し、AIを活用したセットアップの推奨事項を入手し、  https://stein.investments でコミュニティに参加しましょう クローズしたバーごとに3,000回以上のトレードシミュレーション。9つの強さの状態。2つの戦略を並行してテスト。勝率の高い設定をワンクリックで適用。 なぜこれが必要なのか ほとんどの強
このインジケーターを購入すると、プロ仕様のトレードマネージャーを無料で差し上げます。 まず第一に、このトレーディングシステムがノンリペイント、ノンリドロー、ノンラグのインジケーターであることを強調する価値がある。これにより、手動取引とロボット取引の両方に理想的なものになっています。 オンラインコース、マニュアル、プリセットのダウンロード。 「スマートトレンドトレーディングシステム MT5」は、新規および経験豊富なトレーダー向けにカスタマイズされた包括的なトレーディングソリューションです。10以上のプレミアムインジケーターを組み合わせ、7つ以上の堅実なトレーディング戦略を備えており、多様な市場状況に対応する多目的な選択肢となっています。 トレンドフォロー戦略:トレンドを効果的に乗り越えるための正確なエントリーとストップロス管理を提供します。 リバーサル戦略:潜在的なトレンドの反転を特定し、トレーダーがレンジ相場を活用できるようにします。 スキャルピング戦略:高速で正確なデイトレードおよび短期取引のために設計されています。 安定性:すべてのインジケーターはノンリペイント、ノンリドロー、ノ
SignalTech MT5 is a fully rule based trading system for EURUSD, USDCHF, USDJPY, AUDUSD, NZDUSD, EURJPY, AUDJPY, NZDJPY, CADJPY.  All the winning trades with chart setups are published on the comments page. 2025-12 1174 Pips 2026-01 2624 Pips 2026-02 2937 Pips 2026-03 2165 Pips 2026-04 2243 Pips It can generate signals with Buy/Sell Arrows and Pop-Up/Sound Alerts. Each signal has clear Entry and Stop Loss levels, which should be automatically flagged on the chart, as well as potential Targets 1,
Gann Made Easy   は、ミスター・ギャンの理論を使用した取引の最良の原則に基づいた、プロフェッショナルで使いやすい外国為替取引システムです。 W・D・ガン。このインジケーターは、ストップロスとテイクプロフィットレベルを含む正確な買いと売りのシグナルを提供します。 PUSH通知を利用して外出先でも取引可能です。 ご購入後、取引方法の説明と優れた追加インジケーターを無料で入手するには、私にご連絡ください! おそらく、ギャンの取引手法についてはすでに何度も聞いたことがあるでしょう。通常、ギャンの理論は初心者のトレーダーだけでなく、すでにある程度の取引経験がある人にとっても非常に複雑なものです。なぜなら、ギャンの取引手法は理論的にはそれほど簡単に適用できるものではないからです。私はその知識を磨き、最良の原則を私の外国為替インジケーターに組み込むために数年を費やしました。 このインジケーターは非常に簡単に適用できます。必要なのは、それをチャートに添付し、簡単な取引推奨事項に従うだけです。このインジケーターは常に市場分析の仕事を行い、取引の機会を探します。適切なエントリーポイントを検
ご紹介     Quantum Breakout PRO は 、ブレイクアウト ゾーンの取引方法を変革する画期的な MQL5 インジケーターです。 13年以上の取引経験を持つ経験豊富なトレーダーのチームによって開発されました。     クォンタム ブレイクアウト プロ   は、革新的でダイナミックなブレイクアウト ゾーン戦略により、あなたのトレーディングの旅を新たな高みに押し上げるように設計されています。 クォンタム ブレイクアウト インジケーターは、5 つの利益ターゲット ゾーンを備えたブレイクアウト ゾーン上のシグナル矢印と、ブレイクアウト ボックスに基づいたストップロスの提案を提供します。 初心者トレーダーにもプロのトレーダーにも適しています。 量子EAチャネル:       ここをクリック 重要!購入後、インストールマニュアルを受け取るためにプライベートメッセージを送ってください。 推奨事項: 時間枠: M15 通貨ペア: GBPJPY、EURJPY、USDJPY、NZDUSD、XAUUSD アカウントの種類: ECN、Raw、またはスプレッドが非常に低い R
Azimuth Pro
Ottaviano De Cicco
5 (7)
Azimuth Pro V2:MT5向けシンセティック・フラクタル構造分析と確認済みエントリー 概要 Azimuth Pro は Merkava Labs によるマルチレベルスイング構造インジケーターです。4つのネストされたスイングレイヤー、スイングアンカーVWAP、ABCパターン検出、3タイムフレーム構造フィルタリング、そして確定バーでの確認済みエントリー — 1つのチャートで、ミクロスイングからマクロサイクルまでを網羅するワークフロー。 これはブラインドシグナル製品ではありません。ロケーション、コンテキスト、タイミングを重視するトレーダーのための構造ファーストワークフローです。 V2発売記念オファー — Azimuth Pro V2をUSD 399で(次の100本)。最終価格:USD 499。 1. V2での変更点 シンセティック・マルチタイムフレームエンジン 上位タイムフレーム分析をMeridian Proと同じ独自のシンセティックアーキテクチャで一から再構築。よりクリーンなHTFコンテキスト、安定したライブ動作、従来のMTF同期問題なし。シンセティックエンジンは 固定比率タ
まず第一に、この取引ツールはノンリペイント、ノンリドロー、ノンラグの指標であり、プロの取引に理想的ですことを強調する価値があります。 オンラインコース、ユーザーマニュアル、デモ。 スマートプライスアクションコンセプトインジケーターは、新米から経験豊富なトレーダーまで、非常 に強力なツールです。Inner Circle Trader AnalysisやSmart Money Concepts Trading Strategiesなど、20以上の有用な指標を1つに組み合わせています。このインジケーターはスマートマネーコンセプトに焦点を当て、大手機関の取引方法を提供し、彼らの動きを予測するのに役立ちます。 特に、流動性分析に優れており、機関がどのように取引しているかを理解しやすくしています。市場のトレンドを予測し、価格の動きを慎重に分析するのに優れています。機関の戦略とトレードを合わせることで、市場の動向についてより正確な予測ができます。このインジケーターは多目的であり、市場構造を分析し、重要な注文ブロックを特定し、さまざまなパターンを認識するのに優れています。 このインジケーター
まず正直に言いましょう。 どんなインジケーターも、それ単体であなたを利益化させることはできません。もしそう言う人がいるなら、それは夢を売っているだけです。完璧な売買シグナル(矢印)を表示するインジケーターは、いくらでも“完璧に見せる”ことができます。正しい過去の区間を拡大して、勝ちトレードだけを切り取ればいいだけです。私たちはそれをしません。 SMC Intraday Formula はツールです。 市場構造を読み取り、最も高い確率の価格ゾーンを特定し、今この瞬間のスマートマネーの痕跡をシンプルな言葉で正確に示します。最終判断はあなたが行います。トレードを実行するのもあなたです。しかし今は「希望」ではなく「精度」でエントリーできます。 私たちはこのインジケーターを、ゴールド(XAUUSD)および主要FX通貨ペアで約3年間、日々のスキャルピングに使用してきました。M1、M5、M15、M30の主要ツールです。これは未来を予測しようとするのではなく、今まさに形成されている高確率セットアップを示し、その理由を説明します。 他のすべてのインジケーターと何が違うのか? ほとんどのトレーディングイ
RelicusRoad Pro: 定量的市場オペレーティングシステム 【期間限定】無制限アクセス 70% OFF - 2,000人超のトレーダーと共に なぜ多くのトレーダーは「完璧な」インジケーターを使っても失敗するのでしょうか? それは、文脈を無視して 単一の概念 だけでトレードしているからです。文脈のないシグナルは単なるギャンブルです。勝ち続けるには、 根拠の重なり(コンフルエンス) が必要です。 RelicusRoad Proは単なる矢印インジケーターではありません。完全な 定量的市場エコシステム です。独自のボラティリティモデリングを用いて、価格が推移する「適正価値の道(Fair Value Road)」をマッピングし、ノイズと真の構造的ブレイクを判別します。 推測はやめましょう。機関投資家レベルの「ロード・ロジック」でトレードを。 コアエンジン:「Road」アルゴリズム システムの中心となる Road Algo は、市場環境にリアルタイムで適応するダイナミックなボラティリティチャネルです。 安全ライン(平衡点) と、価格が数学的に反転しやすい 拡張レベル を投影します。 Si
Meridian Pro
Ottaviano De Cicco
5 (2)
Meridian Pro 2.00:MT5向けプロ仕様マルチタイムフレーム・トレンドマトリクス Meridian Pro 2.00 は、MetaTrader 5 向けのプロ仕様の適応型トレンドマトリクスです。オリジナルの Meridian トレンドエンジン、クリーンなチャート ribbon、確定足ベースのシグナル矢印、8時間足 dashboard、Fuel momentum、weighted consensus、synthetic HTF processing、そしてチャート上に直接表示される上位足コンテキストラインを統合します。 目的はシンプルです。現在のトレンド、マルチタイムフレーム構造、強度、momentum、EA-ready 状態を、複数チャートに無関係なインジケータを重ねるのではなく、1つの整理された workflow で読むことです。 Meridian Pro の違い 1つの適応型エンジン - 同じ volatility-aware Meridian ロジックを M1 から W1 まで適用します。 Synthetic HTF architecture - 上位足行は下位足デ
Quantum TrendPulse を ご紹介します。これは、   SuperTrend   、   RSI   、および Stochastic のパワーを 1 つの包括的なインジケーターに組み合わせて、取引の可能性を最大限に引き出す究極の取引ツールです。精度と効率を求めるトレーダー向けに設計されたこのインジケーターは、市場のトレンド、勢いの変化、最適なエントリー ポイントとエグジット ポイントを自信を持って特定するのに役立ちます。 主な特徴: SuperTrend 統合: 現在の市場動向に簡単に追従し、収益性の波に乗ることができます。 RSI精度: 買われすぎと売られすぎのレベルを検出し、市場の反転のタイミングに最適で、SuperTrendのフィルターとして使用されます。 確率的精度: 確率的振動を活用して、変動の激しい市場で隠れたチャンスを見つけます。SuperTrend のフィルターとして使用されます。 マルチタイムフレーム分析:   M5 から H1 または H4 まで、さまざまなタイムフレームで市場を常に把握します。 カスタマイズ可能なアラート: カスタム取引条件が満たされ
FX Trend NG:次世代マルチマーケット・トレンドインテリジェンス 概要 FX Trend NG は、複数の時間足に対応したプロフェッショナル向けトレンド分析およびマーケット監視ツールです。 市場全体の構造を数秒で把握することができます。 複数のチャートを切り替える必要はありません。どの銘柄がトレンド中なのか、どこでモメンタムが弱まっているのか、そしてどの時間足で強い整合性があるのかを瞬時に確認できます。 ローンチ特別オファー – FX Trend NG を $30(6ヶ月) または $80 永久ライセンス でご利用いただけます。 すでに Stein Investments のユーザーですか? -> メッセージを送信 して、プライベートグループへアクセスしてください。 セットアップや詳細情報が必要ですか? -> Stein Investments 公式ページ をご覧ください。 1. FX Trend NG が他と異なる理由 3ステート・トレンドロジック ― Buy と Sell だけではない • 多くのインジケーターは Buy または Sell の2状態のみを表示します。
まず第一に、この取引インジケーターは再描画されず、再描画されず、遅延しないことを強調する価値があります。これにより、手動取引とロボット取引の両方に理想的なものになります。 ユーザーマニュアル:設定、入力、戦略。 アトミックアナリストは、価格の強さとモメンタムを利用して市場でより良いエッジを見つけるためのPA価格アクションインジケーターです。ノイズや誤ったシグナルを除去し、取引ポテンシャルを高めるための高度なフィルターを備えています。複雑なインジケーターの複数のレイヤーを使用して、アトミックアナリストはチャートをスキャンし、複雑な数学的計算をシンプルなシグナルと色に変換します。これにより、どのような初心者トレーダーでも理解して使用し、一貫した取引の決定を行うことができます。 「アトミックアナリスト」は、新規および経験豊富なトレーダー向けにカスタマイズされた包括的な取引ソリューションです。プレミアムインジケーターとトップノッチの機能を1つの取引戦略に組み合わせ、すべてのタイプのトレーダーにとって汎用性のある選択肢にします。 デイリートレーディングとスキャルピング戦略:高速で正確なデイ
FX Power: 通貨の強弱を分析して、より賢い取引を実現 概要 FX Power は主要通貨と金の実際の強弱をあらゆる市場状況で理解するための必須ツールです。強い通貨を買い、弱い通貨を売ることで、 FX Power は取引の意思決定を簡素化し、高い確率の取引機会を見出します。トレンドを追従する場合でも、極端なデルタ値を使用して反転を予測する場合でも、このツールはあなたの取引スタイルに完全に適応します。ただ取引するだけではなく、 FX Power で賢く取引をしましょう。 1. なぜ FX Power がトレーダーにとって非常に有益なのか 通貨と金のリアルタイム強弱分析 • FX Power は主要通貨と金の相対的な強弱を計算し、マーケットダイナミクスに関する明確な洞察を提供します。 • どの資産がリードしているか、または後れを取っているかを監視して、取引するペアを賢く選びましょう。 マルチタイムフレームの包括的なビュー • 短期、中期、長期のタイムフレームで通貨と金の強弱を追跡し、マーケットトレンドに基づいて取引戦略を調整できます。 • スキャルピングからスイングトレード
多くの矢印インジケーターは、シグナルだけを表示して、その後の判断をすべてトレーダーに任せてしまいます。KT Alpha Hunter Arrows は、完整なトレードプランをチャート上に提示します。 各シグナル矢印が表示されるたびに、エントリーライン、ストップロス、4つのテイクプロフィット水準、そして現在の銘柄と時間足が今トレードに値するかどうかを示すリアルタイムのエッジ判定が、すでに描画された状態で表示されます。付属の Trade Manager EA は、あなたが手動でエントリーした後の実行管理を担当し、相場が荒れて判断がぶれやすい場面でも規律あるトレードを保ちやすくします。リペイントなし。確定足シグナルのみ。Forex、ゴールド、指数、その他あなたが取引するあらゆる銘柄に対応します。 主な機能 リペイントしない買い矢印と売り矢印を、足の確定後にのみ表示。 各シグナルに、エントリーライン、構造的ストップロス、4つのテイクプロフィット水準を表示。 Edge Dashboard が、現在のチャートで買いセットアップと売りセットアップを別々に評価。 判定システム:No Edge、Mar
Market Structure Order Block Dashboard MT5 は、市場構造と主要な価格反応ゾーンをチャート上で直接読み取りたいトレーダー向けに設計された MT5 インジケーターです。BOS、ChoCH、オーダーブロック、Fair Value Gap (FVG)、流動性、Kill Zones、Volume Profile、そして素早い分析のためのコンパクトなダッシュボードを組み合わせています。 本インジケーターは、市場構造、ICT、Smart Money の概念を意思決定の枠組みとして使用するトレーダーを対象としています。トレンド継続、反転の可能性、価格の不均衡、流動性ターゲット、注目ゾーンをより構造的に特定する助けとなります。 購入者向けの付属リソース 購入後、MQL5 のプライベートメッセージにてご依頼いただくと、完全な PDF ユーザーガイドとパラメータ設定のヒントを提供いたします。MQL5 のプライベートメッセージによる直接的な技術サポート。 バージョン 1.20 では 2 つの重要な追加機能があります: Pending BOS / Pending Cho
BTMM State Engine Pro is a MetaTrader 5 indicator for traders who use the Beat The Market Maker approach: Asian session context, kill zone timing, level progression, peak formation detection, and a multi-pair scanner from a single chart. It combines cycle state logic with a built-in scanner dashboard so you do not need the same tool on many charts at once. What it does Draws the Asian session range; session times can follow broker server offset or be set in inputs. Tracks level progression (L
トレンド スクリーナー インジケーターでトレンド取引の力を解き放ちます。ファジー ロジックと複数通貨システムを活用した究極のトレンド取引ソリューションです。 ファジー ロジックを活用した革新的なトレンド インジケーターである Trend Screener を使用して、トレンド取引を向上させます。 これは、13 を超えるプレミアム ツールと機能、および 3 つの取引戦略を組み合わせた強力なトレンド追跡インジケーターであり、Metatrader をトレンド アナライザーにする多用途の選択肢となります。 期間限定オファー : トレンド スクリーナー インジケーターは、わずか 65 ドルで生涯ご利用いただけます。 (元の価格 50$ ) (オファー延長) Trend Screener の 100% 非再描画精度の揺るぎない精度を体験して、取引の決定が過去の価格変動の影響を受けないようにしてください。 マルチタイムフレームおよびマルチ通貨機能の多用途性を解放し、比類のない自信を持って外国為替、商品、暗号通貨、インデックスの世界を取引できるようにします。 Trend Screener の包括的な戦
優れたテクニカルインジケーター「Grabber」をご紹介します。これは、すぐに使える「オールインワン」トレーディング戦略として機能します。 ひとつのコードに、市場のテクニカル分析ツール、取引シグナル(矢印)、アラート機能、プッシュ通知が強力に統合されています。 このインジケーターを購入された方には、以下の特典を無料で提供します: Grabberユーティリティ:オープンポジションを自動で管理するツール ステップバイステップのビデオマニュアル:インジケーターのインストール、設定、取引方法を解説 カスタムセットファイル:インジケーターをすばやく自動設定し、最大限の成果を出すための設定ファイル 他の戦略はもう忘れてください!Grabberだけが、あなたを新たなトレードの高みへと導いてくれるのです。 Grabber戦略の主な特徴: 推奨タイムフレーム:M5〜H4 対応通貨ペア・資産:どれでも使用可能ですが、私が実際に検証した以下を推奨します(GBPUSD、GBPCAD、GBPCHF、AUDCAD、AUDUSD、AUDSGD、AUDCHF、NZDUSD、NZDCAD、EURCAD、EURUSD、E
これはMT5のインジケーターで、再描画なしで取引に参入するための正確なシグナルを提供します。 外国為替、暗号通貨、金属、株式、インデックスなど、あらゆる金融資産に適用できます。かなり正確な見積もりを提供し、取引を開始して終了するのに最適な時期を教えてくれます。1つのシグナルを処理しただけでインジケーターの元が取れた例の 動画 (6:22)をご覧ください。Entry PointsPro インジケーターの助けを借りたほとんどのトレーダーの最初の1週間の結果が改善しています。 Telegramグループ に登録してください。Entry Points Proインジケーターのメリットは次の通りです。 再描画のないエントリーシグナル 再描画されるインジケーターでは一度表示されたシグナルが削除されて大きな金銭的損失につながることがありますが、これと異なり、表示されて確認されたシグナルは消えることがありません。 エラーなしの取引開始 インジケーターアルゴリズムによって取引を開始する(資産を売買する)理想的な瞬間を見つけることができます。それを使用するすべてのトレーダーの成功率が向上します。 あら
Trend Forecaster – Since 2023. The Trend Forecaster indicator utilizes a unique proprietary algorithm to determine entry points for a breakout trading strategy. The indicator identifies price clusters, analyzes price movement near levels, and provides a signal when the price breaks through a level. The Trend Forecaster indicator is suitable for all financial assets, including currencies (Forex), metals, stocks, indices, and cryptocurrencies. You can also adjust the indicator to work on any time
このダッシュボードは、選択されたシンボルの最新の利用可能なハーモニックパターンを表示するので、時間を節約し、より効率的に /   MT4バージョン 。 無料インジケーター:   Basic Harmonic Pattern インジケーター列 Symbol : 選択したシンボルが表示されます。 Trend :   強気または弱気 Pattern : パターンの種類(ガートレー、バタフライ、バット、カニ、サメ、サイファー、ABCD) Entry : エントリー価格 SL: ストップロス価格 TP1: 1回目の利食い価格 TP2: 2回目の利食い価格 TP3:   3回目の利食い価格 Current price :   現在値 Age (in bars):    最後に描画されたパターンの年齢 主な入力項目 Symbols:   "28 Major Currency Pairs "または "Selected Symbols "から選択。 Selected Symbols:   カンマで区切られた監視したいシンボル("EURUSD,GBPUSD,XAUUSD")。ブローカーがペアに接
トレンドラインプロ   市場の真の方向転換点を理解するのに役立ちます。この指標は、真のトレンド反転と主要プレーヤーが再び参入するポイントを示します。 分かりますか     BOSライン   複雑な設定や不要なノイズなしに、より長い時間足でのトレンドの変化と重要なレベルを把握できます。シグナルは再描画されず、バーが閉じた後もチャート上に残ります。 MT4バージョン   -   RFI LEVELS PRO インジケーター と組み合わせることで、その最大限の能力を発揮します インジケーターが示す内容: 本当の変化   トレンド(BOSライン) 一度シグナルが現れたら、それは有効です!これは、リペイント機能を持つインジケーターとの重要な違いです。リペイント機能を持つインジケーターは、シグナルを発した後、それを変更し、資金の損失につながる可能性があります。これにより、より高い確率と精度で市場に参入できます。また、矢印が現れた後、目標値(利益確定)に達するか、反転シグナルが現れるまで、ローソク足の色を変更する機能もあります。 繰り返しエントリ   主要プレーヤーの補充 エントリーポイントを探す
このインジケーターは、反転ポイントと価格戻りゾーンを正確に表示します。     主要プレーヤー 。新たなトレンドが形成される場所を把握し、最大限の精度で意思決定を行い、すべての取引をコントロールします。 TREND LINES PRO インジケーターと組み合わせることで、その潜在能力を最大限に発揮します。 VERSION MT4 インジケーターが示す内容: 新しいトレンドの始まりに活性化する反転構造と反転レベル。 リスクと報酬の比率を最小限に抑えた利益 確定 と 損失停止の レベルの表示     RR 1:2   。 インテリジェントな削減ロジックによるストップロス。 指定されたインジケーターから 2 つのトレンド タイプの反転パターンを表示します。 指標: トレンドを追う   TREND LINES PRO   (世界的なトレンドの変化) TREND PRO   (クイックトレンド変更) シンプルで効果的   スキャナー   リアルタイムトレンド(新機能)。 マルチタイムフレームのインストゥルメント フィルタリング。 画面   利益     LOGIC AI信号の後。 当日プラス方
Super Signal Market Slayer 非リペイント|高精度|マルチマーケット対応インテリジェントトレンド指標 トレードにおいて本当に難しいのは、 注文することではなく、相場のノイズの中で「トレンドが始まった瞬間」を見極めることです。 Market Slayer はそのために開発されました。 本インジケーターは、日中取引向けに設計された非リペイント型のインテリジェント指標です。 多層確認とトレンドフィルターにより、重要な局面でのみ明確かつ信頼性の高い Buy / Sell シグナルを表示します。 主な特長 非リペイントシグナル 一度表示されたシグナルは固定され、消えたり移動したりしません。 高精度なトレンド判定 複数銘柄で検証され、特にゴールド M5 / M15 で安定した結果を示します。 マルチマーケット対応 ゴールド、FX、指数、主要暗号資産に対応。 日中取引向け最適化 M5・M15 に特化し、ノイズを抑え実行性を向上。 直感的で分かりやすい 初心者でも理解しやすく、すぐに使用可能。 技術ロジック概要 Market Slayer は単一条件の矢印ではありません。 以
作者のその他のプロダクト
Trend Duration Forecast It utilizes a Hull Moving Average (HMA) to detect trend direction and statistically forecasts the probable duration of the current move based on historical market behavior. Key Features Smooth Trend Detection:   Uses the Hull Moving Average (HMA) to filter noise while minimizing lag, providing clean Bullish/Bearish signals. Real-Time Duration Counter:   Displays a dynamic label at the start of the current trend showing the   "Real Length"   (number of bars the trend has b
FREE
Strong Bull V7 B&C  The ultimate M5 indicator for Boom & Crash indices, providing clear, filtered buy/sell signals to eliminate market noise and enhance your trading precision. Benefit-Focused Master the volatile Boom & Crash markets with Strong Bull V7 B&C . This intelligent indicator provides clear visual arrows and text labels for high-probability setups on the M5 timeframe. Its unique symbol-filtering technology automatically hides conflicting signals (no buys on Crash, no sells on Boom), en
The Range Filter Buy and Sell indicator is a trend-following technical analysis tool designed to identify optimal entry and exit points in the market. It filters out market noise by creating dynamic bands around price movements, generating clear buy and sell signals when price breaks through these bands. Key Features Dynamic Range Filtering : Uses a sophisticated algorithm to calculate adaptive bands that adjust to market volatility Trend Identification : Clearly visualizes the current trend dir
FREE
Fractals_Price Indicator Description The Fractals_Price indicator is a technical analysis tool that identifies fractal patterns on price charts. Fractals are recurring patterns that signal potential trend reversals or continuation points. This indicator marks both upward and downward fractals with colored arrows and can display price labels at these points. Key Features  Identifies upward fractals (magenta arrows) marking potential resistance levels Identifies downward fractals (blue arrows)
Major Swing Fibonacci Indicator - Professional Trading Tool What It Does Automatically detects major swing points not internal noise Generates buy/sell signals at key Fibonacci levels Displays professional GUI panel with real-time analysis Marks major swings with visual indicators Trading Strategy BUY at 38.2%-61.8% Fibonacci support in uptrends SELL  Past performance is not indicative of future results. This indicator is for educational and informational purposes only and does not constitute in
FREE
boom Spike Mitigation Zone Pro A professional spike pattern indicator built for synthetic traders who scalp and swing Boom 500/300/1000/600/900with precision.  This indicator: Detects powerful 3-candle spike formations (Spike → Pullback → Spike) Automatically draws a clean box around the pattern Marks the entry price from the middle candle Extends a horizontal mitigation line to guide perfect sniper entries Automatically deletes & redraws the line once price touches it (mitiga
FREE
1. Tool Description The   Dynamic Liquidity HeatMap Profile   is an advanced technical indicator . Unlike a standard Volume Profile which shows where volume   has   occurred, this tool attempts to visualize where liquidity (limit orders and stop losses) is   likely waiting   (resting liquidity). It works by identifying pivots (local highs and lows) weighted by volume and ATR.   Crucially, if price moves through a level, that liquidity is considered "swept" or "taken" and is removed from the map.
Crash Spike Mitigation Zone Pro A professional spike pattern indicator built for synthetic traders who scalp and swing Crash 500/300/1000 with precision.  This indicator: Detects powerful 3-candle spike formations (Spike → Pullback → Spike) Automatically draws a clean box around the pattern Marks the entry price from the middle candle Extends a horizontal mitigation line to guide perfect sniper entries Automatically deletes & redraws the line once price touches it (mitigation)
FREE
Description The Market Profile & Volume Profile Indicator is a powerful technical analysis tool designed to visualize market activity and price distribution over specific timeframes. Unlike standard technical indicators that focus solely on price over time, this indicator organizes price data to show where the market spent the most time (TPO) and where the most volume was traded (Volume Profile). It automatically calculates and displays key structural levels such as the Point of Control (POC) ,
super trend version is to help you to have real time view of market move it will help you to get a live view of current market  buy signal line and arrow to help you understand batter the direction sell signal line and arrow to help you understand batter the direction trade what you see not what you think this is an simple and best trading tool for our traders of any market crypto gold 
FREE
2025 Spike Killer Dashboard - Advanced Trading Signals & Market Analytics Transform Your Trading with Intelligent Market Insights! The 2025 Spike Killer Dashboard is a powerful MQL5 indicator that combines cutting-edge signal generation with an intuitive crystal dashboard for real-time market analysis. Designed for traders who demand precision and clarity, this all-in-one tool delivers actionable signals and comprehensive market metrics at a glance. Key Features: Dual Signal System Shved S
You Give an Instruction: When you run the script, a window pops up with a dropdown menu. You choose exactly what you want it to do from the list (e.g., "Close Profit Only" or "Delete Pending Orders"). It Scans Your Positions: The script then reads your instruction and systematically goes through your open trades and/or pending orders on the current chart. It Applies Your Rule: For each trade it finds, it checks if it matches the rule you selected. If you chose "Close Buy Only," it will only clo
Market Profile with Dashboard Indicator - Complete User Guide indicator Overview The Market Profile with Dashboard is a comprehensive trading analysis tool for MetaTrader 4 that displays market profile data, volume analysis, and key market structure information directly on your chart. This indicator helps traders identify significant price levels, market balance areas, and potential trading opportunities based on market profile theory. Core Components and Features Market Profile Display - Sh
Spike Blaster Pro – The Ultimate Spike Detection Tool Spike Blaster Pro is a next-generation MT5 indicator designed specifically for synthetic markets. It works seamlessly on Boom Index and Weltrade Index , providing traders with sharp, reliable spike detection signals. What makes Spike Blaster Pro powerful is its 5 Core Strategies built into one system, giving traders a multi-layer confirmation before signals appear. This ensures high accuracy and reduces false alerts. 5 Core Strategies B
Trading Guide MT5 Indicator - Ultimate Trading Psychology Assistant Description The Trading Guide MT5 Indicator is a powerful psychological trading assistant designed to keep traders disciplined, focused, and emotionally balanced. This innovative indicator displays real-time motivational messages, trading rules, and analysis guidelines directly on your chart, with vibrant blinking colors to capture your attention and reinforce proper trading habits.  Key Features Real-Time Trading Psychology
FREE
Liquidity Channels Pro  MT5 VERSION HERE   Liquidity Channels  is a sophisticated Smart Money Concepts (SMC) tool designed to automate the identification of     Buy Side Liquidity (BSL)   and     Sell Side Liquidity (SSL) . Unlike standard support and resistance indicators, this tool doesn't just draw lines; it projects     dynamic expanding channels   based on volatility (ATR) from key pivot points. Crucially, it follows the "Mitigation" logic used by institutional traders:     once liquidity i
How to Use the Features       MT5 VERSION   TRADE COPIER Select Role: On the account sending trades, choose Sender (Master Account) . On the account receiving trades, choose Copier (Receiver Account) . Lot Size Mode: Same Lot Size as Master: Ignores multipliers, copies exactly what the Master has. Multiply Master Lot Size: Uses the "Lot Multiplier" field (e.g., Master 0.10, Multiplier 2.0 = Copier 0.20). Use Fixed Lot Size: Ignores Master's volume entirely, uses the "Fixed Lot Size" field for ev
Money Flow Profile MT5 HERE   Master Edition is a professional-grade analytical tool designed to visualize market structure through the lens of volume and money flow. Unlike standard volume indicators, this tool displays a Daily Volume Profile directly on your chart, allowing you to see exactly where price discovery occurred and where the "smart money" is positioned. This Master Edition is engineered for clarity and speed, featuring a unique Auto-Theme Sync system that instantly beautifies you
What is Volume Spread Analysis? Volume spread analysis (VSA) seeks to establish the cause of price movements. The “cause” is quite simply the imbalance between supply and demand in the market, which is created by the activity of professional operators (smart money). Who are these professional operators? In any business where there is money involved and profits to make, there are professionals. The activity of these professional operators, and more important, their true intentions, are clearly
Trend Identification: Look for the color change. When candles turn Green , look for Buy opportunities. When they turn Red , look for Sell opportunities. Entry: Enter on the break of the trend line or on the pullback to the line. Stop Loss: Use the TREND dashed line (Trailing Stop) as your dynamic stop loss. As the trend continues, this line will follow the price, locking in profit. Take Profit: Use the automatically calculated Fibonacci targets (TP1, TP2, TP3) shown on the dashboard and chart l
A Smart Price Imbalance Tool with Arrows, Labels, and FVG Zones The Fair Value Gap (FVG) Indicator is designed to automatically detect price imbalance zones on the chart – a widely used concept in Smart Money Concepts (SMC) and Institutional Trading Models (ICT) . These gaps, also known as imbalances or inefficiencies , often highlight areas where price may return to "rebalance" liquidity. Many professional traders consider these levels as high-probability zones for potential reversals, retrace
Smart Risk Manager – Risk/Reward Ratio & Position Sizing Tool for MT5 Overview (Short Description) A professional risk management indicator that helps traders calculate lot size, risk percentage, and reward ratio in real time. Perfect for Forex, Indices, Gold, and Synthetic Indices traders who want precise control over their capital. Full Description Trading without proper risk management is like driving without brakes. The Smart Risk Manager for MT5 gives you full control over your position siz
Bollinger Fibo Pro: The Ultimate Fusion of Volatility, Fibonacci, and Trend Analysis Short Description: Stop overloading your charts with dozens of indicators.   Bollinger Fibo  Pro   is a sophisticated, all-in-one trading system for MetaTrader 5 that merges two legendary concepts into a single, powerful tool. It enhances standard Bollinger Bands with precise Fibonacci extension levels and couples them with a non-repainting ZigZag to accurately identify trends, reversals, and key market structu
Smart Trend pro New - Advanced Trend Indicator with Interactive GUI Professional trend-following indicator with comprehensive visualization and control panel Key Features: Advanced Trend Detection Reliable Half Trend algorithm for precise trend identification Color-coded trend lines (Blue for bullish, Orange for bearish) Customizable amplitude parameter for different trading styles Interactive GUI Panel Real-time market strength visualization (Bulls vs Bears) Current signal display (Buy/Se
FiboPivot Dashboard - Professional Pivot Point Indicator What It Does FiboPivot Dashboard is a powerful technical analysis tool that automatically calculates and displays Fibonacci-based pivot points on your chart. It identifies key support and resistance levels based on the previous day's price action, helping traders anticipate potential price reversal points and breakout levels.   How to Use 1. **Install & Apply**: Simply attach the indicator to any chart (time frames below D1) 2. **
FiboPivot TrendLines - Comprehensive Market Analysis Indicator This powerful indicator combines Fibonacci pivot point analysis with automatic trend line detection, providing traders with a complete technical analysis toolkit in a single tool. Key Features : - Fibonacci Pivot Points: Automatically calculates and displays R1-R3, Pivot, and S1-S3 levels using previous day's data - Fractal-Based Trend Lines: Automatically draws channel trend lines based on fractal patterns - Interactive
11 Modules Description & Final Analyzer Trading Guide 1. Reaction Engine 2.0 Purpose : Measures market pressure by analyzing tick movements, volume, and speed within a time window.   How it works : Calculates weighted price changes, considers tick velocity and volatility, and applies EMA smoothing.   Trading use : Strong positive values indicate buying pressure Strong negative values indicate selling pressure Use as confirmation for entry/exit signals 2. Flow Pattern Detector Purpose : Identifie
Big bull scalper Short Description Master market structure with the precision of the popular Big bull scalper  This tool automatically identifies key pivot highs and lows, plotting unique "angling" trend lines that dynamically define market context. It visually confirms Breaks of Structure (BOS) and Changes of Character (CHoCH), removing all guesswork from your analysis. Key Features:    Automatic Pivot Detection Instantly spots significant swing highs and lows.    Dynamic Angling Lines Visual
Colors schemes powerful MetaTrader 5 script designed for traders who value speed and a personalized trading environment. With a single click, you can instantly transform your chart's appearance using one of several professional, pre-designed color schemes, including popular styles like ICT/SMC. How to Use: In your MetaTrader 5 terminal, open the Navigator window (Ctrl+N). Find the Colors schemes script under the "Scripts" section. Drag and drop the script onto the chart you want to customize. A
The   Trend Analysis Dashboard   is a powerful, all-in-one technical analysis tool designed for traders who need a clear, consolidated view of market momentum across multiple timeframes. Instead of cluttering your chart with numerous separate indicators, this tool aggregates signals from four key oscillators (Stochastic, RSI, and dual CCI) into a single, easy-to-read panel. It calculates the directional bias (Buy, Sell, or Neutral) for each enabled timeframe and provides a visual summary of over
フィルタ:
Raikhan Iskakova
176
Raikhan Iskakova 2026.03.29 17:32 
 

ユーザーは評価に対して何もコメントを残しませんでした

Israr Hussain Shah
11674
開発者からの返信 Israr Hussain Shah 2026.03.29 18:13
try it and let me know thanks for feadback
レビューに返信