Enhanced TP SL
- インディケータ
- バージョン: 1.10
- アップデート済み: 26 5月 2026

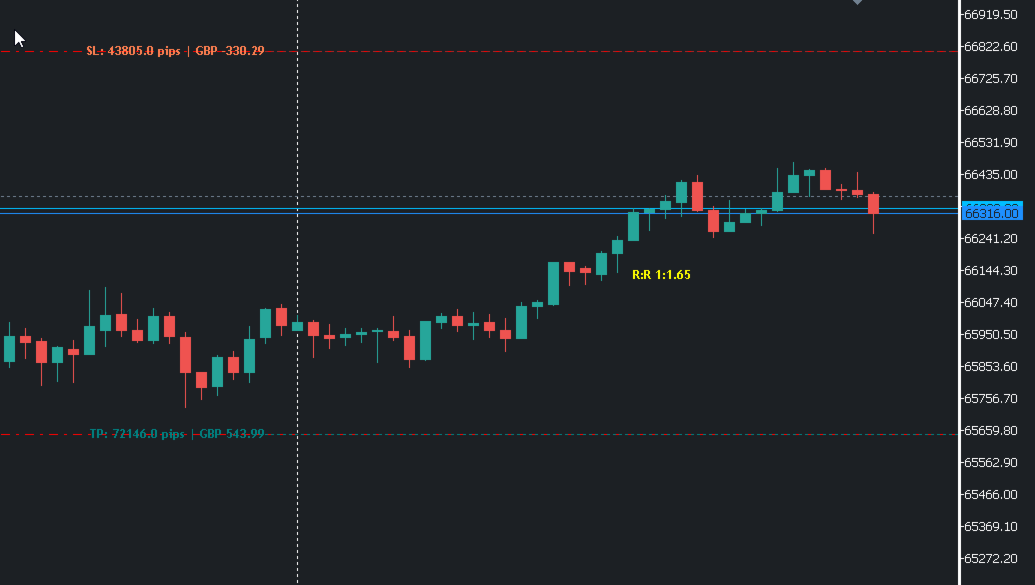
Instantly see your TP/SL levels with pip distances, profit in account currency, and risk‑reward ratio—fully customizable lines on the chart.
Extended Description for Market Listing:
The Enhanced TP/SL Indicator transforms your trading experience by displaying Take Profit and Stop Loss levels directly on the chart for each open position. No more guessing - every line shows the exact distance in pips, the expected profit/loss in your account currency, and even calculates the risk‑reward ratio. 10 Trades per symbol.
Key Features:
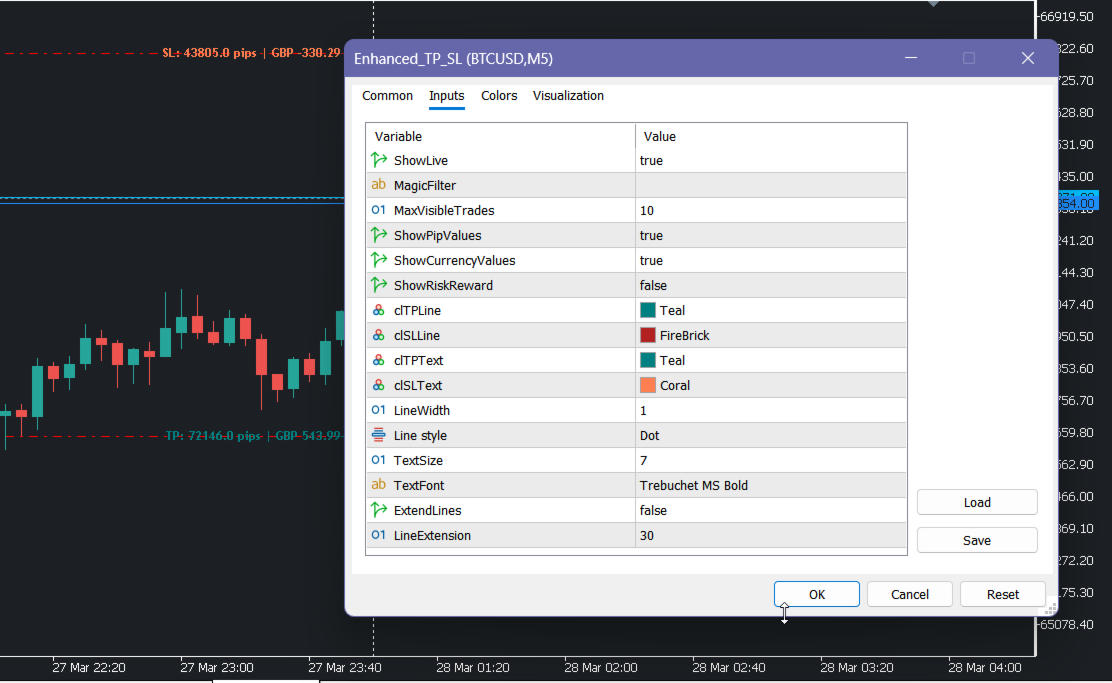
Draws horizontal TP/SL lines with full visual customization (color, width, style).
Displays pip value and monetary value (in account currency) next to each line.
Calculates and shows the risk‑reward ratio (R:R) for each trade.
Magic number filter - show only positions with specific magic numbers.
Limits the number of visible trades to avoid chart clutter.
Lines extend to the right, with optional extension length.
Automatically updates when positions are opened or closed.
Perfect for manual traders, scalpers, and anyone who wants a clear, at‑a‑glance view of their open trades’ targets and risk.