MTF HighLow
- インディケータ
- バージョン: 1.40
- アップデート済み: 2 4月 2026

A standout feature is the Live vs. Closed H1 toggle for the Today level, giving you full control over whether the level updates intrabar (live) or only after each H1 bar closes (stable). This ensures the indicator behaves identically on MT4 and MT5, making it ideal for traders who use both platforms.
Key Features
-
Multiple Timeframes:
-
Today (TDY)
-
Yesterday (YTD)
-
Last 7 Days (7D)
-
Last 30 Days (30D)
-
-
Two Modes for Today’s Level:
-
Closed H1 Mode (default): Uses only completed H1 bars → stable, no repaint.
-
Live Mode: Includes the current forming H1 bar → updates in real time for visual feedback.
-
-
Customizable Appearance:
-
On/off toggle for each level
-
Line color, style, width
-
Optional price labels (show/hide, size, position)
-
Prefix for object names (avoids conflicts)
-
-
Automatic NY Session Detection:
-
Session start/end based on New York time (configurable start hour).
-
Handles DST changes and weekend gaps seamlessly.
-
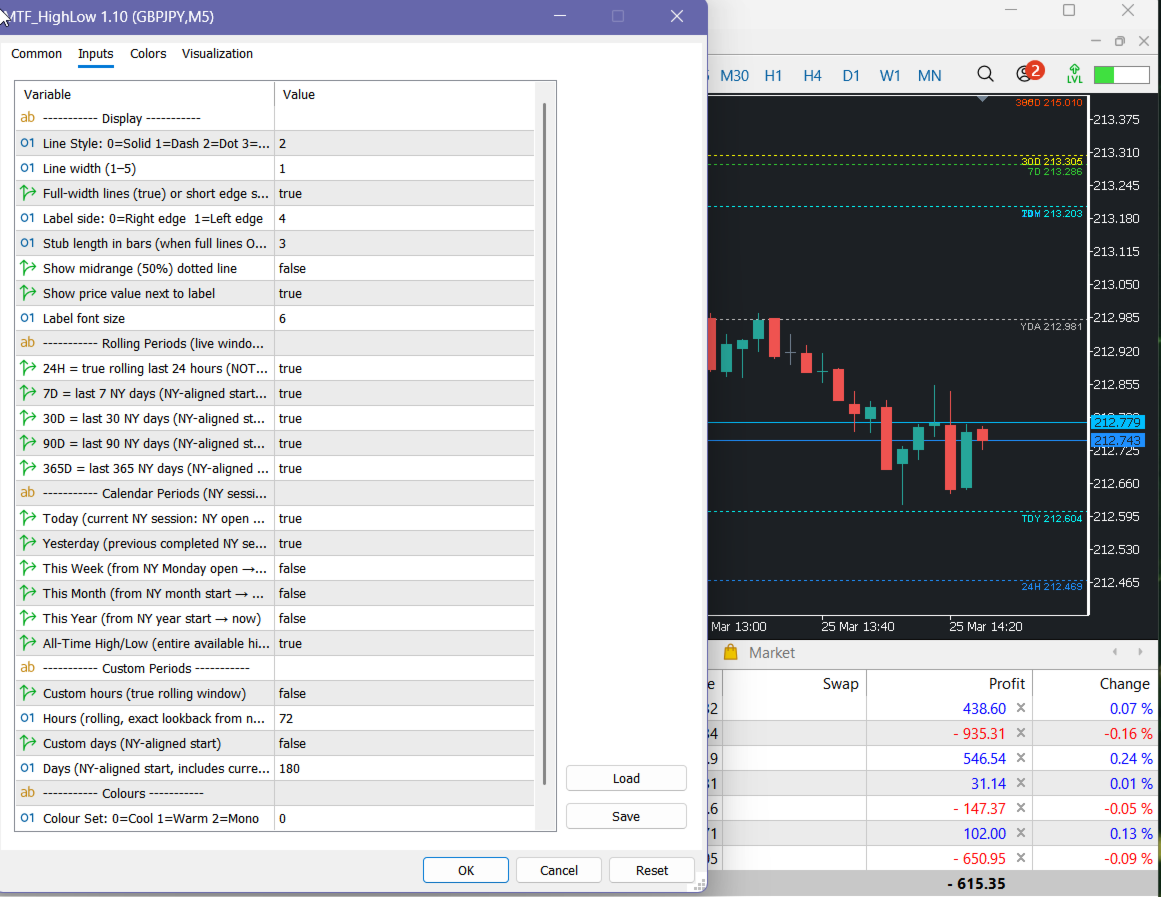
Input Parameters
| Parameter | Description |
|---|---|
| Display | Enable/disable the entire indicator |
| ShowToday | Show Today’s high/low |
| ShowYesterday | Show Yesterday’s high/low |
| Show7Days | Show the high/low of the last 7 days |
| Show30Days | Show the high/low of the last 30 days |
| UseClosedH1 | true = stable (closed H1 bars only) / false = live (updates intrabar) – applies only to Today |
| ShowPriceTag | Display price labels next to each level |
| LabelSize | Font size for price labels |
| Prefix | Prefix for all drawn objects (useful when running multiple instances) |
Each level also has its own color, line style, and width settings.
Why the Toggle Matters
In MT5, by default, levels are often updated using the current bar’s high/low, which can repaint. In MT4, the iHigh() and iLow() functions give the closed bar values. The UseClosedH1 toggle bridges this gap:
-
UseClosedH1 = true → MT4 behaves like MT5’s “stable” mode (ideal for backtesting and signal generation).
-
UseClosedH1 = false → MT4 matches MT5’s “live” mode (perfect for discretionary trading and visual monitoring).
This parity ensures you can rely on the same logic regardless of the platform you are using.
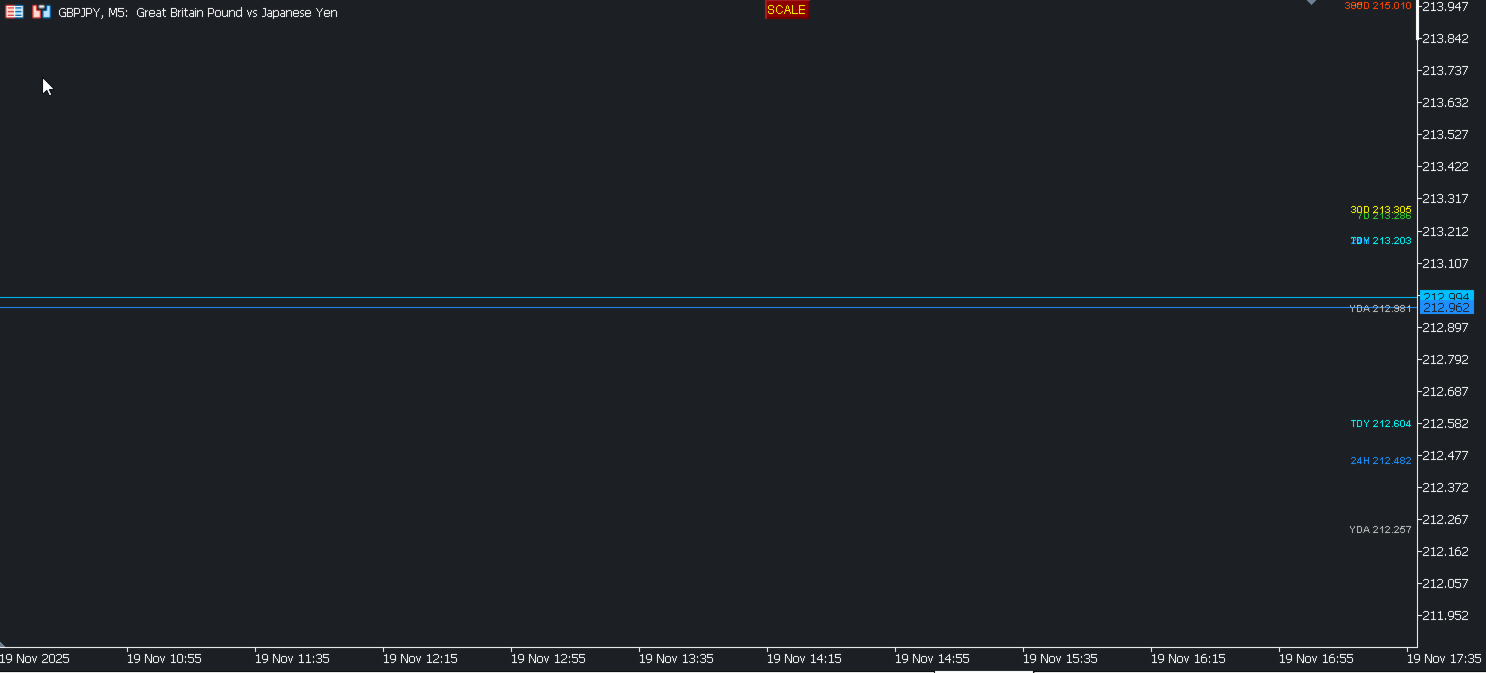
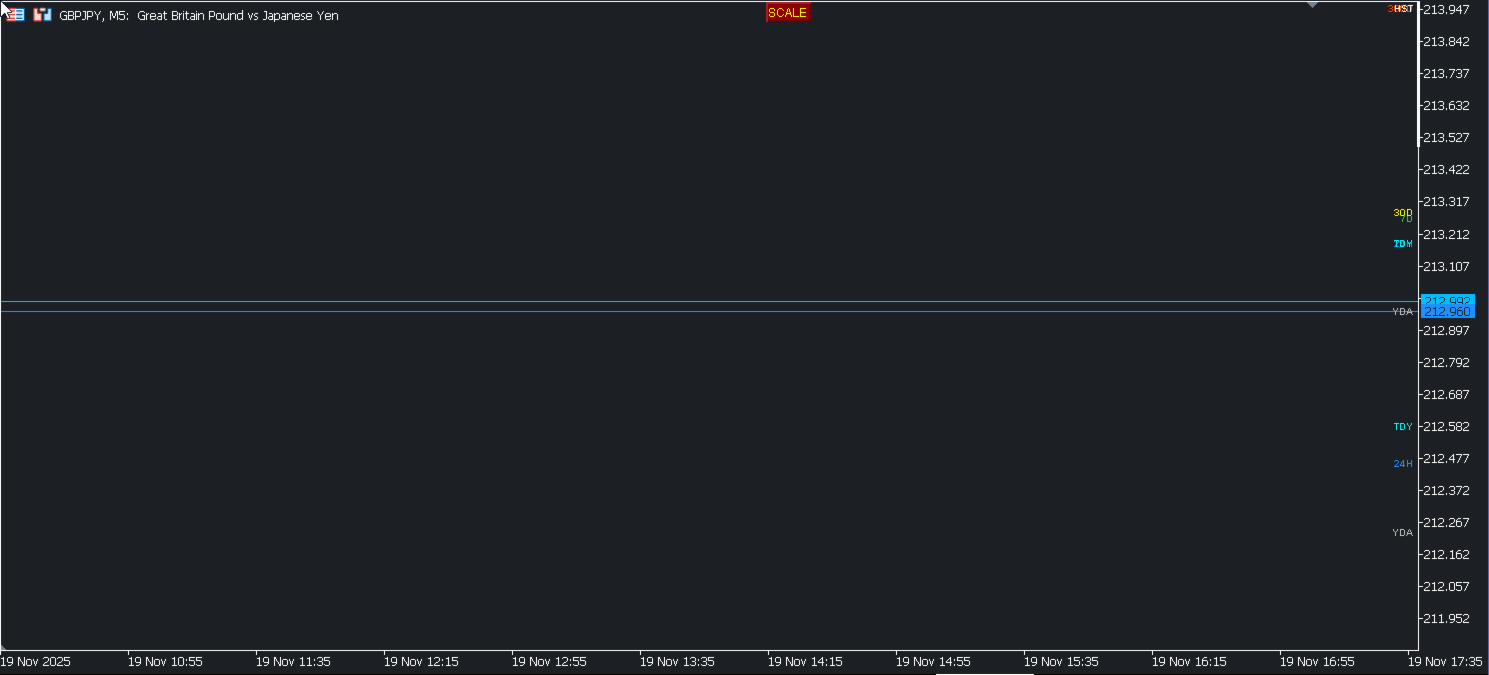
The indicator draws horizontal lines and optional price labels. All objects are named with the chosen prefix and can be managed programmatically if needed.