MACD FuturePredict Panel Pro MT4
- インディケータ
- バージョン: 1.1
- アップデート済み: 8 5月 2026
- アクティベーション: 5

MACD FuturePredict Panel Pro MT4
Predictive MACD-style momentum, signal scoring, and execution guidance in one professional trading panel.
MACD FuturePredict Panel Pro is an advanced momentum dashboard for MetaTrader 4. It is designed to help traders read market direction, momentum strength, higher-timeframe bias, signal quality, and execution context from one clean on-chart panel.
Instead of relying only on a basic MACD crossover, the indicator evaluates momentum pressure, trend condition, volatility state, projection direction, higher-timeframe alignment, and signal confidence before displaying a trade-ready reading.
The goal is simple:
Is momentum strong enough? Is the setup aligned? Is this a trade condition or a no-trade condition?
MACD FuturePredict Panel Pro is built for traders who want earlier momentum context, cleaner signal confirmation, and a structured way to avoid weaker market conditions.
What the Indicator ShowsThe indicator displays a predictive MACD-style signal window with a live dashboard.
The panel can show:
BUY / SELL / WAIT status Trend direction Volatility condition Histogram momentum state Predictive direction Higher-timeframe bias Confidence percentage Score out of 7 Execution status ENTRY / SL / TP reference levels Signal statistics
This gives traders a fast reading of both direction and signal quality.
Signal Panel Readings
The panel is designed to be read quickly.
Example:
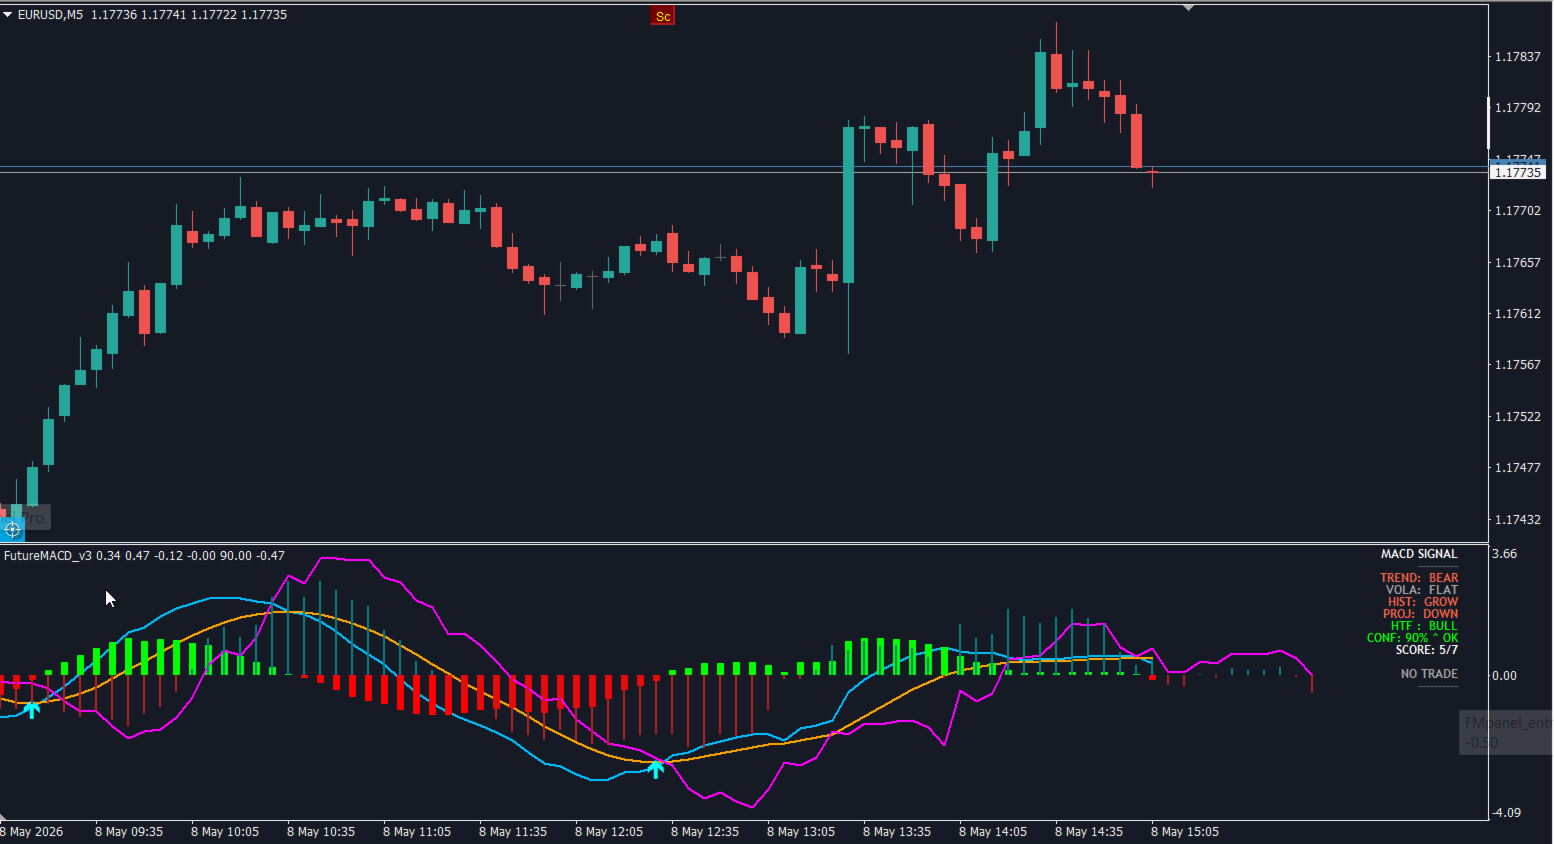
TRND: BULL VOLA: FLAT HIST: GROW PROJ: DOWN HTF: BULL CONF: 65% OK SCORE: 4/7 NO TRADE
Plain English:
The main trend and higher timeframe are bullish, histogram momentum is improving, but projection is not aligned and the total score is not strong enough for a valid execution setup.
This helps traders avoid entering just because one part of the market looks positive.
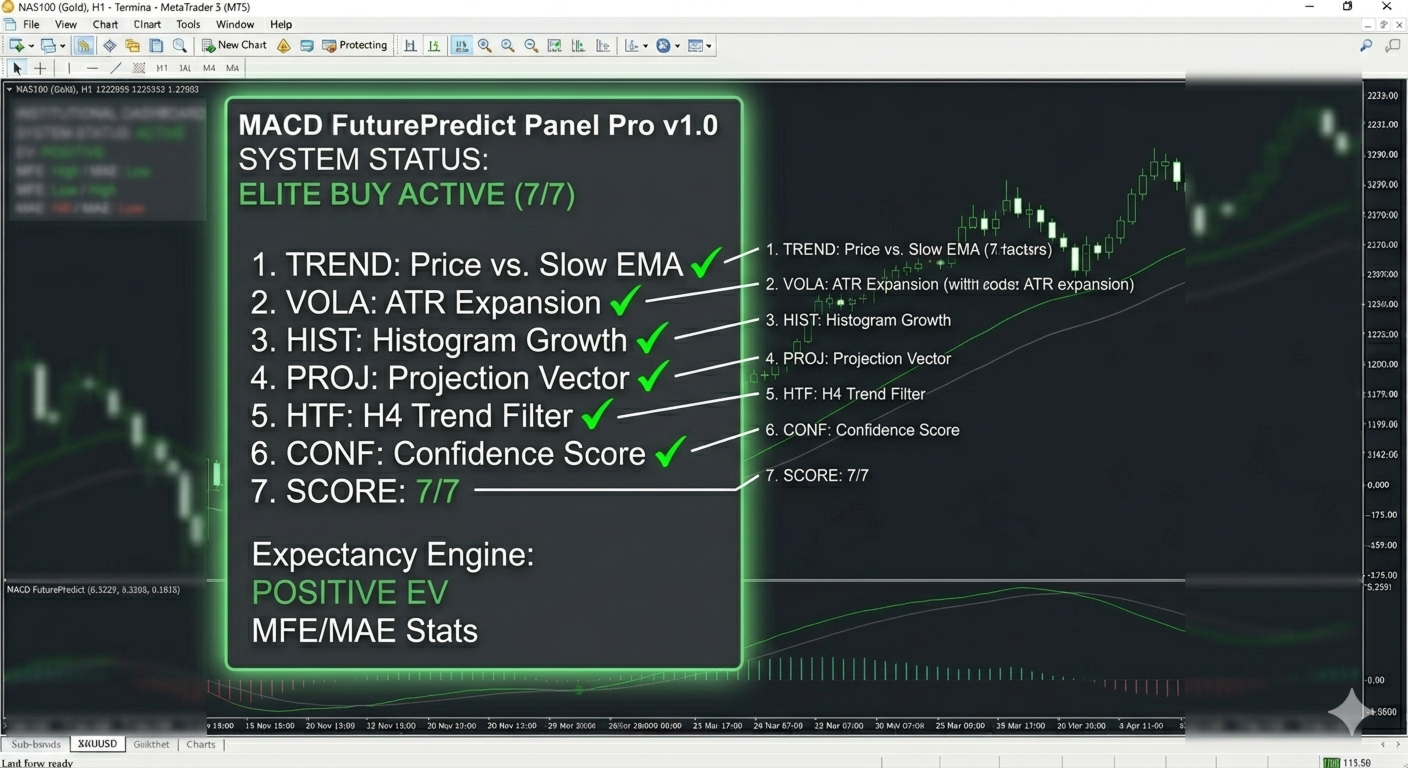
7-Factor Signal Score
MACD FuturePredict Panel Pro does not treat every signal equally.
Each setup is evaluated using a 7-part scoring model.
The score helps classify the market condition:
Low score = weak or mixed conditions Medium score = developing setup High score = stronger alignment Full score = strongest condition
This gives traders a clearer view of signal quality instead of reacting to every MACD movement as if it had the same value.
Signal Status
The panel can display different signal states depending on market quality.
Typical readings include:
BUY SELL WAIT NO TRADE
A BUY or SELL reading means directional conditions are stronger.
WAIT or NO TRADE means the indicator does not see a clean execution setup at that moment.
This is important because many losing trades happen when direction exists, but the full setup quality is not strong enough.
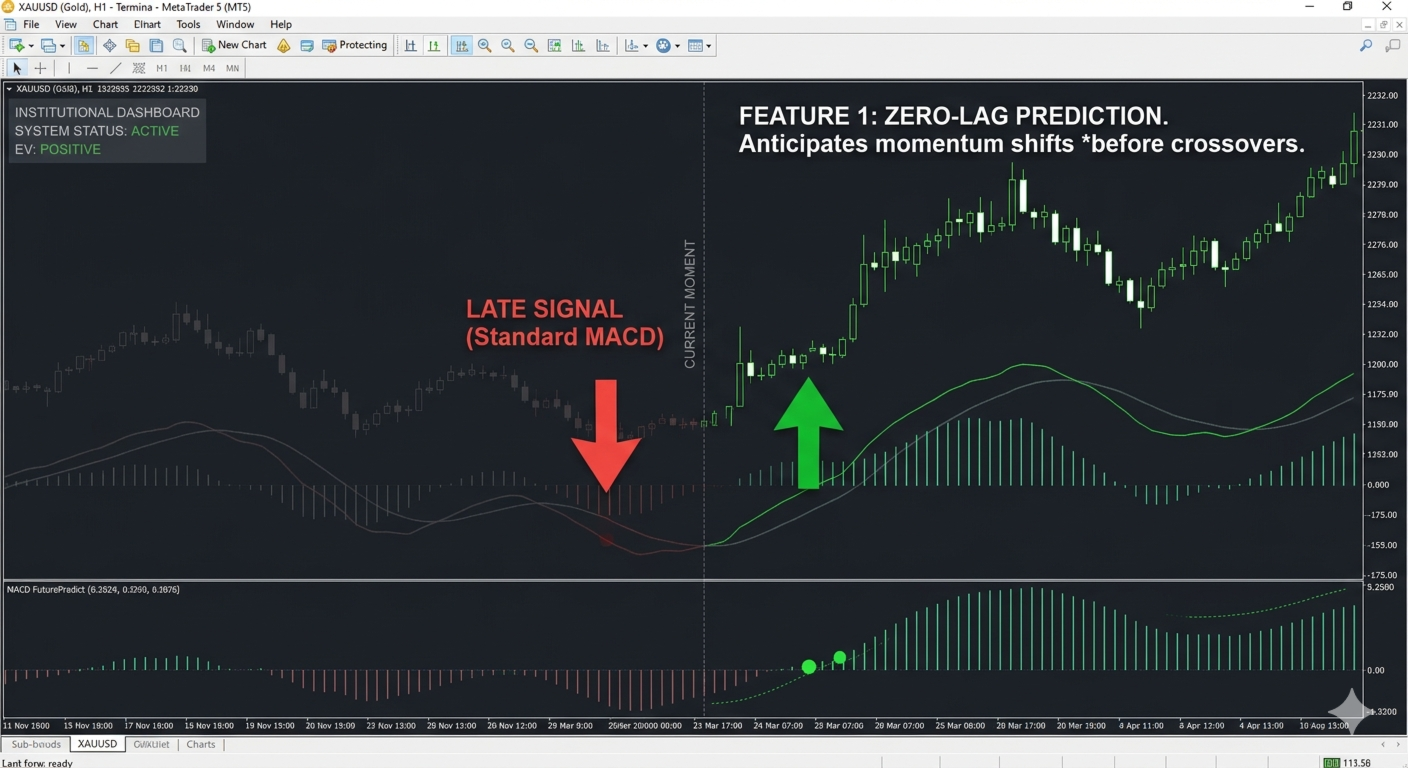
Predictive Momentum View
Traditional MACD tools usually react after momentum has already shifted.
MACD FuturePredict Panel Pro is designed to give earlier context by reading the current momentum state and projected direction.
The projection reading helps traders understand whether momentum is still supporting the move or starting to weaken.
Example:
TRND: BULL PROJ: UP HTF: BULL
Plain English:
The current direction, projected direction, and higher timeframe are aligned bullish.
Another example:
TRND: BULL PROJ: DOWN HTF: BULL
Plain English:
The broader direction may still be bullish, but short-term momentum is weakening or pulling back.
Higher-Timeframe Bias
The indicator includes higher-timeframe context to help traders avoid trading against the larger market environment.
This is useful for intraday traders who want to take lower-timeframe signals while still respecting the bigger picture.
Example:
M15 signal = BUY HTF bias = BULL
This shows better alignment.
Example:
M15 signal = BUY HTF bias = BEAR
This warns that the lower-timeframe signal may be trading against broader pressure.
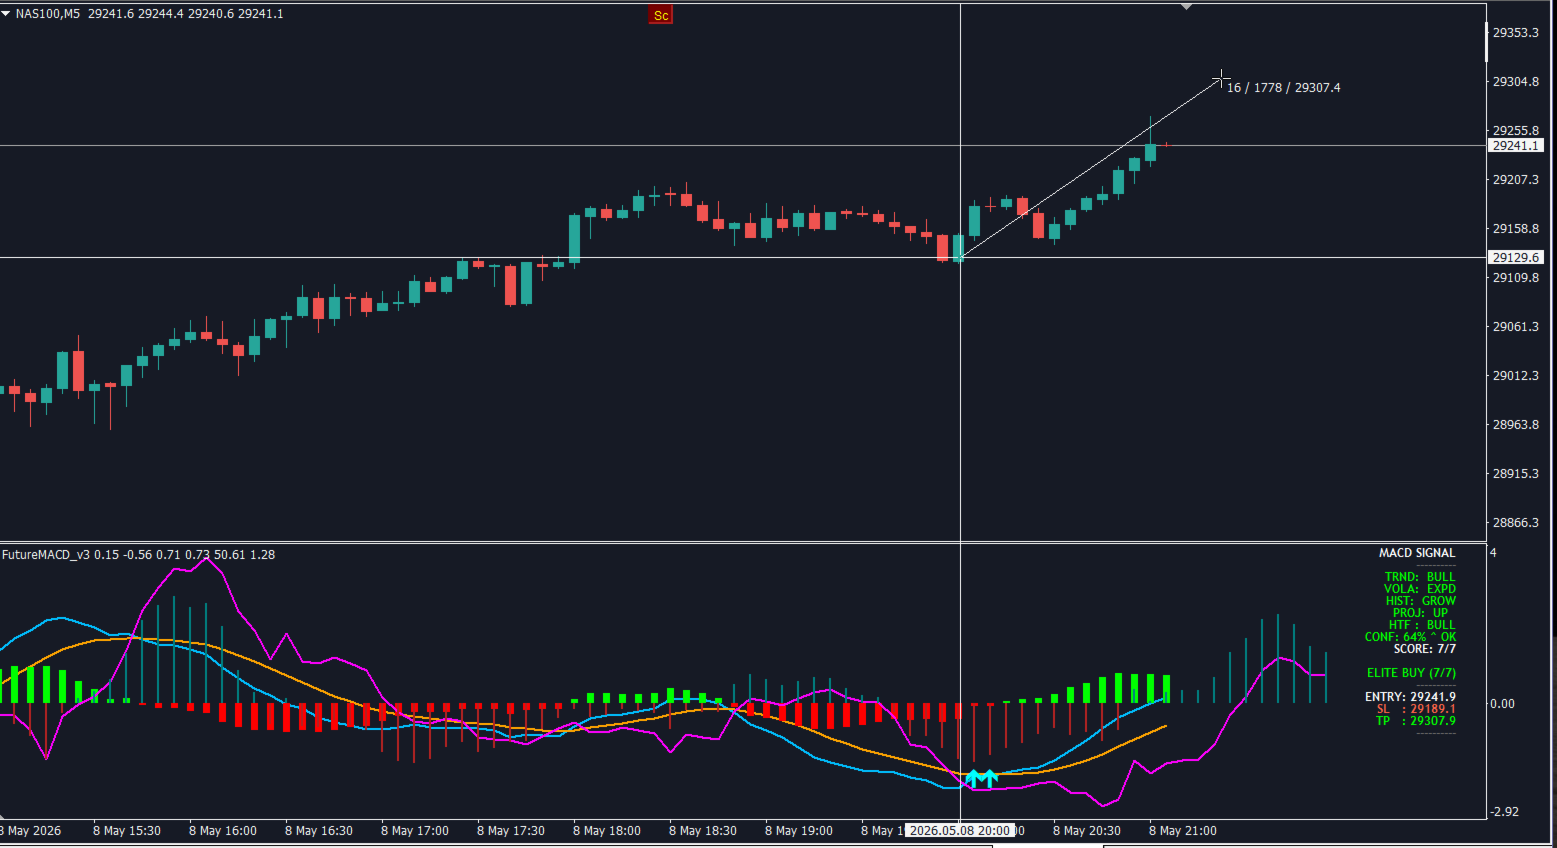
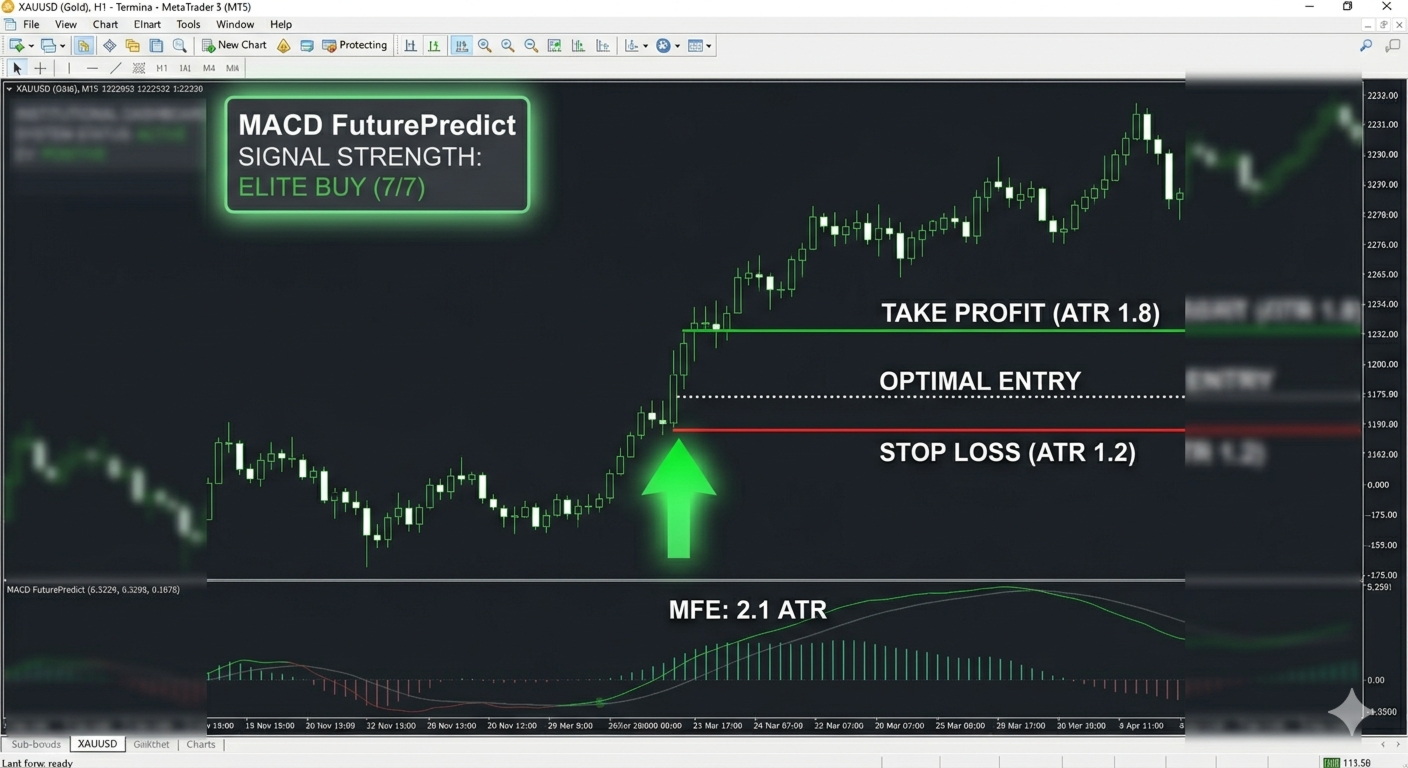
Entry, Stop Loss, and Take Profit References
When market conditions qualify, the indicator can display reference levels directly on the chart:
ENTRY SL TP
These levels are not automatic trade commands. They are decision-support references to help traders frame a possible setup with clearer risk and reward context.
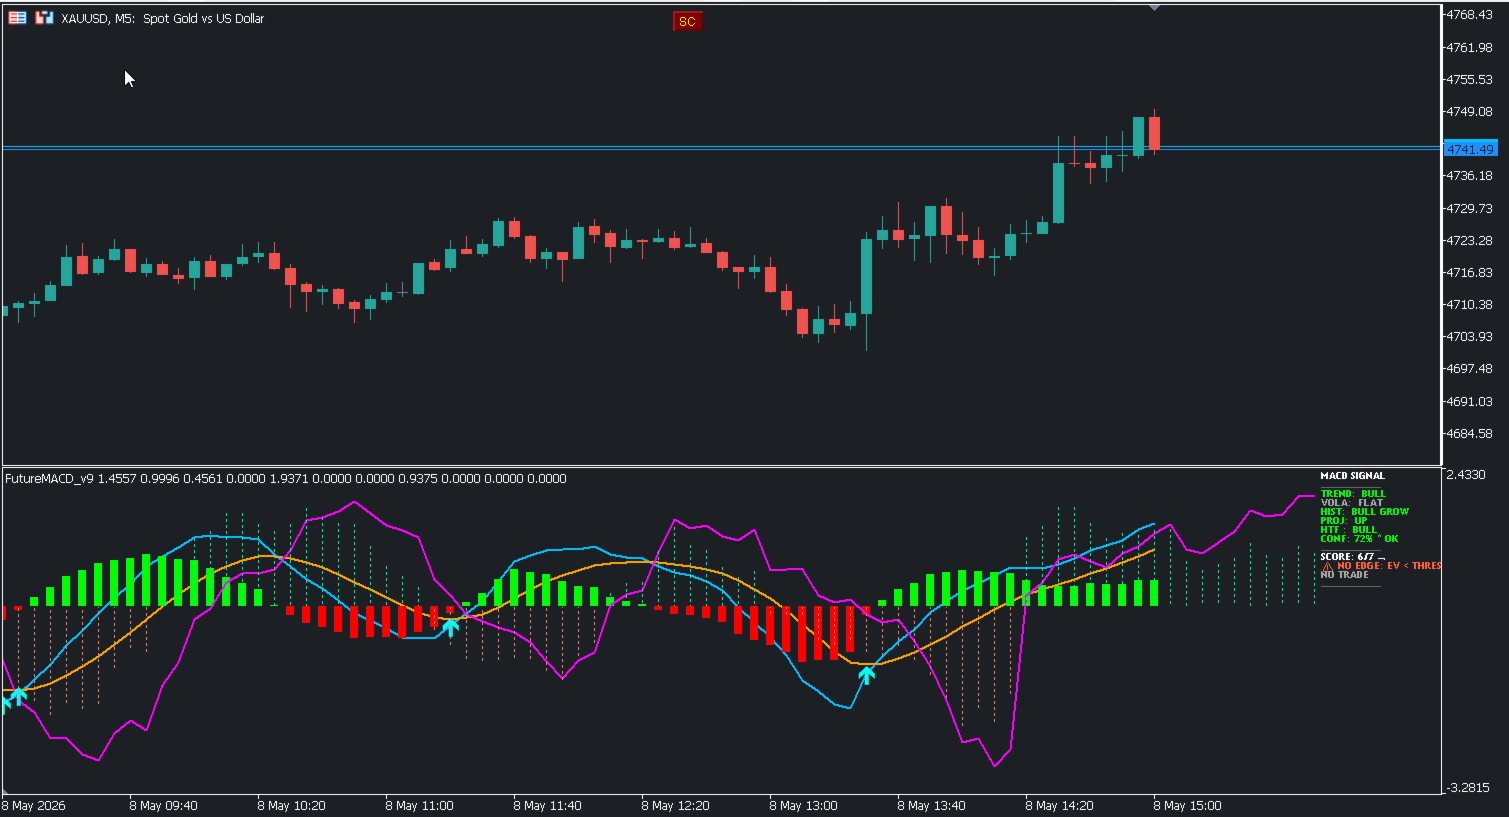
When the setup does not qualify, the panel can withhold execution guidance and show a NO TRADE or NO EDGE condition.
This helps prevent forcing trades in mixed or low-quality conditions.
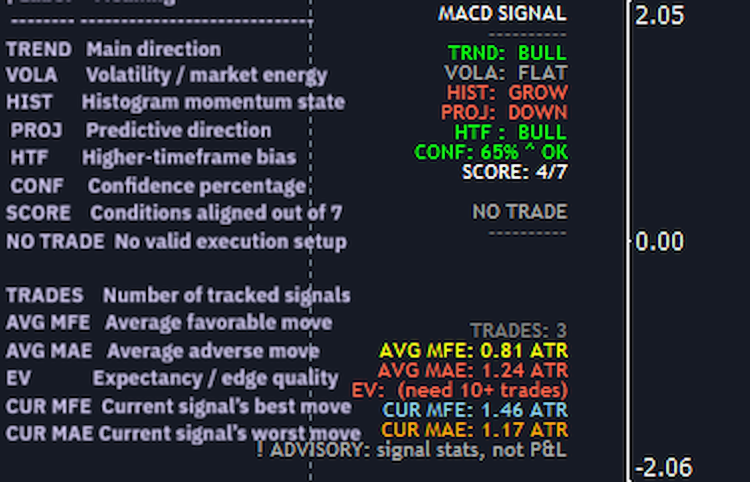
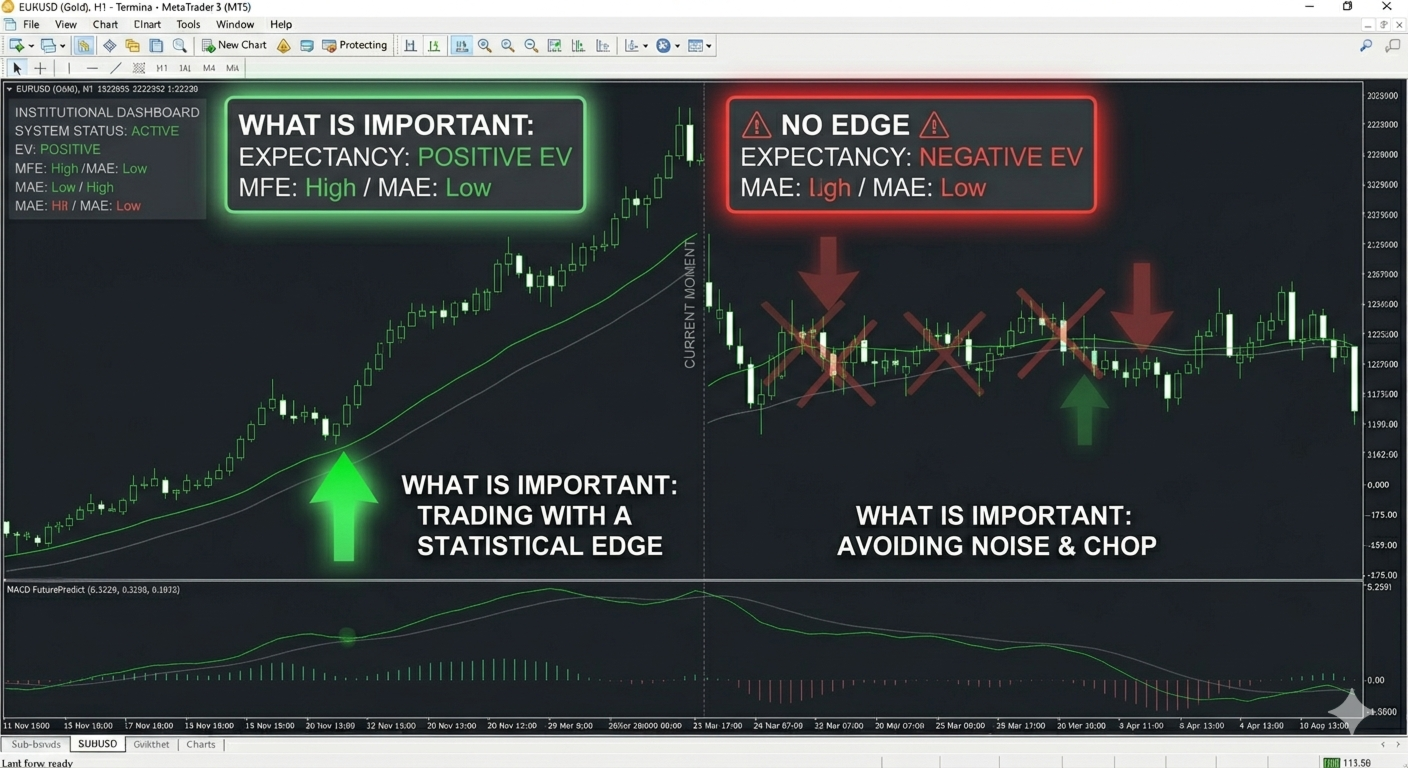
Signal Statistics Panel
MACD FuturePredict Panel Pro also includes a signal statistics section.
It can track movement quality after signals using volatility-adjusted readings:
TRADES AVG MFE AVG MAE EV CUR MFE CUR MAE
Plain English:
AVG MFE = average favorable movement after signals AVG MAE = average adverse movement after signals EV = estimated signal quality / edge CUR MFE = current signal’s best favorable move CUR MAE = current signal’s worst adverse move
These readings help traders understand whether recent signals are producing useful movement on the current symbol and timeframe.
The panel also reminds users that these statistics are signal-quality feedback, not guaranteed profit/loss results.
NO EDGE / NO TRADE Protection
One of the most useful parts of the indicator is its ability to warn when conditions are not good enough.
A market can show direction but still lack clean execution quality.
When conditions are mixed, weak, or not aligned, the indicator can display:
NO TRADE NO EDGE WAIT
This helps traders stay disciplined and avoid low-quality setups.
Confirmed Arrows
The indicator can display confirmed BUY and SELL arrows after candle close.
This makes signals cleaner and helps reduce live-bar noise.
Arrows are designed as confirmed signal markers, while the panel gives the deeper explanation behind the signal condition.
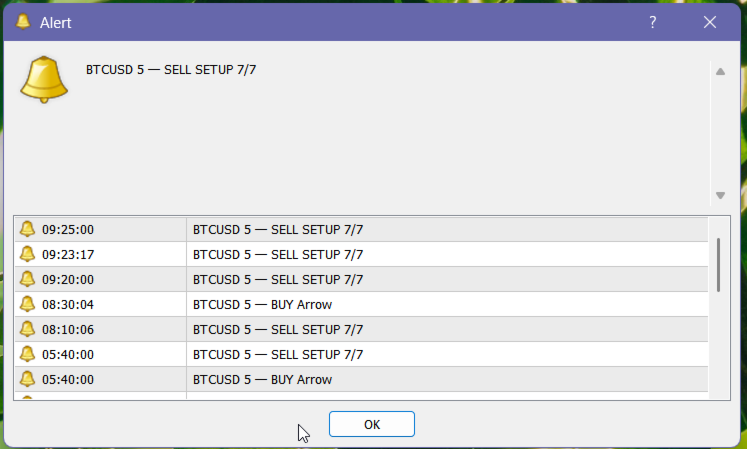
Alerts
MACD FuturePredict Panel Pro includes optional alerts so traders do not need to watch every chart manually.
Available alert types include:
desktop popup sound alert mobile push notification email alert
Alerts can help you monitor momentum shifts, confirmed signals, and important setup changes.
Key Features
-
Predictive MACD-style momentum dashboard
-
BUY / SELL / WAIT / NO TRADE panel status
-
7-factor signal scoring model
-
Trend, volatility, histogram, projection, and HTF readings
-
Confidence percentage and setup score
-
Confirmed BUY and SELL arrows
-
ENTRY, SL, and TP reference levels
-
Signal statistics panel
-
MFE, MAE, and EV-style movement feedback
-
Higher-timeframe bias filter
-
Optional popup, sound, push, and email alerts
-
Clean professional chart layout
-
Suitable for forex, gold, indices, and crypto
-
Useful for scalping, day trading, and swing trading
-
Designed for multi-chart use
How to Read the Panel
Example strong condition:
TRND: BULL VOLA: OK HIST: GROW PROJ: UP HTF: BULL CONF: 80% OK SCORE: 6/7 BUY
Plain English:
Trend, momentum, projection, and higher-timeframe context are mostly aligned. This is a stronger bullish condition.
Example weak condition:
TRND: BULL VOLA: FLAT HIST: GROW PROJ: DOWN HTF: BULL CONF: 65% OK SCORE: 4/7 NO TRADE
Plain English:
Some bullish conditions exist, but projection and overall score are not strong enough. The indicator warns that this is not a clean execution setup.
Who This Indicator Is For
MACD FuturePredict Panel Pro is useful for traders who want:
momentum confirmation MACD-style signal context higher-timeframe alignment clear trade / no-trade guidance signal quality scoring visual ENTRY / SL / TP reference levels movement-quality feedback
It is suitable for:
scalpers day traders swing traders EA developers manual traders multi-symbol traders prop firm traders
Recommended Use
A simple workflow:
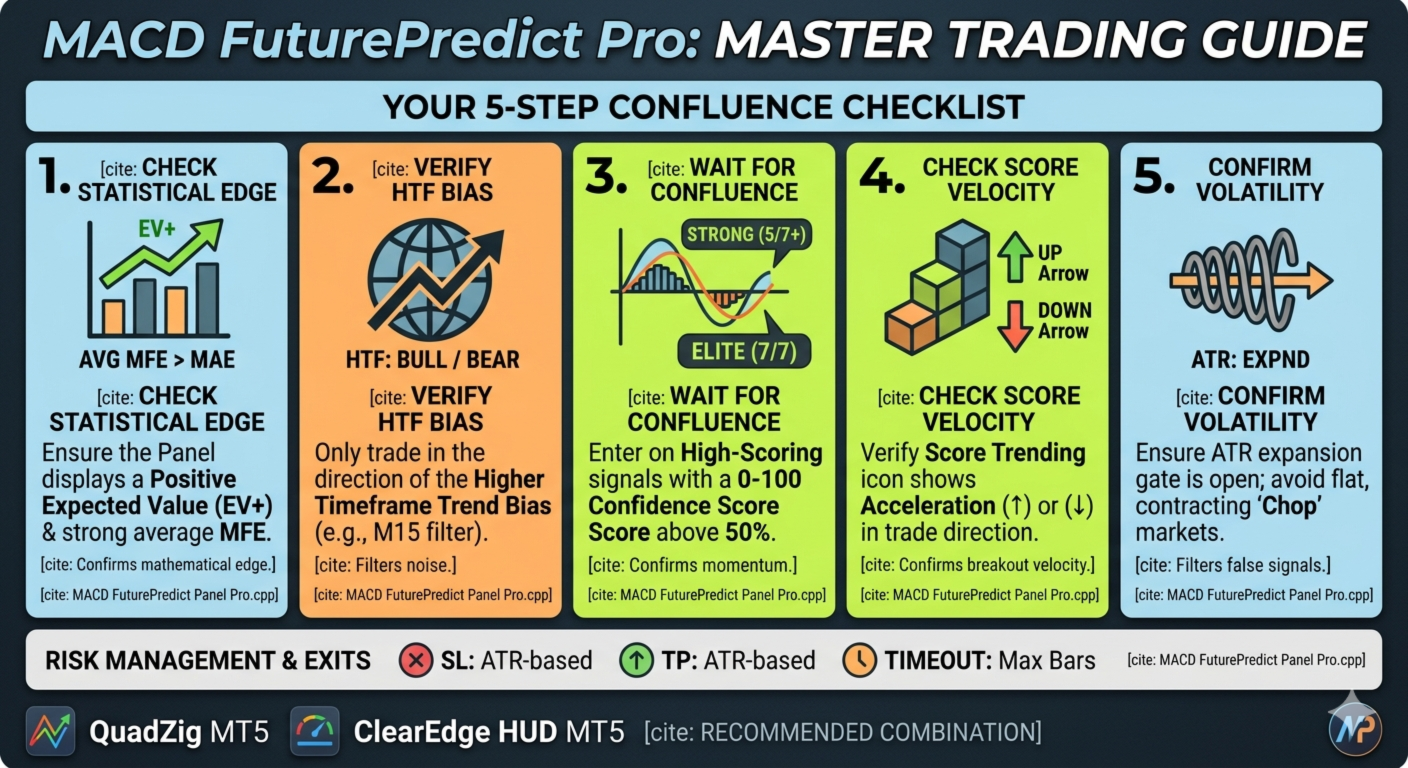
1. Check BUY / SELL / WAIT status 2. Review trend and projection direction 3. Confirm higher-timeframe bias 4. Check confidence and score 5. Use ENTRY / SL / TP only when shown 6. Avoid NO TRADE or NO EDGE conditions 7. Apply your own risk management
The indicator works best as a decision-support tool, not as a blind entry system.
It can be combined with market structure, support and resistance, volatility filters, price action, or your own trading strategy.
Important Note
MACD FuturePredict Panel Pro is not a guaranteed signal system.
It provides structured momentum analysis, signal scoring, and execution context. Market conditions can change quickly, and all trading decisions should be made with proper risk control.
PriceIntroductory Price: $59
Available for MT4 and MT5.
Early buyers receive future updates free.
Demo version runs in Strategy Tester only.
Live chart access requires rental or full purchase.
Your Feedback Matters
If MACD FuturePredict Panel Pro helps improve your momentum reading and trade discipline, please leave a 5-star rating and review.
⭐⭐⭐⭐⭐
Disclaimer
Trading involves risk. MACD FuturePredict Panel Pro provides market analysis and decision-support information only. It does not guarantee profits and is not financial advice. Always use proper risk management and follow your own trading plan.