Sessions Duck
- ユーティリティ
- バージョン: 1.23

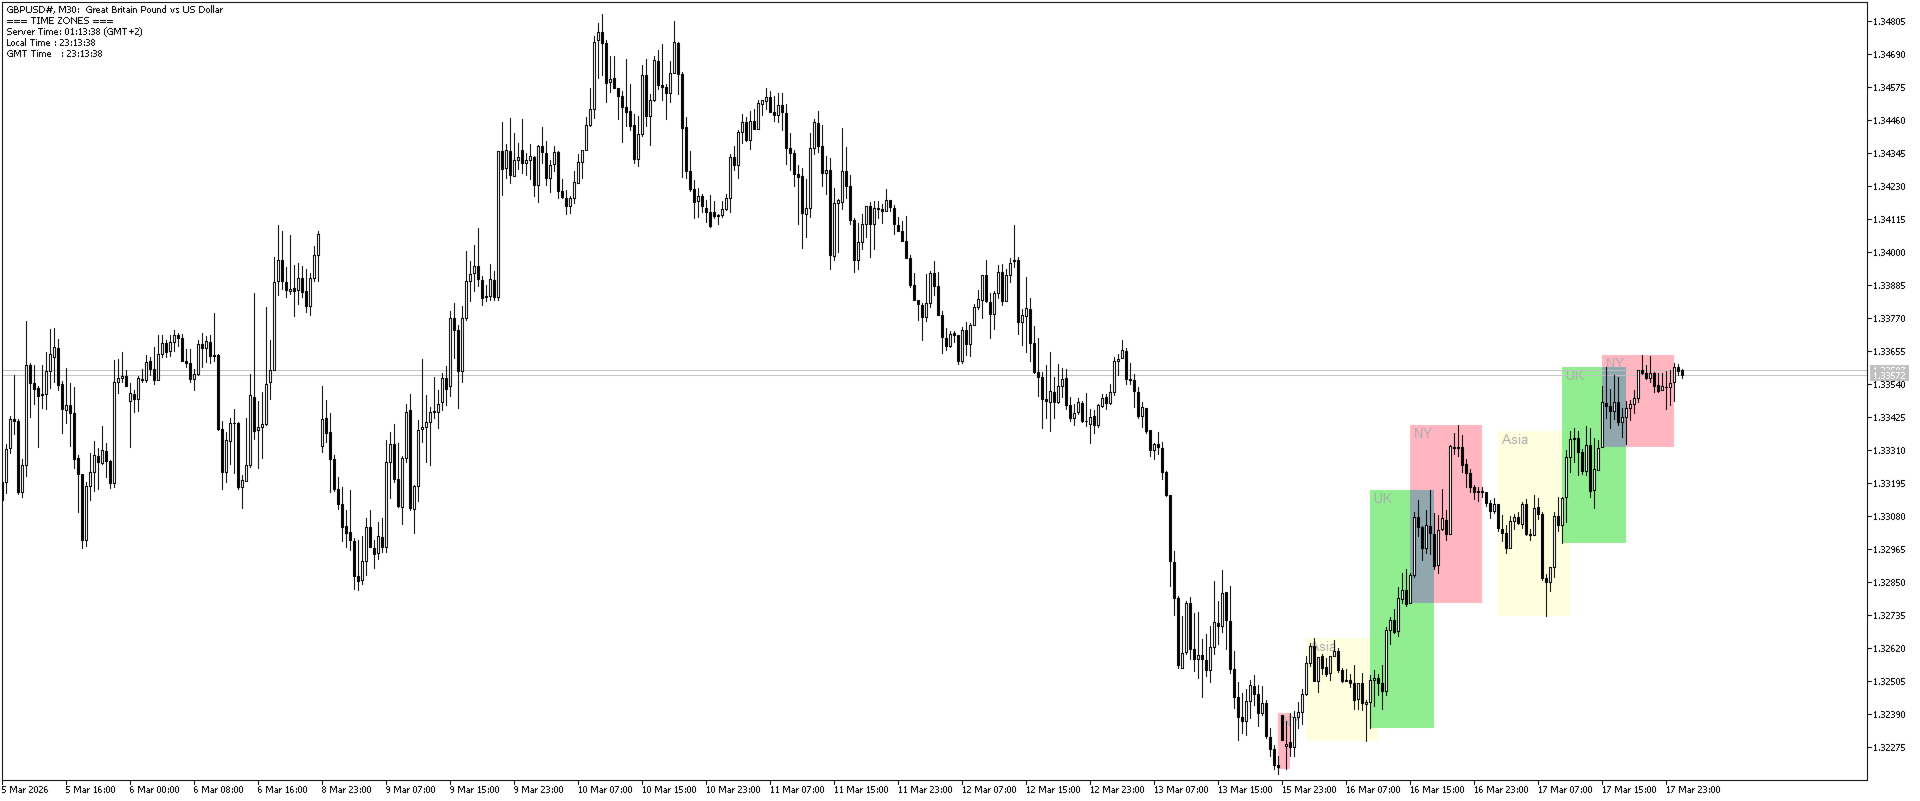
Sessions Duck is a highly optimised, resource-efficient MetaTrader 5 indicator designed to automatically visualise the core global trading sessions (Asia, London, New York) and display critical timezone data directly on your chart.
Built with performance and stability as its primary objectives, this indicator provides day traders, scalpers, and swing traders with immediate context regarding market liquidity and volatility periods, without compromising terminal responsiveness.
Engineered for Maximum Performance Heavy graphical indicators are a common cause of terminal lag and backtesting failures. Sessions Duck addresses this by utilising advanced, lightweight MQL5 object management techniques. By avoiding resource-heavy rendering methods and implementing smart, automated historical object cleanup, the indicator maintains an ultra-low CPU and memory footprint. It is explicitly designed to ensure seamless operation during live trading and high-speed strategy testing.
Core Functionality & Features:
-
Customisable Session Mapping: Accurately visualises the Asian, London, and New York trading windows. Users can easily customise the start and end times to match their broker's specific server offset.
-
Dual Display Modes:
-
High/Low Box Mode: Dynamically draws rectangles encapsulating the exact high and low price range established during the specified session hours.
-
Background Column Mode: Renders clean, instrument-safe vertical background bands for quick visual reference of active market hours.
-
-
Integrated Timezone Panel: An efficient, event-driven on-chart display that provides real-time tracking of:
-
Server Time (Market Time)
-
Local Time (User's Computer Time)
-
GMT Time (Coordinated Universal Time)
-
Calculated Server GMT Offset
-
-
Advanced Rollover Logic: Seamlessly and accurately handles session times that cross the midnight server threshold, preventing visual overlapping and data errors.
-
Complete Customisation: Full control over session hours, specific colour coding for each market, and the number of historical days (lookback period) rendered on the chart.
-
Clean Chart Interface: Designed to be non-obtrusive, providing essential data without cluttering price action analysis.