MT5 Higher TimeFrame indicator

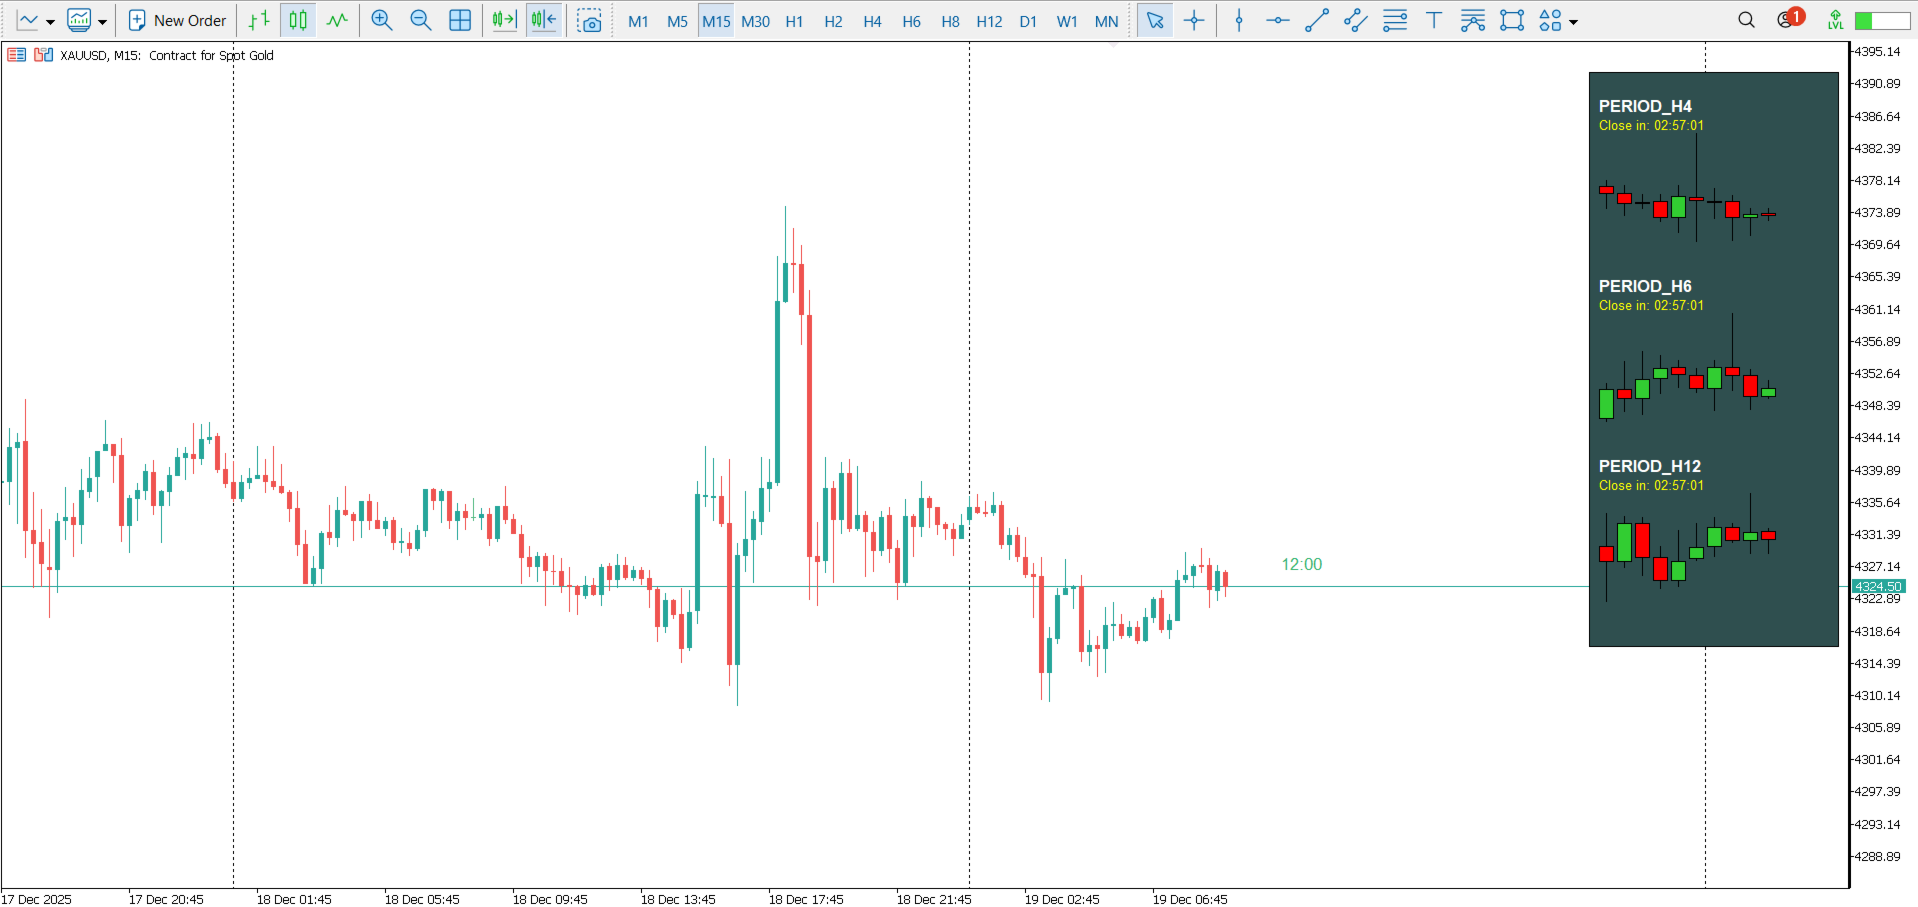
The Higher timeframe candle tracker is used to get a glimpse of what the selected higher time frame candle is like.

It plot the candle after the current price.

It can come in handy for day traders and short term traders that often worry about how the current higher timeframe candle may look like.

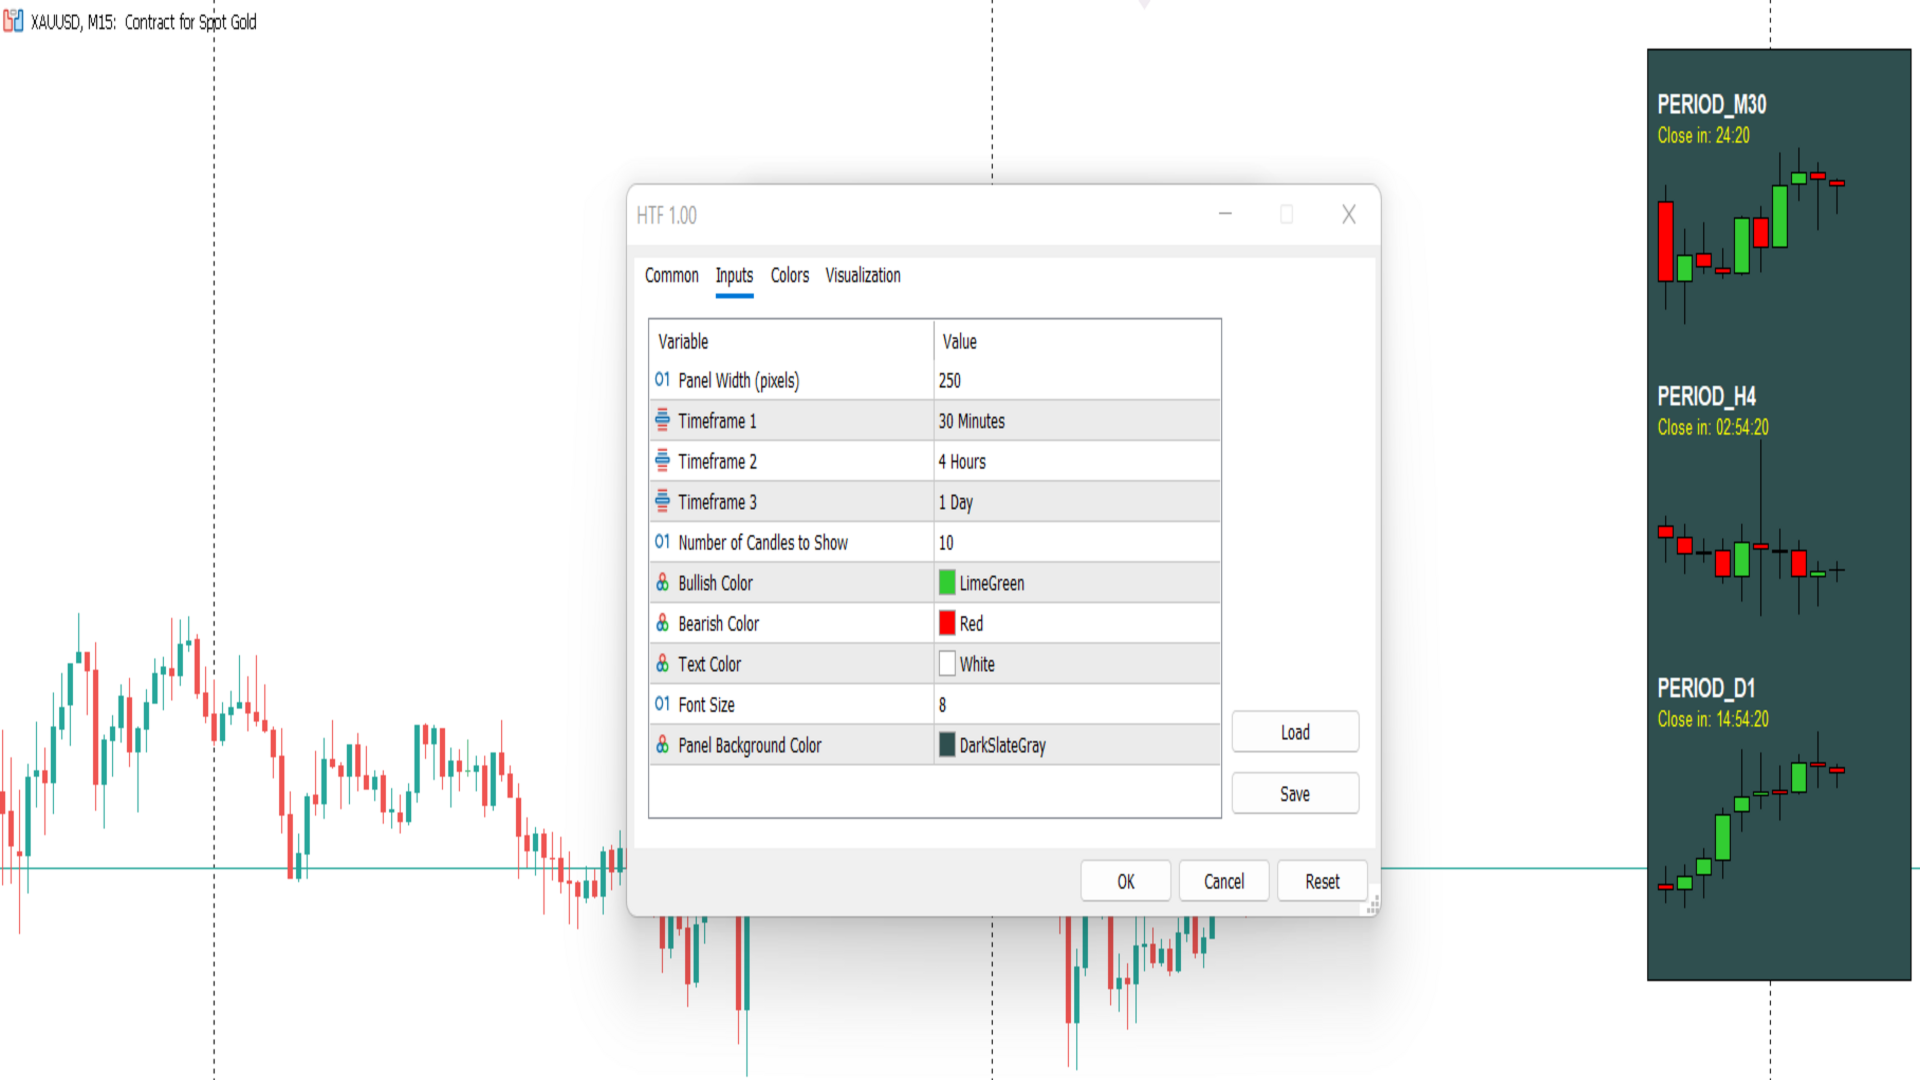
You can select the higher time frame or lower time frame from the options provided:

By default the color for bears is red and for bulls is green.

おすすめのプロダクト
HiLo Activator is one of the most used indicators to determine trend. Find it here with the ability to customize period and colors. This indicator also plots up and down arrows when there is a change on the trend, indicating very strong entry and exit points. HiLo fits well to different types of periods for day trading. You can easily understand when it is time to buy or sell. It works pretty good also for other periods like daily and monthly signalizing long-term trends. The use of the indicato
DoctorEdge V-LINE (Pump it & Dump it) Strategy Pro Confirms trend direction using smart momentum logic and key price behavior How It Works DoctorEdge V-LINE is a smart visual indicator designed to detect trend impulses and confirm their strength based on how price reacts around certain dynamic zones. Buy Trend: When price reaches level -20 , the line turns green , signaling a potential buy . If price breaks above level 0 and the line stays green, the uptrend is confirmed . If price doe
This indicator builds upon the previously posted Nadaraya-Watson smoothers. Here we have created an envelope indicator based on Kernel Smoothing with integrated alerts from crosses between the price and envelope extremities. Unlike the Nadaraya-Watson estimator, this indicator follows a contrarian methodology. Please note that by default this indicator can be subject to repainting. Users can use a non-repainting smoothing method available from the settings. The triangle labels are designed so
Trendline Targets Dashboard MT5 Trendline Targets Dashboard MT5 は、MetaTrader 5 用のインジケーターで、完全なビジュアル・トレードプランを表示します。 シグナル 、 エントリー価格(Entry) 、 ストップロス(Stop Loss) 、および 利確目標(Take Profits) を、リスク比率 R に基づいて自動的に計算します。 このツールは注文を出すものではありません。トレードの分析と視覚的管理を目的としたツールであり、自動売買ロボット(EA)ではありません。 リリース記念特典: 購入者全員に、私の MQL5 プロフィールにあるお好きな インジケーターを1つ無料でプレゼント します。 ※ 注意: Market Structure Order Block Dashboard MT5 は特典対象外です。 特典を受け取るには、購入後に MQL5 メッセージ機能でご希望の製品名をお送りください。 主な機能 ネオンエフェクト付きトレンドライン(強気/弱気) ローソク足確定時のトレンド反転による BUY/SELL
Title: Volatility Expansion POI PRO Escape the Chop. Trade Institutional Expansion with Dawe Trading! The biggest enemy of any retail trader is "The Chop"—those low-volatility, sideways periods where standard indicators generate endless false signals.   Volatility Expansion POI PRO , engineered by   Dawe Trading , was developed with a single mission: to identify market compression in real-time and keep you on the sidelines until a high-probability institutional expansion occurs. The   Dawe Trad
ZigZag_3LZZ — 3レベルのジグザグインジケーター ZigZag_3LZZインジケーターは、金融市場のテクニカル分析のために設計されています。チャート上に異なる期間(5、13、34)を持つ3本の色分けされたジグザグラインを表示し、トレーダーに以下の機能を提供します:     重要な価格反転レベルの視覚的な識別     重要でない価格変動と市場ノイズのフィルタリング     最新の極値に基づくトレンドラインの描画     フィボナッチレベルの自動計算(0.24、0.382、0.5、0.618、0.76)     現在のサポートレベルとレジスタンスレベルの特定     新しい極値出現時の即時反転シグナルの取得     単一チャートでの3つの時間軸の視覚的比较      適用場面      このインジケーターは様々な取引戦略で使用されます:     トレンド取引 — 3本の異なる方向のジグザグラインによるトレンド方向の判断     水平線取引 — サポート/レジスタンスレベルからの市場参入     反転点の探索 — 新たな極値形成時のシグナル    
A clean, non-repainting indicator that projects swing high & low levels forward — with automatic broken-level detection and full visual control. The indicator detects relevant price swings using a ZigZag-like logic and projects these levels forward as horizontal rays. Active (unbroken) levels are displayed as solid lines, while broken levels are automatically shown as dashed lines using the same color , keeping the structure clear and visually consistent. The indicator focuses purely on market s
The Fractals indicator displays on the chart only fractals with the specified parameters in the indicator settings. This allows you to more accurately record a trend reversal, excluding false reversals. According to the classical definition of a fractal, it is a candlestick - an extremum on the chart, which was not crossed by the price of 2 candles before and 2 candles after the appearance of a fractal candle. This indicator provides the ability to adjust the number of candles before and after t
Crypto_Forex MT5用インジケーター「ダイナミック売られ過ぎ/買われ過ぎゾーン付きCCI」(リペイント機能なし) - コモディティ・チャネル・インデックス(CCI)は、トレンド方向へのモメンタムトレードに最適です。 - ダイナミック買われ過ぎゾーンからの売りエントリー、およびダイナミック売られ過ぎゾーンからの買いエントリーを、主要トレンド方向へ行うのに最適です。 - このインジケーターは、プライスアクションエントリーと組み合わせるのも効果的です。 - ダイナミック買われ過ぎゾーン - 黄色線より上。 - ダイナミック売られ過ぎゾーン - 青線より下。 - CCIオシレーターは、現在価格と過去平均価格の差を測定します。 - PCおよびモバイルアラート機能付き。 高品質のトレーディングロボットとインジケーターをご覧になるにはここをクリックしてください! これは、このMQL5ウェブサイトでのみ提供されるオリジナル製品です。
FiveStarFX Gold Reversal Edge Professional automated trading solution designed for structured execution and controlled risk management in the Gold market. Built for traders who value discipline, precision, and consistency. Key Features Fully automated trading One trade at a time (controlled exposure) Fixed Stop Loss and Take Profit Smart Break-Even protection Profit lock with buffer Step-based trailing management Spread protection system Works on any broker Trade Management The E
FREE
VIP Buy Sell Signals
Hapu Arachchilage Tharindu Lakmal
Contact me through this email aaddress to download the FREE strategy PDF for this indicator tharindu999lakmal@gmail.com Introduction   The   "Buy Sell Signals"   is designed to provide BUY and SELL trade signals based on the current market conditions.   A   Trading Strategy   (Chee sheet)  has been  provided for this trading indicator.   (Read the description). This indicator has time tuned e ntry signals . so,   you will enter the market at the very best price level   with this indicator .  
The indicator detects divergence signals - the divergences between the price peaks and the MACD oscillator values. The signals are displayed as arrows in the additional window and are maintained by the messages in a pop-up window, e-mails and push-notifications. The conditions which formed the signal are displayed by lines on the chart and in the indicator window. The indicator parameters MacdFast - fast MACD line period MacdSlow - slow MACD line period MacdSignal - MACD signal line period Macd
Divergent Stochastic Filter II Catch Reversals Early, Filter Noise, Trade with Confidence The Edge: Why This Stochastic is Different  Every trader knows the Stochastic oscillator. But knowing when to trust its signals, that's the real challenge. The Divergent Stochastic Filter II transforms this classic indicator into a precision reversal detection system by adding critical elements: divergence intelligence, signal filtering and exhaustion detection.  While standard Stochastic oscillators fire s
PR EA - Engulfing Pattern Trading System Automated Engulfing Pattern Detection with MA Confirmation The PR EA is a Meta Trader 5 expert advisor that identifies and trades bullish/bearish engulfing candlestick patterns when confirmed by a moving average filter. Designed for swing trading on 30-minute charts with compatibility for M15 and H1 time frames. Key Features: Pattern Recognition - Detects valid bullish/bearish engulfing candle formations Trend Confirmation - 238-period SMA filter
## EA PHANTOM EDGE – スマートフィボナッチ取引システム **エグゼクティブ概要**   EA PHANTOM EDGEは、高確率市場反転を活用するためのプロフェッショナルグレードの自動取引システムで、フィボナッチリトレースメント分析とプライスアクション確認を組み合わせています。このシステムは信頼性、透明性、MQL5マーケット完全準拠を重視し、先進的なリスク管理、智能取引検証、多チャネルアラートを統合して、一貫性のある制御された取引パフォーマンスを提供します。   このエキスパートアドバイザーは、自動化を求める裁量トレーダーと、堅牢な市場対応ソリューションを求める投資家双方に適しています。 ## コア機能 **スマート取引ロジック**   **自動フィボナッチ分析**   スイングハイとスイングローを動的に検出し、主要フィボナッチリトレースメントレベルを計算:23.6%、38.2%、50.0%、61.8%、78.6%。 **プライスアクション確認**   証明されたパターンによる確認後でのみ取引実行:   - 強気・弱気エンガルフィング   - 強力モメンタ
FREE
トレンドに乗りましょう。はい、買いでも売りでも、15分枠でエントリーシグナルを待ち、30分枠でシグナルが現れたらシグナルを確認します(シグナルが現れるまでに1時間以上かかる場合もあります。戻ることができます) 15分足に戻り、30分足に戻り、メインシグナルが現れるまでこれを繰り返し、30分足にシグナルが出たら価格でエントリーし、描画ラインが変化した時点で利益確定となります。 、利益が確定したとき、または反対のシグナルが現れたとき これは非常にシンプルで、すべての主要通貨で機能します。  メタル、インジケーター、すべてのフレームですが、最も良い結果は 30 分フレームです。 ストップロスは常にローソク足の底値よりも下に設定し、資本管理を超えてはなりません 資本金の10%
Imperator Expert Advisor is your reliable assistant in making profitable trading decisions. Our algorithm and professional analysis will help you maximize your profits. With our experience, we will help you achieve your trading goals. Our expert advisor is based on comprehensive market analysis and advanced trading strategies. We offer various settings to customize your trading. The advisor monitors the markets, identifies opportunities and executes trades in real time. Backtests and risk manage
Triple Moving Average Buy Sell Alerts このインジケーターは、3本の移動平均線システムを使用してトレンドフォローの売買タイミングを特定します。シグナルは確定済みローソク足で生成され、デスクトップのポップアップ通知とスマートフォンへのプッシュ通知で配信されます。 トレーディングロジック 買いシグナル(緑のダイヤモンド)は、以下のすべての条件が同時に満たされたときに表示されます。価格が3本の移動平均線すべての上で確定し、MA 20がMA 50の上にあり、MA 50がMA 200の上にあり、価格がMA 200の上にある場合です。 売りシグナル(赤のダイヤモンド)は、すべての逆の条件が満たされたときに表示されます。価格が3本の移動平均線すべての下で確定し、完全なベアリッシュアライメントが形成された場合です。 決済シグナル(金色のX)は、高速MA 20が中速MA 50をクロスしたときに表示されます。価格の下にある金色のXは買いポジションを決済し、価格の上にある金色のXは売りポジションを決済します。 インジケーターはマーケットの状態を追跡し、前のトレードが決済シ
FREE
Ultra AS MT5
Yaroslav Varankin
3 (2)
The indicator is designed for binary options trading. The "period" parameter can be adjusted to fit your trading strategy, allowing you to customize the number and quality of signals. A red arrow pointing down indicates a sell signal, while a blue arrow pointing up indicates a buy signal. Recommended expiration time is one candle. You can enter a trade either when the signal appears or on the next candle. Attention: the signal may sometimes disappear on the current candle, so it's important to
First time on MetaTrader, introducing IQ Star Lines - an original Vedic Astrology based indicator. "Millionaires don't use astrology, billionaires do" . - J.P. Morgan, Legendary American financier and banker. IQ Star Lines, an unique astrological indicator purely based on   Vedic astrology   calculations, published for the   first time on Metatrader.  This unique tool plots dynamic planetary grid lines based on real-time stars, constellations, and celestial movements, which allows you to plot t
Fractal Zones Decision
Pablo Filipe Soares De Almeida
FRACTAL ZONES DECISION – フラクタルを実際の判断ゾーンに変換するインジケーター 1本のローソク足が同時に上昇フラクタルと下降フラクタルを形成するダブルフラクタルを識別し、市場の本当の迷いゾーンを作成します。これらのゾーンは従来のフラクタルよりもはるかに強い、機関投資家レベルのサポートとレジスタンスとして機能します。 インジケーターの機能: 矢印付きでクラシックフラクタルを描画(オフ可能) 迷いゾーンを強調する特別な点線を描画(現在の時間足ごとに色分け) MT5のすべての時間足を同時に監視(M1からMN1まで、最大21追加TF) 各ゾーンのブレイクアウトラインを自動描画 価格がダブルフラクタルゾーンを突破するたびに音声アラートとスマホへのPush通知を送信(時間足ごとに個別設定可能) つまり、市場が本当に迷っている場所を明確に確認でき、その迷いが破られた瞬間に通知を受け取れます。 最適な対象: 正確なエントリーを求めるスキャルパー 強いサポート・レジスタンスを探すデイトレーダー 価格トラップを避けたいスイングトレーダー 本当のコンフルエンスで取引したいすべての
N/B: All our product purchase comes with our free ‘’DAILY   SCALPER EA’’ -   bit.ly/4qlFLNh Whatsapp Developer for yours after successful purchase HolyGrail Premium System: The Ultimate Supply & Demand Trading Solution   Finally Discover the "Unfair Advantage" That Professional Traders Have Been Using For Years "I went from inconsistent guessing to precision trading with 83% accuracy once I started combining multi-timeframe confirmation with institutional order flow zones" Note: After pur
HiLo Activator v1.02 by xCalper The HiLo Activator is similar to moving average of previous highs and lows. It is a trend-following indicator used to display market’s direction of movement. The indicator is responsible for entry signals and also helps determine stop-loss levels. The HiLo Activator was first introduced by Robert Krausz in the Feb. 1998 issue of Stocks & Commodities Magazine.
Smart Money Structure & Precision Trading Indicator (MT5) Smart Money Structure & Precision Trading Indicator  is a powerful Smart Money Concepts (SMC) indicator for MetaTrader 5, designed to help traders identify high-probability entries with institutional logic . This indicator automatically detects market structure in real time , highlights key liquidity levels , and provides clear, non-repainting signals so you can trade with confidence and precision. Whether you are a scalper, day trader, o
O indicador duplo estocástico RSI Forex é uma modificação do oscilador estocástico para a plataforma MetaTrader 5. INFORMAÇÕES SOBRE O INDICADOR O indicador Forex estocástico duplo implementa um estocástico duplo aplicado ao RSI, usando níveis flutuantes em vez de fixos para avaliar sobrevenda e sobrecompra. Nos casos em que o período RSI é <=1, obtém-se apenas um estocástico duplo. Você pode usar suavização adicional dos resultados (a EMA integrada é usada para isso). O conjunto habitual d
Hush mt5
Iurii Plokhov
4.33 (3)
Hush mt5 is an advanced indicator that gives a signal about the overbought or oversold market in a certain period of time Hush mt5 the advantage of this indicator is that it does not disappear after the signal on the chart Suitable for any trade: forex, stocks, cryptocurrency, metals Hush mt5 can be used on any time period. The signal goes to the beginning of the next candle after the arrow Hush mt5 performed best on the period H1,H4,daily It can be used in addition to forex, in binary opt
This indicator is based on a mathematical formula which gives you the possibility to seek and find the right frequency of the movement, and to determine its key level; just adjust the frequency parameter! Simple and highly effective; using this indicator you can easily predict the next support and  resistance    levels of the day. Also, this indicator determines the range and the next two importants levels of the movement outside this range so far. SGFL3 and RGFL3  are levels with high certainty
Continuous Coloured dot lines under and above price when conditions are met. Arrows Red and Green for entry Points.  User can change the colours of the arrows in the colour section of the indicator.  It is consider a great scalping tool on lower time-frames, while higher time frames will have fewer opportunities but trades will possibly last longer.  There is an input for Alert on or off.  This can be used effectively on M15/M30 Chart until up to H4 chart time.  It is best if the user has some
KasTon Trend System: The Complete 2-in-1 Trading Strategy Identify the Trend, Confirm the Signal, and Trade with Confidence! Do you suffer from confusion while trading? Do you find it difficult to determine the market's direction? Are you tired of losing money on false signals? The KasTon Trend System is here as an integrated solution to all these problems. This is not just an indicator; it is a complete trading strategy built on the synergy of two powerful, custom-built indicators. Our main g
Description CAP Channel & Hull Moving Average Crossing Strategy is a powerful and smart trading indicator designed to identify high-probability market reversals and trend-based entry points . This indicator combines the strength of the CAP Channel and the Hull Moving Average (HMA) to detect price overextension and confirmation-based reversals . When price moves outside the CAP Channel and then returns inside with Hull MA confirmation, the indicator generates accurate BUY and SELL signals . Core
このプロダクトを購入した人は以下も購入しています
Azimuth Pro
Ottaviano De Cicco
5 (6)
Azimuth Pro V2:MT5向けシンセティック・フラクタル構造分析と確認済みエントリー 概要 Azimuth Pro は Merkava Labs によるマルチレベルスイング構造インジケーターです。4つのネストされたスイングレイヤー、スイングアンカーVWAP、ABCパターン検出、3タイムフレーム構造フィルタリング、そして確定バーでの確認済みエントリー — 1つのチャートで、ミクロスイングからマクロサイクルまでを網羅するワークフロー。 これはブラインドシグナル製品ではありません。ロケーション、コンテキスト、タイミングを重視するトレーダーのための構造ファーストワークフローです。 V2発売記念オファー — Azimuth Pro V2をUSD 399で(次の100本)。最終価格:USD 499。 1. V2での変更点 シンセティック・マルチタイムフレームエンジン 上位タイムフレーム分析をMeridian Proと同じ独自のシンセティックアーキテクチャで一から再構築。よりクリーンなHTFコンテキスト、安定したライブ動作、従来のMTF同期問題なし。シンセティックエンジンは 固定比率タ
このインジケーターを購入された方には、以下の特典を 無料 で提供しています: 各トレードを自動で管理し、ストップロスとテイクプロフィットを設定し、戦略ルールに基づいてポジションを決済する補助ツール 「Bomber Utility」 様々な銘柄に合わせたインジケーターの設定ファイル(セットファイル) 「最小リスク」、「バランスリスク」、「待機戦略」 の3つのモードで使用できる Bomber Utility 用の設定ファイル このトレーディング戦略をすぐに導入・設定・開始できる ステップバイステップのビデオマニュアル ご注意: 上記の特典を受け取るには、MQL5のプライベートメッセージシステムを通じて販売者にご連絡ください。 オリジナルのカスタムインジケーター 「Divergence Bomber(ダイバージェンス・ボンバー)」 をご紹介します。これは、MACDのダイバージェンス(乖離)戦略に基づいた 「オールインワン」型のトレーディングシステム です。 このテクニカルインジケーターの主な目的は、価格とMACDインジケーターの間に発生するダイバージェンスを検出 し、将来の価格の動きを示す
Quantum TrendPulse を ご紹介します。これは、   SuperTrend   、   RSI   、および Stochastic のパワーを 1 つの包括的なインジケーターに組み合わせて、取引の可能性を最大限に引き出す究極の取引ツールです。精度と効率を求めるトレーダー向けに設計されたこのインジケーターは、市場のトレンド、勢いの変化、最適なエントリー ポイントとエグジット ポイントを自信を持って特定するのに役立ちます。 主な特徴: SuperTrend 統合: 現在の市場動向に簡単に追従し、収益性の波に乗ることができます。 RSI精度: 買われすぎと売られすぎのレベルを検出し、市場の反転のタイミングに最適で、SuperTrendのフィルターとして使用されます。 確率的精度: 確率的振動を活用して、変動の激しい市場で隠れたチャンスを見つけます。SuperTrend のフィルターとして使用されます。 マルチタイムフレーム分析:   M5 から H1 または H4 まで、さまざまなタイムフレームで市場を常に把握します。 カスタマイズ可能なアラート: カスタム取引条件が満たされ
BTMM State Engine Pro is a MetaTrader 5 indicator for traders who use the Beat The Market Maker approach: Asian session context, kill zone timing, level progression, peak formation detection, and a multi-pair scanner from a single chart. It combines cycle state logic with a built-in scanner dashboard so you do not need the same tool on many charts at once. What it does Draws the Asian session range; session times can follow broker server offset or be set in inputs. Tracks level progression (L
OmniSync Projection
Antonio-alin Teculescu
5 (1)
Chronos Fractal Engine is an innovative price projection indicator for MetaTrader 5, designed to transform your technical analysis by intelligently identifying and projecting historical price patterns. Built upon an advanced correlation algorithm and the fractal principles of the market, this powerful tool visualizes potential future price movements, giving you a unique edge in your trading decisions. What is Chronos Fractal Engine? At its core, the Chronos Fractal Engine employs a sophisticat
ARICoin is a powerful trading companion designed to generate high-probability entry signals with dynamic TP/SL/DP levels based on volatility. Built-in performance tracking shows win/loss stats, PP1/PP2 hits, and success rates all updated live. Key Features: Buy/Sell signals with adaptive volatility bands Real-time TP/SL/DP levels based on ATR Built-in MA Filter with optional ATR/StdDev volatility Performance stats panel (Success, Profit/Loss, PP1/PP2) Alerts via popup, sound, push, or email Cust
まず第一に、この取引ツールはノンリペイント、ノンリドロー、ノンラグの指標であり、プロの取引に理想的ですことを強調する価値があります。 オンラインコース、ユーザーマニュアル、デモ。 スマートプライスアクションコンセプトインジケーターは、新米から経験豊富なトレーダーまで、非常 に強力なツールです。Inner Circle Trader AnalysisやSmart Money Concepts Trading Strategiesなど、20以上の有用な指標を1つに組み合わせています。このインジケーターはスマートマネーコンセプトに焦点を当て、大手機関の取引方法を提供し、彼らの動きを予測するのに役立ちます。 特に、流動性分析に優れており、機関がどのように取引しているかを理解しやすくしています。市場のトレンドを予測し、価格の動きを慎重に分析するのに優れています。機関の戦略とトレードを合わせることで、市場の動向についてより正確な予測ができます。このインジケーターは多目的であり、市場構造を分析し、重要な注文ブロックを特定し、さまざまなパターンを認識するのに優れています。 このインジケーター
Bill Williams Advanced is designed for automatic chart analysis using Bill Williams' "Profitunity" system. The indicator analyzes four timeframes at once. Manual (Be sure to read before purchasing) Advantages 1. Analyzes the chart using Bill Williams' "Profitunity" system. Signals are displayed in a table in the corner of the screen and on the price chart. 2. Finds all known AO and AC signals, as well as zone signals. Equipped with a trend filter based on the Alligator. 3. Finds "Divergence Bar
RelicusRoad Pro: 定量的市場オペレーティングシステム 【期間限定】無制限アクセス 70% OFF - 2,000人超のトレーダーと共に なぜ多くのトレーダーは「完璧な」インジケーターを使っても失敗するのでしょうか? それは、文脈を無視して 単一の概念 だけでトレードしているからです。文脈のないシグナルは単なるギャンブルです。勝ち続けるには、 根拠の重なり(コンフルエンス) が必要です。 RelicusRoad Proは単なる矢印インジケーターではありません。完全な 定量的市場エコシステム です。独自のボラティリティモデリングを用いて、価格が推移する「適正価値の道(Fair Value Road)」をマッピングし、ノイズと真の構造的ブレイクを判別します。 推測はやめましょう。機関投資家レベルの「ロード・ロジック」でトレードを。 コアエンジン:「Road」アルゴリズム システムの中心となる Road Algo は、市場環境にリアルタイムで適応するダイナミックなボラティリティチャネルです。 安全ライン(平衡点) と、価格が数学的に反転しやすい 拡張レベル を投影します。 Si
Berma Bands
Muhammad Elbermawi
5 (8)
Berma Bands (BBs) インジケーターは、市場のトレンドを特定して活用したいトレーダーにとって貴重なツールです。価格と BBs の関係を分析することで、トレーダーは市場がトレンド段階にあるか、レンジ段階にあるかを判断できます。 詳細については、[ Berma Home Blog ] をご覧ください。 バーマ バンドは、上部バーマ バンド、中部バーマ バンド、下部バーマ バンドの 3 つの異なる線で構成されています。これらの線は価格の周りにプロットされ、全体的な傾向に対する価格の動きを視覚的に表します。これらのバンド間の距離から、ボラティリティや潜在的な傾向の反転についての洞察を得ることができます。 バーマ バンドの線がそれぞれ離れると、市場が横ばいまたはレンジ相場の期間に入っていることを示すことがよくあります。これは、明確な方向性の偏りがないことを示しています。トレーダーは、これらの期間中にトレンドを特定するのが難しいと感じる可能性があり、より明確なトレンドが出現するまで待つ場合があります。 バーマ バンドの線が 1 本の線に収束すると、強いトレンド環境の兆候となること
ARIPoint is a powerful trading companion designed to generate high-probability entry signals with dynamic TP/SL/DP levels based on volatility. Built-in performance tracking shows win/loss stats, PP1/PP2 hits, and success rates all updated live. Key Features: Buy/Sell signals with adaptive volatility bands Real-time TP/SL/DP levels based on ATR Built-in MA Filter with optional ATR/StdDev volatility Performance stats panel (Success, Profit/Loss, PP1/PP2) Alerts via popup, sound, push, or email Cu
現在33%オフ 初心者にもエキスパートトレーダーにも最適なソリューション このインジケーターは独自の機能と新しい公式を多数内蔵しており、ユニークで高品質かつ手頃な取引ツールです。このアップデートでは、2つの時間枠ゾーンを表示できるようになります。より長いTFだけでなく、チャートTFとより長いTF(ネストゾーンを表示)の両方を表示できます。すべてのSupply Demandトレーダーの皆さんのお気に召すはずです。:) 重要情報の公開 Advanced Supply Demandの可能性を最大化するには、 https://www.mql5.com/ja/blogs/post/720245 にアクセスしてください。   エントリーまたはターゲットの正確なトリガーポイントを正確に特定できれば取引がどのように改善されるか想像してみてください。新しい基盤となるアルゴリズムに基づいて構築されているため、買い手と売り手の間の潜在的な不均衡をさらに簡単に特定できます。これは、最も強い需要と供給のゾーンと、過去のパフォーマンス(古いゾーンを表示)がグラフィカルに表現されるためです。これらの機能は、最適な
ICT PO3 (Power of 3) AMD Protocol Framework Indicator True Time & Structure Integration   |  Non-Repainting | Real-Time  | Multi-Asset  | MT4 Version Available Full Setup Guide & Strategy Playbook: https://www.mql5.com/en/blogs/post/768683 MT4 Version: https://www.mql5.com/en/market/product/171742 Indicator Overview The ICT PO3 AMD Protocol Framework is a complete structural overlay for MetaTrader 5 that maps the True Daily Cycle directly onto your lower-timeframe execution chart. It projects
トレンドトレーディング は、タイミングのプルバックとブレイクアウトにより、市場で起こっているトレンドから可能な限り利益を得るように設計された指標です。確立されたトレンドの中で価格が何をしているかを分析することにより、取引の機会を見つけます。 [ インストールガイド | 更新ガイド | トラブルシューティング | よくある質問 | すべての製品 ] 自信を持って効率的に金融市場を取引する むち打ちにならずに確立されたトレンドから利益を得る 収益性の高いプルバック、ブレイクアウト、早期の逆転を認識する この指標は、独自の品質とパフォーマンスを分析します 複数時間枠のダッシュボードを実装します インジケーターは再描画されていません 電子メール/音声/視覚アラートを実装します 確立されたトレンドは多くの取引機会を提供しますが、ほとんどのトレンド指標はそれらを完全に無視しています。インジケーターの解釈はかなり簡単です: (1) トレンドの変化 (2) トレンドの方向への後退 (3) トレンドの方向へのブレイクアウト 赤いダッシュ は下降トレンド中の修正です 青いダッシュ は上昇トレンド中
Introducing Indicator for PainX and GainX Indices Traders on Weltrade Get ready to experience the power of trading with our indicator, specifically designed for Weltrade   broker's PainX and GainX Indices.  Advanced Strategies for Unbeatable Insights Our indicator employs sophisticated strategies to analyze market trends, pinpointing optimal entry and exit points.  Optimized for Maximum Performance To ensure optimal results, our indicator is carefully calibrated for 5-minute timeframe charts on
TPA True Price Action indicator reveals the true price action of the market makers through 100% non-repainting signals strictly at the close of a candle! TPA shows entries and re-entries, every time the bulls are definitely stronger than the bears and vice versa. Not to confuse with red/green candles. The shift of power gets confirmed at the earliest stage and is ONE exit strategy of several. There are available now two free parts of the TPA User Guide for our customers. The first "The Basics"
Easy SMC Trading
Israr Hussain Shah
3 (2)
自動RR&BOSスキャナー搭載ストラクチャートレンド バージョン: 1.0 概要 自動RRスキャナー搭載ストラクチャートレンドは、プライスアクションとマーケットストラクチャーを重視するトレーダー向けに設計された包括的なトレーディングシステムです。平滑化されたトレンドフィルターとスイングポイント検出、そしてストラクチャーブレイク(BOS)シグナルを組み合わせ、高確率のトレードセットアップを生成します。 このツールの最大の特徴は、自動リスク管理です。有効なストラクチャーブレイクを検出すると、インジケーターはリスク/リワードゾーン(1:1、1:2、1:3)を瞬時に計算・描画し、価格が目標値に到達すると自動的にトレードの視覚化を管理します。これにより、手動で描画ツールを使用する必要がなくなり、トレーダーは執行のみに集中できます。 主な機能 ダイナミック・ストラクチャーブレイク(BOS)検出 スイングハイ(HH/LH)とスイングロー(HL/LL)を自動的に識別します。 価格が主要なストラクチャーレベルをブレイクすると、チャート上にBOSラインを直接描画し、トレンドの方向を確認します。
AriX
Temirlan Kdyrkhan
1 (4)
AriX Indicator for MT5 A powerful trend-following and signal-evaluation tool AriX is a custom MT5 indicator that combines Moving Averages and ATR-based risk/reward logic to generate clear buy/sell signals. It visualizes dynamic SL/TP levels, evaluates past trade outcomes, and displays win/loss statistics in a clean on-chart panel. Key features include: Buy/Sell signals based on MA crossovers ATR-based SL/TP1/TP2/TP3 levels with visual lines and labels Signal outcome tracking with real-time stat
マーケットメーカーのためのツール。 Meravith は次の機能を提供します: すべての時間足を分析し、現在有効なトレンドを表示します。 強気と弱気の出来高が等しくなる流動性ゾーン(出来高均衡)を強調表示します。 異なる時間足のすべての流動性レベルをチャート上に直接表示します。 テキスト形式の市場分析を生成し、参考情報として表示します。 現在のトレンドに基づいて目標値、サポートレベル、ストップロスを計算します。 取引のリスクリワード比を算出します。 口座残高に基づいてポジションサイズを計算し、潜在的な利益を推定します。 また、市場に大きな変化があった場合には警告を表示します。 インジケーターの主要ライン: 強気/弱気の出来高エグゾーストライン ― 目標値として機能します。 市場のトレンドを示すライン。市場が強気か弱気かによって色が変わり、トレンドのサポートとして機能します。主にその色が市場センチメントを示します。 出来高均衡ライン(Eq)。Eq(Volume Equilibrium)ラインはシステムの中核です。これは買い手と売り手の出来高のバランスポイントを表します。市場の流動性を示し
優れたテクニカルインジケーター「Grabber」をご紹介します。これは、すぐに使える「オールインワン」トレーディング戦略として機能します。 ひとつのコードに、市場のテクニカル分析ツール、取引シグナル(矢印)、アラート機能、プッシュ通知が強力に統合されています。 このインジケーターを購入された方には、以下の特典を無料で提供します: Grabberユーティリティ:オープンポジションを自動で管理するツール ステップバイステップのビデオマニュアル:インジケーターのインストール、設定、取引方法を解説 カスタムセットファイル:インジケーターをすばやく自動設定し、最大限の成果を出すための設定ファイル 他の戦略はもう忘れてください!Grabberだけが、あなたを新たなトレードの高みへと導いてくれるのです。 Grabber戦略の主な特徴: 推奨タイムフレーム:M5〜H4 対応通貨ペア・資産:どれでも使用可能ですが、私が実際に検証した以下を推奨します(GBPUSD、GBPCAD、GBPCHF、AUDCAD、AUDUSD、AUDSGD、AUDCHF、NZDUSD、NZDCAD、EURCAD、EURUSD、E
12% OFF EASTER SALE The Trend Forecaster indicator utilizes a unique proprietary algorithm to determine entry points for a breakout trading strategy. The indicator identifies price clusters, analyzes price movement near levels, and provides a signal when the price breaks through a level. The Trend Forecaster indicator is suitable for all financial assets, including currencies (Forex), metals, stocks, indices, and cryptocurrencies. You can also adjust the indicator to work on any time frames, alt
FX Analysis is an all-in-one MT5 indicator dashboard that combines eight analytical tools in a single panel, helping traders identify high-probability setups without switching between charts or indicators. Designed for standard forex pairs on MetaTrader 5. Best results on M15 - H4 timeframes when all components are used together as part of the included workflow. Components Volatility Analyzer Displays historical average movement by hour and by day of the week. A real-time Pip Balance shows the
ご紹介     Quantum Breakout PRO は 、ブレイクアウト ゾーンの取引方法を変革する画期的な MQL5 インジケーターです。 13年以上の取引経験を持つ経験豊富なトレーダーのチームによって開発されました。     クォンタム ブレイクアウト プロ   は、革新的でダイナミックなブレイクアウト ゾーン戦略により、あなたのトレーディングの旅を新たな高みに押し上げるように設計されています。 クォンタム ブレイクアウト インジケーターは、5 つの利益ターゲット ゾーンを備えたブレイクアウト ゾーン上のシグナル矢印と、ブレイクアウト ボックスに基づいたストップロスの提案を提供します。 初心者トレーダーにもプロのトレーダーにも適しています。 量子EAチャネル:       ここをクリック 重要!購入後、インストールマニュアルを受け取るためにプライベートメッセージを送ってください。 推奨事項: 時間枠: M15 通貨ペア: GBPJPY、EURJPY、USDJPY、NZDUSD、XAUUSD アカウントの種類: ECN、Raw、またはスプレッドが非常に低い R
Gartley Hunter Multi - An indicator for searching for harmonic patterns simultaneously on dozens of trading instruments and on all possible timeframes. Manual (Be sure to read before purchasing) | Version for MT4 Advantages 1. Patterns: Gartley, Butterfly, Shark, Crab. Bat, Alternate Bat, Deep Crab, Cypher 2. Simultaneous search for patterns on dozens of trading instruments and on all possible timeframes 3. Search for patterns of all possible sizes. From the smallest to the largest 4. All fou
Shock Pullback
Suleiman Alhawamdah
5 (1)
簡単に言えば、現在のローソク足の横に「ピップス」として知られる白い数字の動きが現れ始めたら、取引を開始できます。白い「ピップス」は、買いまたは売りの取引が現在アクティブであり、白色で示されるように正しい方向に動いていることを示しています。白いピップスの動きが止まり、静的な緑色に変わったとき、それは現在のモメンタムの終了を示します。数字の緑色は、買いまたは売りの取引から得られた「ピップス」での総利益を表します。 さらに、インジケーター内の他の高度でプロフェッショナルな分析ツールに従って取引を開始することも可能です。インジケーターに表示されるシグナルや色を観察することで、高精度で多数のスキャルピングチャンスを捉えることができます。テスト中またはリアルチャート上でインジケーターの動作を理解しておくことをお勧めします。 ほとんどのFX市場に対応:金(ゴールド)や人気の株価指数市場(ダウ・ジョーンズ、S&P500、ナスダック、DAXなど)、およびEUR/USD、GBP/USD、USD/JPYなどの主要通貨ペアでの取引に最適です。また、ビットコイン、イーサリアム、ステーブルコインなどの主要な暗号
これはMT5のインジケーターで、再描画なしで取引に参入するための正確なシグナルを提供します。 外国為替、暗号通貨、金属、株式、インデックスなど、あらゆる金融資産に適用できます。かなり正確な見積もりを提供し、取引を開始して終了するのに最適な時期を教えてくれます。1つのシグナルを処理しただけでインジケーターの元が取れた例の 動画 (6:22)をご覧ください。Entry PointsPro インジケーターの助けを借りたほとんどのトレーダーの最初の1週間の結果が改善しています。 Telegramグループ に登録してください。Entry Points Proインジケーターのメリットは次の通りです。 再描画のないエントリーシグナル 再描画されるインジケーターでは一度表示されたシグナルが削除されて大きな金銭的損失につながることがありますが、これと異なり、表示されて確認されたシグナルは消えることがありません。 エラーなしの取引開始 インジケーターアルゴリズムによって取引を開始する(資産を売買する)理想的な瞬間を見つけることができます。それを使用するすべてのトレーダーの成功率が向上します。 あら
Introduction to X3 Chart Pattern Scanner X3 Cherart Pattern Scanner is the non-repainting and non-lagging indicator detecting X3 chart patterns including Harmonic pattern, Elliott Wave pattern, X3 patterns, and Japanese Candlestick patterns. Historical patterns match with signal patterns. Hence, you can readily develop the solid trading strategy in your chart. More importantly, this superb pattern scanner can detect the optimal pattern of its kind. In addition, you can switch on and off individu
このインジケーターは実践的なトレードに最適な自動波動分析のインジケーターです! 場合... 注:   Tang Lun (Tang Zhong Shuo Zen) の命名規則の影響で、私は波のグレーディングに西洋の名前を使用することに慣れていません。基本的な波を ペン 、二次波のバンドを セグメント と名付けました。同時に、 セグメント にはトレンドの方向が指定されます (この命名方法は将来のノートで使用されます。最初に言っておきます)。ただし、アルゴリズムは曲がりくねった理論とはほとんど関係がないため、付けるべきではありません。これは、私の市場分析 によって要約された、絶えず変化する複雑な運用ルール を反映しています。 バンドは標準化され、人によって異なることがないよう定義されており、市場参入を厳密に分析する上で重要な役割を果たす人為的な干渉の描画方法が排除されています。 このインジケーターを使用することは、取引インターフェイスの美しさを改善することと同等であり、元の K ライン取引を放棄し、取引の新しいレベルに連れて行きます。また、宣伝の観点から顧客の認識も向上します。 イ
発見が困難で頻度が少ないため、分岐は最も信頼できる取引シナリオの1つです。このインジケーターは、お気に入りのオシレーターを使用して、通常の隠れた分岐点を自動的に見つけてスキャンします。 [ インストールガイド | 更新ガイド | トラブルシューティング | よくある質問 | すべての製品 ] 取引が簡単 通常の隠れた発散を見つけます 多くのよく知られている発振器をサポート ブレイクアウトに基づいて取引シグナルを実装します 適切なストップロスおよび利益レベルを表示します 設定可能なオシレーターパラメーター カスタマイズ可能な色とサイズ バー単位でサイズ別に分岐をフィルタリング パフォーマンス統計を実装します 電子メール/音声/視覚アラートを実装します 幅広い市場の見通しを提供するために、異なるオシレーターを使用して、干渉なしで同じチャートにインジケーターを何度もロードできます。このインジケーターは、次のオシレーターをサポートしています。 RSI CCI MACD オスマ 確率的 勢い 素晴らしい発振器 加速器発振器 ウィリアムズパーセントレンジ 相対活力指数 特に外国為替市場では、
このインディケータは、価格アクション分析とドンチャンチャネルのみを使用して、ジグザグ方式で価格の反転を検出します。再描画やバックペインティングを一切行わずに、短期取引向けに特別に設計されています。それは彼らの操作のタイミングを増やすことを目指している賢明なトレーダーにとって素晴らしいツールです。 [ インストールガイド | 更新ガイド | トラブルシューティング | よくある質問 | すべての製品 ] 驚くほど簡単に取引できます すべての時間枠で価値を提供します 自己分析統計を実装します 電子メール/音声/視覚アラートを実装します 可変長のブレイクアウトと混雑ゾーンに基づいて、インディケータは価格アクションのみを使用して取引を選択し、市場が非常に高速に行っていることに反応します。 過去のシグナルの潜在的な利益が表示されます この指標は、独自の品質とパフォーマンスを分析します 負けブレイクアウトは強調表示され、説明されます インジケータは、非バックペインティングおよび非再ペイントです この指標は、日中のトレーダーが単一の価格反転を見逃さないようにするのに役立ちます。ただし、すべての
フィルタ:
レビューなし
レビューに返信