Swing or Scalp Mt5
- インディケータ
- バージョン: 1.0
- アクティベーション: 5

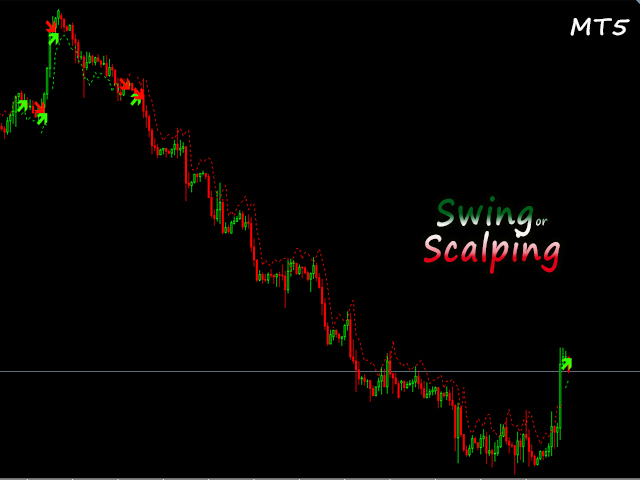
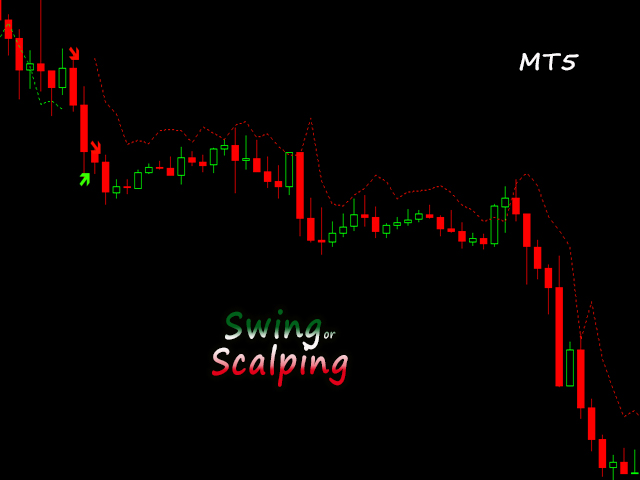
- Continuous Coloured dot lines under and above price when conditions are met.
- Arrows Red and Green for entry Points.
- User can change the colours of the arrows in the colour section of the indicator.
- It is consider a great scalping tool on lower time-frames, while higher time frames will have fewer opportunities but trades will possibly last longer.
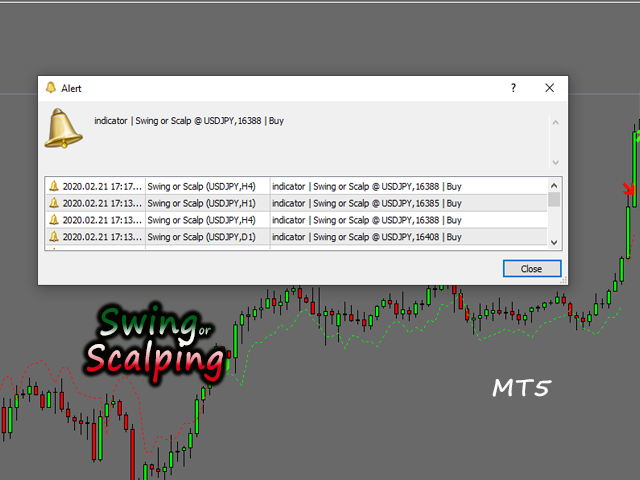
- There is an input for Alert on or off.
- This can be used effectively on M15/M30 Chart until up to H4 chart time.
- It is best if the user has some experience with money management, utilising trailing stop to protect trades otherwise setting order stop-loss and order take profit based on your experience or preferences.
- Finally this tool can be used to filter other signals or alerts being used otherwise.
- Do Trade Well.