RadarPriceActionSmallTF
- インディケータ
- バージョン: 9.0
- アップデート済み: 30 9月 2020
- アクティベーション: 10

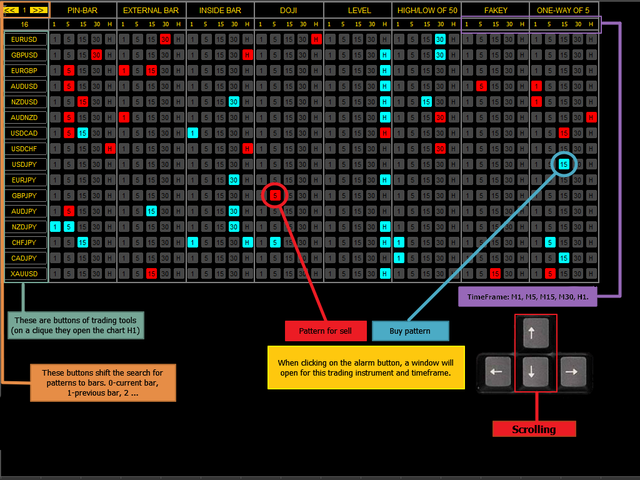
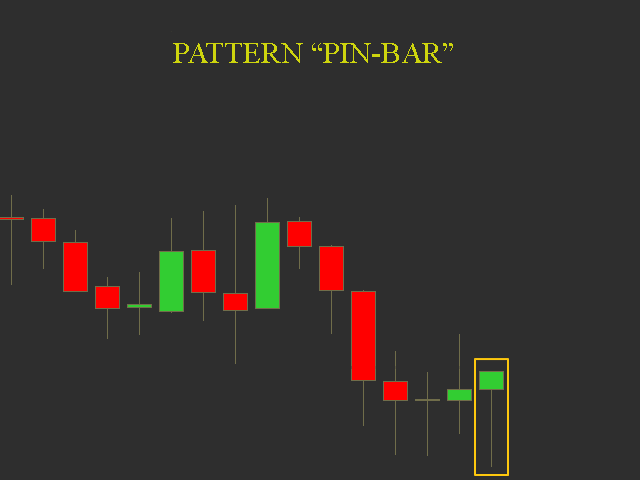
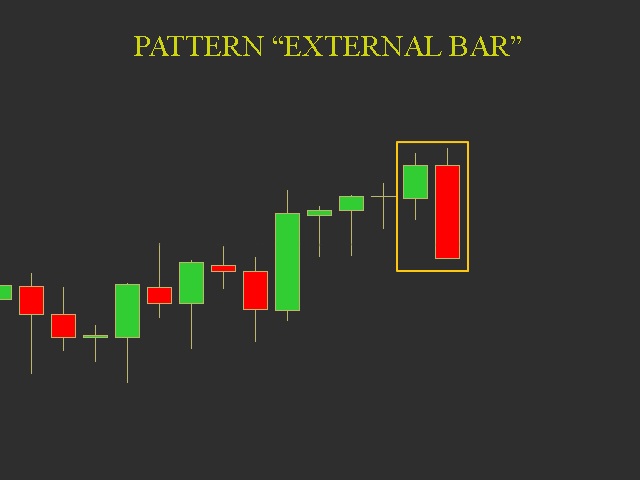
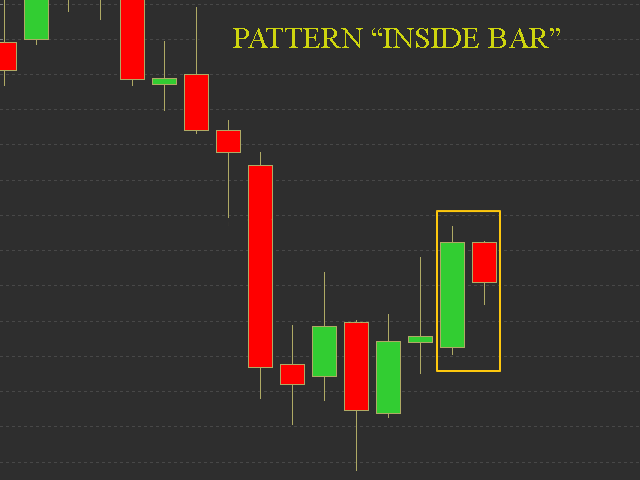
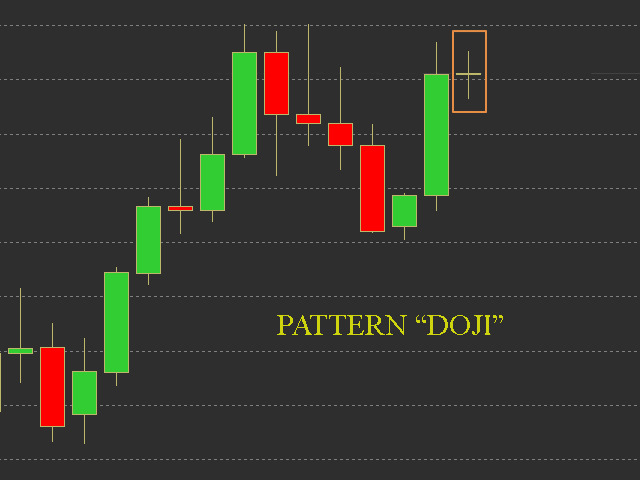
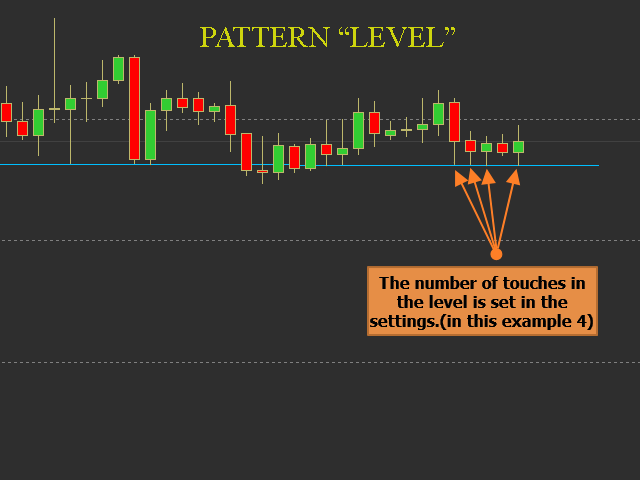
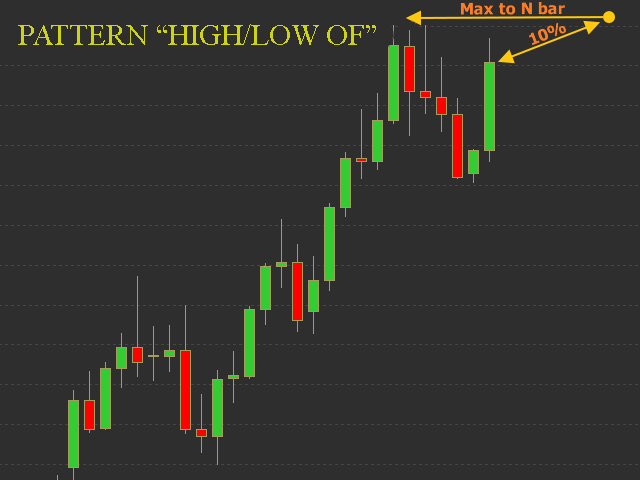
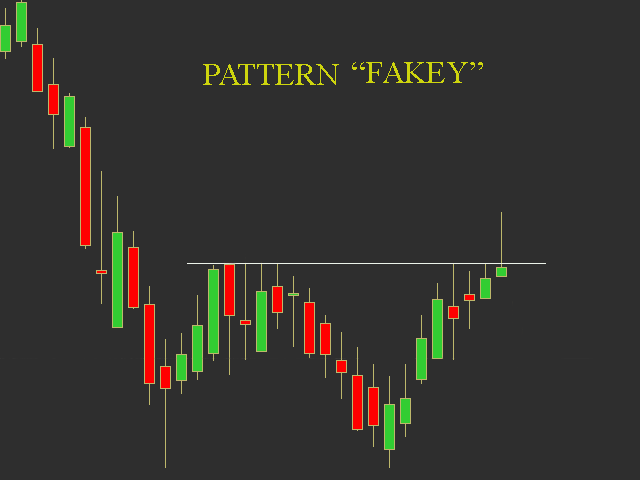
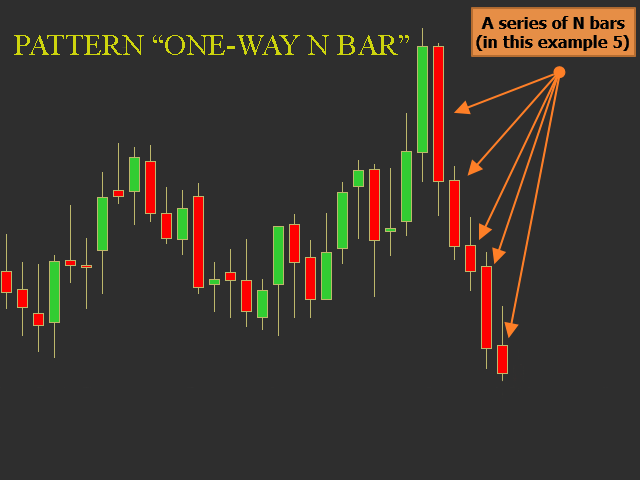
This panel is designed for quick visual search for the price action patterns on several instruments simultaneously. It is possible to add and remove instruments. Clicking the signal button allows you to quickly move to the chart with the identified pattern and timeframe. The panel searches for 8 candlestick patterns: PIN-BAR, EXTERNAL BAR, INSIDE BAR, DOJI, LEVEL, HIGH/LOW OF N BAR, FAKEY, ONE-WAY N BAR. Any of the patterns or the periods can be disabled by clicking its title. It can also search in history (by previous bars) with the buttons "<<" and ">>", as well as send push notifications at periods M1, M5, M15, M30, H1. For correct operation, it is better to use a broker with 5-digit quotes. It features a highly customizable interface and adjustment of pattern search. The panel can be scrolled using the "UP" and "DOWN" keys.
Input parameters
- CurrencyNameSettings
- CurrencylList - list of the used trading instruments.
- PinBar_Settings
- BodyShadow - how many times the pin-bar body should be less than the shadow.
- Level
- LevelQuantityBar - the number of bars to search for the level.
- TouchLevel - the number of level touches.
- High Low Of
- HighLowOfBar - the number of bars to search for the maximum high and minimum low.
- Fakey
- FakeyQuantityBar - the number of bars to search for the level for Fakey.
- TouchFakey - the number of level touches with Fakey.
- BreakDownBar - the number of bars to search for false breakouts.
- CoefficientFakey - coefficient for the size of a false breakout spike (the higher the value, the smaller the breakout spike).
- SeriesOfOneWayBars
- OneWayBars - the number of consecutive bars in the same direction.
- Push-Notifications
- AlertPeriod - period for sending push notifications.
- NotificationPinBarBuy - enable/disable notifications about PIN-BAR signals to BUY.
- NotificationPinBarSell - enable/disable notifications about PIN-BAR signals to SELL.
- NotificationExternalBarBuy - enable/disable notifications about EXTERNAL BAR signals to BUY.
- NotificationExternalBarSell - enable/disable notifications about EXTERNAL BAR signals to SELL.
- NotificationInsideBarBuy - enable/disable notifications about INSIDE BAR signals to BUY.
- NotificationInsideBarSell - enable/disable notifications about INSIDE BAR signals to SELL.
- NotificationDojiBuy - enable/disable notifications about DOJI signals to BUY.
- NotificationDojiSell - enable/disable notifications about DOJI signals to SELL.
- NotificationLevelBuy - enable/disable notifications about LEVEL signals to BUY.
- NotificationLevelSell - enable/disable notifications about LEVEL signals to SELL.
- NotificationHighLowBuy - enable/disable notifications about HIGH/LOW OF signals to BUY.
- NotificationHighLowSell - enable/disable notifications about HIGH/LOW OF signals to SELL.
- NotificationFakeyBuy - enable/disable notifications about FAKEY signals to BUY.
- NotificationFakeySell - enable/disable notifications about FAKEY signals to SELL.
- NotificationOneWayBuy - enable/disable notifications about ONE-WAY OF signals to BUY.
- NotificationOneWaySell - enable/disable notifications about ONE-WAY OF signals to SELL.
- Interface Settings - color settings of the panel interface.
- SignalButton - color settings of the signal buttons.
- Button - color settings of the currency buttons.


Этот индикатор незаменимая вещь, как для новичков, так и для опытных трейдеров. Он позволяет существенно экономить Ваше время на проведение технического анализа, а при работе от ключевых уровней в разы повышает прибыльность Вашего трейдинга. Большое спасибо Роману за этот продукт, за обратную связь и за помощь!