TrenderFlex PRO

🎯 TrendFlex Pro - プロフェッショナル適応型チャネルシステム

TrendFlex Proは、適応型ガウスエンベロープを使用して動的なサポート&レジスタンスレベルを正確に特定する、革新的な新世代のインジケーターです。市場のボラティリティに自動的に適応し、高精度の取引シグナルを生成します。

主な利点:

  • 適応技術 - あらゆる金融商品や時間足に自動調整
  • 2つの動作モード - ダイナミック(リペイントあり)とスタティック(リペイントなし)
  • スマートシグナル - 確認付きで偽のブレイクアウトをフィルタリング
  • 視覚的な統計 - シグナル成功率パネルを内蔵
  • 多様性 - FX、指数、暗号通貨、株式で動作
  • 最適化済み - ターミナルへの負荷を最小限に

📊 動作原理:

このインジケーターは、ガウス加重を使用して価格の周りに適応型チャネルを構築します。標準的なチャネルとは異なり、TrendFlex Proは市場のボラティリティに応じてバンドの幅を動的に変更します。これにより、以下のことが可能になります:

  • 📈 買われ過ぎ/売られ過ぎの瞬間を正確に特定
  • 🎯 極値でのトレンド転換を捉える
  • 💰 動きが継続する確率が高いブレイクアウトで市場に参入
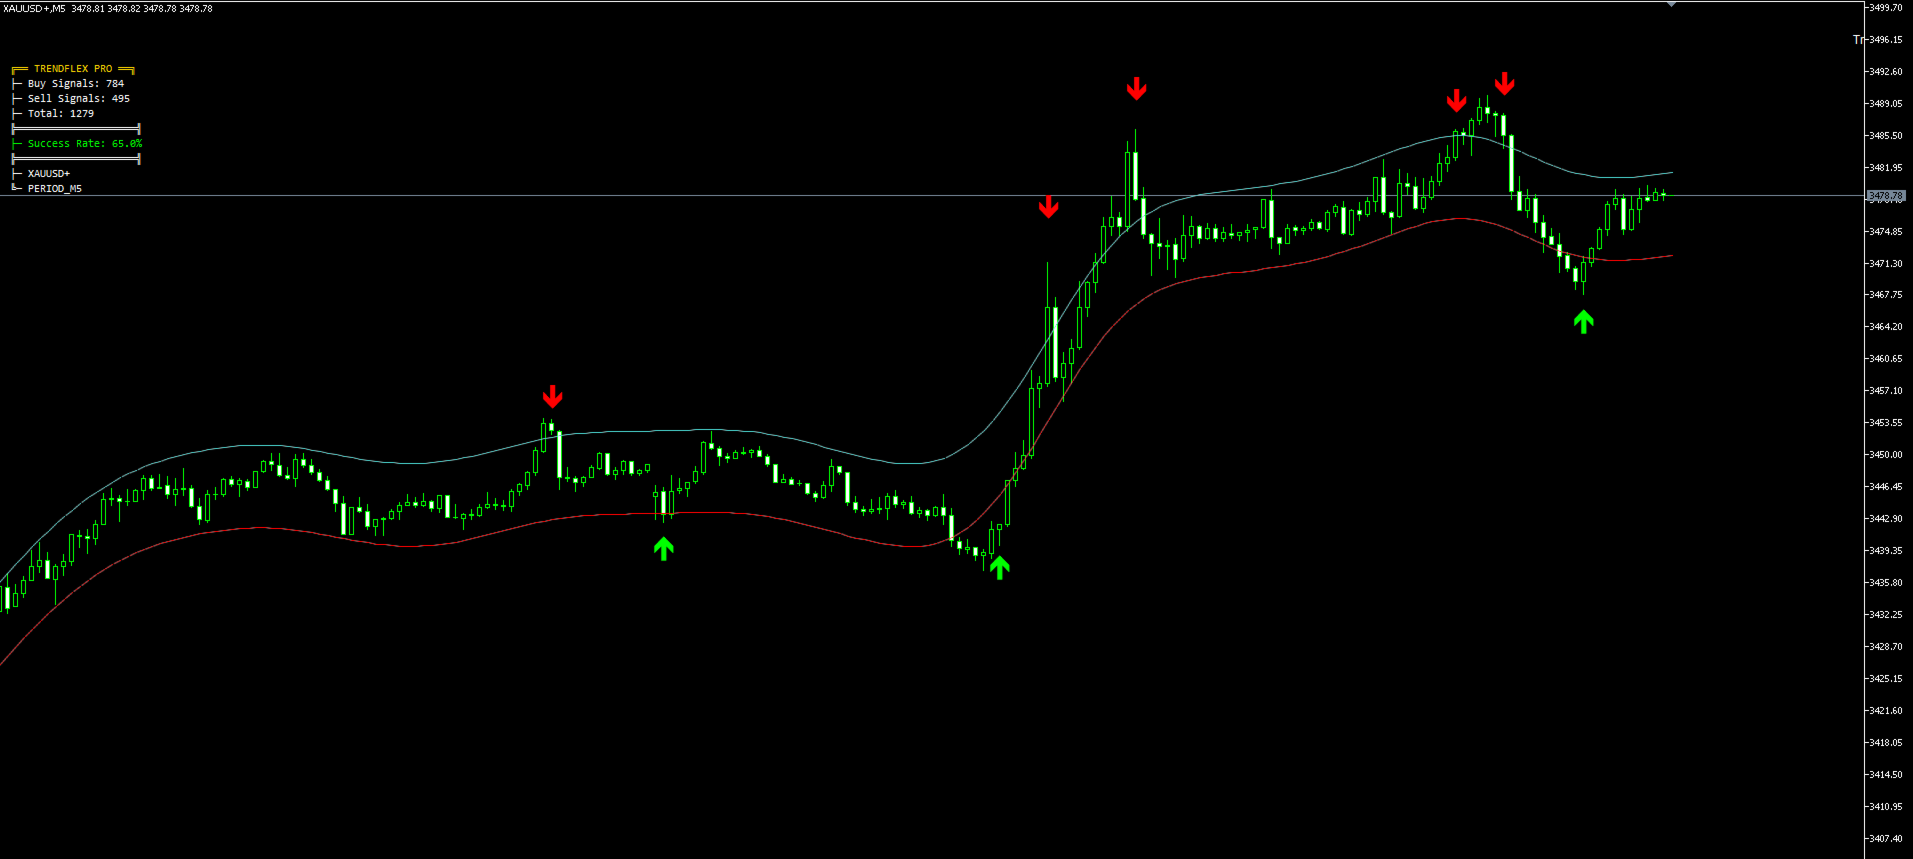
🚀 取引シグナル:

買いシグナル (BUY):

  • 🟢 価格がチャネルの下側バンドよりで確定したときに表示されます
  • 🟢 ローソク足の下に緑色の矢印が表示されます
  • 🟢 ロジック:市場は売られ過ぎであり、上昇への反発が期待されます

売りシグナル (SELL):

  • 🔴 価格がチャネルの上側バンドよりで確定したときに表示されます
  • 🔴 ローソク足の上に赤色の矢印が表示されます
  • 🔴 ロジック:市場は買われ過ぎであり、下降への調整が期待されます

⚙️ 入力パラメーター:

TrendFlexの主な設定:

パラメーター デフォルト値 説明
Flex Bandwidth 8.0 ガウスウィンドウの幅。値が大きいほど線が滑らかになります
Flex Multiplier 3.0 チャネルの乗数。大きいほどチャネルが広くなります
Price Source PRICE_CLOSE 計算用の価格ソース (終値/始値/高値/安値/中間価/代表値)

シグナル設定:

パラメーター デフォルト値 説明
Show Trading Signals true シグナルの矢印を表示
Signal Arrow Size 3 矢印のサイズ (1-5)
Alert on New Signals false 新しいシグナルでのサウンドアラート

表示設定:

パラメーター デフォルト値 説明
Dynamic Repainting Mode true ダイナミックモード (true) またはスタティックモード (false)
Upper Band Color Turquoise 上側バンドの色
Lower Band Color Red 下側バンドの色

📈 動作モード:

1. ダイナミックモード (Dynamic Mode)

  • ✨ リアルタイムでチャネルを再描画(リペイント)します
  • ✨ 現在の状況に対して最高の精度を提供します
  • ✨ 分析やエントリーポイントの発見に最適です

2. スタティックモード (Static Mode)

  • 🔒 過去の値を再描画(リペイント)しません
  • 🔒 戦略のテストに適しています
  • 🔒 シグナルは永久に固定されます

💡 使用に関する推奨事項:

異なるスタイルに最適な設定:

スキャルピング (M1-M15):

Flex Bandwidth: 5-7 Flex Multiplier: 2.0-2.5 Dynamic Mode: true

デイトレード (M30-H4):

Flex Bandwidth: 8-10 Flex Multiplier: 3.0-3.5 Dynamic Mode: true

長期取引 (D1-W1):

Flex Bandwidth: 12-15 Flex Multiplier: 3.5-4.0 Dynamic Mode: true

🎯 取引戦略:

戦略1:境界からの反発

  • BUYシグナルで買い、チャネルの中間を目指します
  • SELLシグナルで売り、チャネルの中間を目指します
  • ストップロス:チャネルの境界を10-20ポイント超えた位置

戦略2:継続を伴うブレイクアウト

  • 主要なトレンドの方向に従ってシグナルでエントリーします
  • 反対側の境界に達するまでポジションを保持します
  • 主要なレベルで部分的に利益を確定します

📊 統計パネルに含まれるもの:

  • 📈 買い/売りシグナルの数
  • 📊 総シグナル数
  • ✅ 成功率 - 成功したシグナルの割合
  • 🕐 現在の時間足とシンボル

⚠️ 重要情報:

  • ⚡ インジケーターはシグナル(矢印)をリペイントしません
  • ⚡ すべての口座タイプ(ECN, Standard, Cent)で動作します
  • ⚡ MT5ビルド2000以上と互換性があります
  • ⚡ すべての通貨ペアとCFDをサポートしています

🚀 TrendFlex Proの利点:

  1. 数学的な精度 - 平滑化のためにガウス関数を使用
  2. 適応性 - ボラティリティへの自動調整
  3. 多様性 - あらゆる金融商品と時間足に対応
  4. 視覚化 - Canvas技術による美しい表示
  5. パフォーマンス - 最適化されたコード
  6. サポート - 定期的なアップデートと改善

💬 サポートとアップデート:

✉️ コメント欄での技術サポートと質問への回答
🔄 すべての購入者に無料アップデートを提供
📚 詳細なドキュメントと使用例

© 2024 FOREX BP | TrendFlex Pro Trading System

最先端の技術を駆使して、自信を持って取引しましょう!

おすすめのプロダクト
Follow The Line MT5
Oliver Gideon Amofa Appiah
4.52 (29)
This indicator obeys the popular maxim that: "THE TREND IS YOUR FRIEND" It paints a GREEN line for BUY and also paints a RED line for SELL. (you can change the colors). It gives alarms and alerts of all kinds. IT DOES NOT REPAINT and can be used for all currency pairs and timeframes. Yes, as easy and simple as that. Even a newbie can use it to make great and reliable trades. NB: For best results, get my other premium indicators for more powerful and reliable signals. Get them here: https://www.m
FREE
トレンドキャッチャー: アラートインジケーター付きのトレンドキャッチャーストラテジーは、市場トレンドやポテンシャルなエントリーポイントやエグジットポイントを特定するのに役立つ多目的な技術分析ツールです。動的なトレンドキャッチャーストラテジーを備えており、市場状況に適応してトレンドの方向を明確に視覚化します。トレーダーは、自身の好みやリスク許容度に合わせてパラメーターをカスタマイズできます。このインジケーターはトレンドの識別を支援し、ポテンシャルなリバーサルをシグナルし、トレイリングストップのメカニズムとして機能し、市場への迅速な対応のためのリアルタイムアラートを提供します。 特徴: - トレンドの識別:上昇トレンドと下降トレンドをシグナルします。 - トレンドのリバーサル:ローソク足の色が上昇から下降に変わった場合やその逆の場合に、ポテンシャルなリバーサルを警告します。 - リアルタイムアラート:新しいトレンドの識別に対するアラートを生成します。 推奨事項: - 通貨ペア:EURUSD、AUDUSD、XAUUSDなど... - タイムフレーム:H1。 - アカウントタイプ:
FREE
概要 このインジケーターは、クラシックな ドンチャンチャネル を強化したバージョンで、実践的なトレード機能を追加しています。 標準の3本線(上限、下限、中央線)に加え、 ブレイクアウト を検出し、チャート上に矢印で視覚的に表示します。また、チャートを見やすくするために、 現在のトレンド方向と逆側のラインのみを表示 します。 インジケーターの機能: 視覚的シグナル :ブレイクアウト時にカラフルな矢印を表示 自動通知 :ポップアップ、プッシュ通知、Eメール RSIフィルター :市場の相対的な強弱に基づいてシグナルを検証 カスタマイズ可能 :色、ラインの太さ、矢印コード、RSI閾値など 動作原理 ドンチャンチャネルは次のように計算します: 上限線 :直近N本のクローズ済みローソク足の最高値 下限線 :直近N本のクローズ済みローソク足の最安値 中央線 :最高値と最安値の平均値 上方ブレイクアウト は終値が上限線を超えたときに発生し、 下方ブレイクアウト は終値が下限線を下回ったときに発生します。 インジケーターは以下を行います: 3本のドンチャンラインを描画 方向転換後の最初のブレイクアウト
FREE
Donchian Channel is an indicator created by Richard Donchian. It is formed by taking the highest high and the lowest low of the last specified period in candles. The area between high and low is the channel for the chosen period. Its configuration is simple. It is possible to have the average between the upper and lower lines, plus you have alerts when price hits one side. If you have any questions or find any bugs, please contact me. Enjoy!
FREE
Cumulative Delta Indicator for MetaTrader 5 The Cumulative Delta Indicator is a dedicated volume analysis tool on MetaTrader 5 that monitors market buying and selling pressure. By comparing order flow data, it displays cumulative volume changes to help traders identify divergence signals. This MT5 indicator supports the detection of strong market trends, enhances liquidity analysis, and confirms price action behavior. «Indicator Installation & User Guide» MT5 Indicator Installation  |  Cumulativ
FREE
Sideway Trend Indicator for MetaTrader 5 The Sideway Trend Indicator for MetaTrader 5 is a practical analytical tool designed to detect consolidation phases where the market lacks directional movement. During such periods of reduced volatility, the indicator visualizes the range-bound behavior. Once the price breaks out of this sideways phase, the tool issues clear entry signals, enabling traders to act with improved timing and accuracy. «Indicator Installation & User Guide» MT5 Indicator Instal
FREE
Statistical Arbitrage Spread Generator for Cointegration [MT5] What is Pair Trading? Pair trading is a market-neutral strategy that looks to exploit the relative price movement between two correlated assets — instead of betting on the direction of the market. The idea? When two assets that usually move together diverge beyond a statistically significant threshold, one is likely mispriced. You sell the expensive one, buy the cheap one , and profit when they converge again. It’s a statistica
FREE
High Low Open Close
Alexandre Borela
4.98 (42)
このプロジェクトが好きなら、5つ星レビューを残してください。 このインジケータは、指定されたためのオープン、ハイ、ロー、クローズ価格を描画します 特定のタイムゾーンの期間と調整が可能です。 これらは、多くの機関や専門家によって見られた重要なレベルです トレーダーは、彼らがより多くのかもしれない場所を知るために有用であり、 アクティブ。 利用可能な期間は次のとおりです。 前の日。 前週。 前の月。 前の四半期。 前年。 または: 現在の日。 現在の週。 現在の月。 現在の四半期。 現年。
FREE
Free automatic Fibonacci is an indicator that automatically plots a Fibonacci retracement based on the number of bars you select on the BarsToScan setting in the indicator. The Fibonacci is automatically updated in real time as new highest and lowest values appears amongst the selected bars. You can select which level values to be displayed in the indicator settings. You can also select the color of the levels thus enabling the trader to be able to attach the indicator several times with differe
FREE
Easy Correlations Indicator The Easy Correlations Indicator is designed to help traders analyze the relationship between two correlated instruments. By monitoring the distance between their Relative Strength Index (RSI) values, the indicator highlights situations where one instrument has moved significantly further than the other. This creates potential trading opportunities: Sell the stronger instrument (overstretched RSI) Buy the weaker instrument (lagging RSI) Because the positions are opened
FREE
Indicator and Expert Adviser  EA Available in the comments section of this product. Download with Indicator must have indicator installed for EA to work. Mt5 indicator alerts for bollinger band and envelope extremes occurring at the same time. Buy signal alerts occur when A bullish candle has formed below both the lower bollinger band and the lower envelope  Bar must open and close below both these indicators. Sell signal occur when A bear bar is formed above the upper bollinger band and upper
FREE
Dual RSI
Paul Conrad Carlson
3 (1)
Indicator alerts for Dual Relative strength index rsi. Large rsi preset at 14 is below 30 small rsi preset at 4 is below 10 for buy bullish signals . Large rsi preset are 14 is above 70 small rsi preset at 4 is above 90 for sell bearish signals . Includes mobile and terminal alerts. draws lines when alerts. This indicator can help identify extremes and then the tops or bottoms of those extremes .
FREE
Introducing the MACD  Enhanced – an advanced MACD (Moving Average Convergence Divergence) indicator that provides traders with extended capabilities for trend and momentum analysis in financial markets. The indicator uses the difference between the fast and slow exponential moving averages to determine momentum, direction, and strength of the trend, creating clear visual signals for potential entry and exit points. Attention! To achieve the best results, it is recommended to adapt the indicator
FREE
Important Lines
Terence Gronowski
4.87 (23)
This indicator displays Pivot-Lines, preday high and low, preday close and the minimum and maximum of the previous hour. You just have to put this single indicator to the chart to have all these important lines, no need to setup many single indicators. Why certain lines are important Preday high and low : These are watched by traders who trade in a daily chart. Very often, if price climbs over or falls under a preday low/high there is an acceleration in buying/selling. It is a breakout out of a
FREE
Coral trend is   a trend-following indicator that is widely popular among FOREX traders . It is usually used as a confluence with other indicators. It uses combinations of moving averages with complex smoothing formulas! It has two configurable parameters: Coefficient   - smoothing ratio (*) Applied price Calculation: Coral = (-0.064) * B6 + 0.672 * B5 - 2.352 * B4 + 2.744 * B3
FREE
Value Chart Candlesticks
Flavio Javier Jarabeck
4.69 (13)
The idea of a Value Chart indicator was presented in the very good book I read back in 2020 , " Dynamic Trading Indicators: Winning with Value Charts and Price Action Profile ", from the authors Mark Helweg and David Stendahl. The idea is simple and the result is pure genius: Present candlestick Price analysis in a detrended way! HOW TO READ THIS INDICATOR Look for Overbought and Oversold levels. Of course, you will need to test the settings a lot to find the "correct" one for your approach. It
FREE
FlatBreakout MT5 (Free Version) Flat Range Detector and Breakout Panel for MT5 — GBPUSD Only FlatBreakout MT5   is the free version of the professional FlatBreakoutPro MT5 indicator, specially designed for flat (range) detection and breakout signals on the   GBPUSD   pair only. Perfect for traders who want to experience the unique fractal logic of FlatBreakout MT5 and test breakout signals on a live market without limitations. Who Is This Product For? For traders who prefer to trade breakout of
FREE
ZP Day Trading Indicator in MT5 The ZP Day Trading Indicator is one of the tools developed based on Price Action trading style concepts in MetaTrader 5. This indicator uses color-coded boxes to identify Trading Ranges on the chart. A trading range forms when the price moves within a specific range between a resistance level (ceiling) and a support level (floor) over a period of time. In such scenarios, buyers and sellers reach equilibrium within the defined range. «Indicator Installation & User
FREE
VFI Quantum
Nikita Berdnikov
5 (1)
Introducing VFI (Volume Flow Indicator) – a trading indicator that analyzes the relationship between volume and price movement to identify key trading opportunities. The indicator displays the strength and direction of volume flow, providing clear signals about potential entry and exit points. Signals are formed based on zero line crossovers, crossovers between the VFI line and its exponential moving average (EMA), and when the indicator exits overbought and oversold zones. Attention! This stra
FREE
Easy GOLD MT5
Franck Martin
3.97 (38)
Easy Gold is the latest addition to the BotGPT family. It is surprising and very powerful. It is ideal for beginners due to its simplicity.  There is absolutely nothing to do, it's 100% automated, simply indicate the percentage of risk you want to take per trade and the EA is ready. Whatever your capital, the EA takes care of everything. Optimized on (XAUUSD).  Unleash all the power with the professional version (AGI Gold) and its connection to the neural network, available in my store. My othe
FREE
Market Profile 3 ForexArby com
Hussien Abdeltwab Hussien Ryad
3.93 (14)
Market Profile 3 MetaTrader 5 indicator  version 4.70— is a classic Market Profile implementation that can show the price density over time, outlining the most important price levels, value area, and control value of a given trading session. This indicator can be attached to timeframes between M1 and D1 and will show the Market Profile for daily, weekly, monthly, or even intraday sessions. Lower timeframes offer higher precision. Higher timeframes are recommended for better visibility. It is als
FREE
Friend of the Trend: Your Trend Tracker Master the market with Friend of the Trend , the indicator that simplifies trend analysis and helps you identify the best moments to buy, sell, or wait. With an intuitive and visually striking design, Friend of the Trend analyzes price movements and delivers signals through a colorful histogram: Green Bars : Signal an uptrend, indicating buying opportunities. Red Bars : Alert to a downtrend, suggesting potential selling points. Orange Bars : Represent cons
FREE
Tops & Bottoms Indicator FREE   Tops abd Bottoms:   An effective indicator for your trades The tops and bottoms indicator helps you to find  ascending and descending channel formations with indications of ascending and/or descending tops and bottoms. In addition, it  show possibles  opportunities with a small yellow circle when the indicator encounters an impulse formation. This indicator provide to you  more security and speed in making entry decisions. Also test our FREE advisor indicator:  
FREE
This indicator is a zero-lag indicator and displays  strength of trend change . True Trend  Oscillator Pro works best in combination with True Trend Moving Average Pro that displays exact trend as is. Oscillator value is exact price change in given direction of the trend. True Trend Moving Average Pro: https://www.mql5.com/en/market/product/103586 If you set PERIOD input parameter to 1 this indicator becomes a sharpshooter for binary options. Developers can use True Trend Oscillator in Exper
FREE
インジケーター   Haven FVG   は、市場を分析するためのツールで、チャート上で非効率性の領域(Fair Value Gaps、FVG)を特定することができ、トレーダーに価格分析と取引決定のための主要なレベルを提供します。 他の製品 ->  ココ 主な特徴: 個別のカラー設定: ブルFVGの色   (Bullish FVG Color)。 ベアFVGの色   (Bearish FVG Color)。 柔軟なFVGの視覚化: FVGを検索するための最大ローソク足数。 FVGゾーンの追加延長(特定のバー数)。 FVGの塗りつぶしを有効にするオプション。 中央線(Middle Line): 線の色とスタイルの選択(例:点線)。 線の太さの調整。 一般設定: FVGを現在のバーまで拡張。 塗りつぶしのある歴史的なFVGを除外し、最新のデータに焦点を当てる。 チャート上の非効率性の領域を分析し、根拠のある取引決定を行う簡単で効果的な方法。
FREE
The Half ma arrow indicator for the MetaTrader 5 trading terminal is a simple but effective tool that gives a signal about a change in the current trend. The Half ma indicator looks like a solid dynamic line that changes color at the points where the trend changes. At these points, the indicator draws arrows of the corresponding color and direction.The Half ma arrow indicator for the MT5 terminal is not an independent source of input signals. It will be most effective to use it as a trend filte
Are you tired of drawing trendlines every time you're analyzing charts? Or perhaps you would like more consistency in your technical analysis. Then this is for you. This indicator will draw trend lines automatically when dropped on a chart. How it works Works similar to standard deviation channel found on mt4 and mt5. It has 2 parameters: 1. Starting Bar 2. Number of bars for calculation The   starting bar   is the bar which drawing of the trend lines will begin, while the   number of bars for c
FREE
The indicator identifies when a divergence occurs between price and an indicator or oscillator. It identifies both regular and hidden divergences. Combined with your own rules and techniques, this indicator will allow you to create (or enhance) your own powerful system. For higher probability setups I can recommend you to use my Supply Demand indicator and trade only if the divergence occurs inside a zone. Supply zone for bearish div and demand zone for bullish div. The optimal scenario is if it
FREE
The idea of the system is to indentify the reversal patterns using the calculation of the composite candle. The reversal patterns is similar to the "Hammer" and "Hanging Man" patterns in Japanese candlestick analysis. But it uses the composite candle instead the single candle and doesn't need the small body of the composite candle to confirm the reversal. Input parameters: Range - maximal number of bars, used in the calculation of the composite candle. Minimum - minimal size of the composite can
FREE
このプロダクトを購入した人は以下も購入しています
このインジケーターを購入された方には、以下の特典を 無料 で提供しています: 各トレードを自動で管理し、ストップロスとテイクプロフィットを設定し、戦略ルールに基づいてポジションを決済する補助ツール 「Bomber Utility」 様々な銘柄に合わせたインジケーターの設定ファイル(セットファイル) 「最小リスク」、「バランスリスク」、「待機戦略」 の3つのモードで使用できる Bomber Utility 用の設定ファイル このトレーディング戦略をすぐに導入・設定・開始できる ステップバイステップのビデオマニュアル ご注意: 上記の特典を受け取るには、MQL5のプライベートメッセージシステムを通じて販売者にご連絡ください。 オリジナルのカスタムインジケーター 「Divergence Bomber(ダイバージェンス・ボンバー)」 をご紹介します。これは、MACDのダイバージェンス(乖離)戦略に基づいた 「オールインワン」型のトレーディングシステム です。 このテクニカルインジケーターの主な目的は、価格とMACDインジケーターの間に発生するダイバージェンスを検出 し、将来の価格の動きを示す
優れたテクニカルインジケーター「Grabber」をご紹介します。これは、すぐに使える「オールインワン」トレーディング戦略として機能します。 ひとつのコードに、市場のテクニカル分析ツール、取引シグナル(矢印)、アラート機能、プッシュ通知が強力に統合されています。 このインジケーターを購入された方には、以下の特典を無料で提供します: Grabberユーティリティ:オープンポジションを自動で管理するツール ステップバイステップのビデオマニュアル:インジケーターのインストール、設定、取引方法を解説 カスタムセットファイル:インジケーターをすばやく自動設定し、最大限の成果を出すための設定ファイル 他の戦略はもう忘れてください!Grabberだけが、あなたを新たなトレードの高みへと導いてくれるのです。 Grabber戦略の主な特徴: 推奨タイムフレーム:M5〜H4 対応通貨ペア・資産:どれでも使用可能ですが、私が実際に検証した以下を推奨します(GBPUSD、GBPCAD、GBPCHF、AUDCAD、AUDUSD、AUDSGD、AUDCHF、NZDUSD、NZDCAD、EURCAD、EURUSD、E
「Entry In The Zone and SMC Multi Timeframe」は、スマートマネーコンセプト(SMC)フレームワークに基づいて開発されたリアルタイムの市場分析ツールです。複数の時間軸にわたり、反転ポイントや重要なゾーンを自動で分析し、リペイント(描き直し)がないシグナルを提供し、注目すべきポイント(POI)を強調表示します。さらに、オートフィボナッチレベル機能を搭載しており、フィボナッチラインを自動で描画して、プルバックや反転ポイントの検出を支援します。このツールはトレーダーがより自信を持って計画を立て、構造的に意思決定を行うことを可能にし、スマートマネーコンセプトに基づいた注文エントリーの効率を高めます。インジケーターとシグナルシステム(2-in-1)パッケージとして、インテリジェントなゾーン分析とリアルタイムの取引エントリーシグナルを1つのツールに統合しています。このシステムを直接使用する場合でも、独自の分析に利用する場合でも、個々のトレーディングスタイルに合わせてカスタマイズ可能です。 ------------------------------------
FX Volume MT5
Daniel Stein
4.84 (19)
FX Volume:ブローカー視点で捉える本物の市場センチメント クイック概要 トレード手法をさらに高めたいとお考えですか? FX Volume は、リテールトレーダーやブローカーのポジション状況をリアルタイムで提供します。これは、COTのような遅延レポートよりもはるかに早く知ることができます。安定した利益を目指す方も、さらなる優位性を求める方も、 FX Volume は大きな不均衡を見極め、ブレイクアウトを確認し、リスク管理を洗練させるのに役立ちます。今すぐ始めて、実際の出来高データがどのように意思決定を変革するかを体感してください! 1. FX Volume がトレーダーにとって非常に有益な理由 高精度の早期警戒シグナル • 各通貨ペアを売買しているトレーダー数を、他者よりも早く、ほぼリアルタイムで把握できます。 • FX Volume は、複数のリテールブローカーから得られる本物の出来高データを収集し、分かりやすい形式で提供する 唯一 のツールです。 強力なリスク管理 • ロングやショートの大きな偏り(インバランス)を特定し、潜在的なトレンド転換を見逃しません。ストップ
これまでに、 素晴らしいバックテスト結果、 驚くべき数値を持つ ライブ口座のパフォーマンス証明 、そして あらゆる場所での統計情報 がある取引インジケーターを購入し、しかし使用後に 口座を破綻させてしまった ことは何度ありますか? シグナル単独を信用すべきではありません。そもそもなぜそれが表示されたのかを知る必要があります。そして、それこそがRelicusRoad Proの得意とすることです! ユーザーマニュアル + 戦略 + トレーニングビデオ + VIPアクセス付きプライベートグループ + モバイル版利用可能 市場の見方を変える新しい方法 RelicusRoadは、FX、先物、仮想通貨、株式、指数に対応する、 世界で最も強力で最高の取引インジケーター であり、トレーダーが口座を 成長させる ために必要なすべての情報とツールを提供します。 初心者 から 上級者 まで、 すべてのトレーダー が成功できるよう、 テクニカル分析 と 取引計画 を提供します。 これは、将来の市場を 予測する のに十分な情報を提供する 主要な取引インジケーター です。私たちは、チャート上で意味をなさない複
Atbot
Zaha Feiz
4.67 (51)
AtBot: どのように機能し、どのように使用するか ### どのように機能するか MT5プラットフォーム用の「AtBot」インジケーターは、テクニカル分析ツールの組み合わせを使用して売買シグナルを生成します。単純移動平均(SMA)、指数移動平均(EMA)、および平均真実範囲(ATR)インデックスを統合して取引機会を特定します。さらに、Heikin Ashiキャンドルを使用してシグナルの精度を向上させることもできます。 購入後にレビューを残すと、特別なボーナスギフトを受け取ります。 ### 主な機能: - 再描画なし: シグナルはプロット後に変更されません。 - 再描画なし: シグナルは一貫しており、変更されません。 - 遅延なし: 遅延なくタイムリーなシグナルを提供します。 - 多様な時間枠: あらゆる時間枠で使用可能で、取引戦略に合わせることができます。 ### 操作手順: #### 入力と設定: - firstkey (TrendValue): トレンド検出の感度を調整します。 - Secondkey (SignalValue): 売買シグナル生成の感度を定義します。 - ma
「 Dynamic Scalper System MT5 」インジケーターは、トレンド波の中でスキャルピング取引を行う手法のために設計されています。 主要通貨ペアと金でテスト済みで、他の取引商品との互換性があります。 トレンドに沿った短期的なポジションオープンのシグナルを提供し、追加の価格変動サポートも提供します。 インジケーターの原理 大きな矢印はトレンドの方向を決定します。 トレンド波の中では、小さな矢印の形でスキャルピングシグナルを生成するアルゴリズムが機能します。 赤い矢印は強気方向、青い矢印は弱気方向です。 トレンドの方向には敏感な価格変動ラインが描かれ、小さな矢印のシグナルと連動します。 シグナルは次のように機能します。適切なタイミングでラインが現れるとエントリーシグナルが形成され、ラインが開いている間はポジションが保持され、完了すると取引が終了します。 推奨される動作時間枠はM1~H4です。 矢印は現在のローソク足に形成され、次のローソク足が開いている場合は、前のローソク足の矢印は再描画されません。 入力パラメータ Trend Wave Period - トレ
Trend Ai indicatorは、トレンドの識別と実用的なエントリポイントと反転アラートを組み合わせることで、トレーダーの市場分析を強化する優れたツールです。 この指標は、ユーザーが自信と正確さで外国為替市場の複雑さをナビゲートすることを可能にします トレンドAiインジケーターは、主要なシグナル以外にも、プルバックやリトレースメント中に発生するセカンダリエントリポイントを識別し、トレーダーが確立されたトレンド内の価格修正を活用できるようにします。 重要な利点: *MT4およびMT5の仕事 *明確な買いまたは売りシグナル *再描画しません ·すべての資産で動作します 私はeaやセットをtelegram it詐欺で販売しないように注意してください。 すべての設定はここでブログで無料です。  重要! 指示とボーナスを得るために購入後すぐに私に連絡してください! 私の他のプロダクトと同様、実質操作の監視はここに見つけることができます: https://www.mql5.com/en/users/mechanic/seller&nbsp ; 設定および入力: すべての
VERSION MT4        —        ИНСТРУКЦИЯ RUS           —        INSTRUCTIONS  ENG 主な機能: レンダリングなしで正確な入力信号! シグナルが表示されると、それは関連性を維持します。これは、シグナルを提供してからそれを変更し、その結果、入金された資金が失われる可能性があるリドローインジケーターとの重要な違いです。より高い確率と精度で市場に参入できるようになりました。矢印が表示された後、ターゲットに到達する (利益確定) か反転シグナルが表示されるまで、ローソク足に色を付ける機能もあります。 STOP-LOSS/TAKE-PROFITゾーンの表示 エントリーポイントを検索する際の視覚的な明瞭さを改善するために、最適な市場エントリーポイントが検索される購入/販売ゾーンを最初に表示するモジュールが作成されました。ストップロスレベルを操作するための追加のインテリジェントロジックは、時間の経過とともにそのサイズを縮小するのに役立ち、それによって取引に参加するときの初期リスクを軽減します(Move SL)。 より高いタイ
Matrix Arrow Indicator MT5
Juvenille Emperor Limited
5 (16)
マトリックスアローインジケーターMT5は、すべてのシンボル/商品(外国為替、商品、暗号通貨、インデックス、株式)で使用できる100%再描画されていないマルチタイムフレームインジケーターに続くユニークな10in1トレンドです。マトリックスアローインジケーターMT5は、初期段階で現在のトレンドを判断し、最大10の標準インジケーターから情報とデータを収集します。 平均方向移動指数(ADX) 商品チャネルインデックス(CCI) クラシック平研アシキャンドル 移動平均 移動平均収束発散(MACD) 相対活力指数(RVI) 相対力指数(RSI) 放物線SAR ストキャスティクス ウィリアムズのパーセント範囲 すべてのインジケーターが有効な買いまたは売りシグナルを与えると、対応する矢印がチャートに印刷され、次のろうそく/バーの開始時に強い上昇トレンド/下降トレンドを示します。ユーザーは、使用するインジケーターを選択し、各インジケーターのパラメーターを個別に調整できます。マトリックスアローインジケーターMT5は選択されたインディケーターからのみ情報を収集し、それらのデータのみに基づいてアローを印刷
現在33%オフ 初心者にもエキスパートトレーダーにも最適なソリューション このインジケーターは独自の機能と新しい公式を多数内蔵しており、ユニークで高品質かつ手頃な取引ツールです。このアップデートでは、2つの時間枠ゾーンを表示できるようになります。より長いTFだけでなく、チャートTFとより長いTF(ネストゾーンを表示)の両方を表示できます。すべてのSupply Demandトレーダーの皆さんのお気に召すはずです。:) 重要情報の公開 Advanced Supply Demandの可能性を最大化するには、 https://www.mql5.com/ja/blogs/post/720245 にアクセスしてください。   エントリーまたはターゲットの正確なトリガーポイントを正確に特定できれば取引がどのように改善されるか想像してみてください。新しい基盤となるアルゴリズムに基づいて構築されているため、買い手と売り手の間の潜在的な不均衡をさらに簡単に特定できます。これは、最も強い需要と供給のゾーンと、過去のパフォーマンス(古いゾーンを表示)がグラフィカルに表現されるためです。これらの機能は、最適な
Algo Pumping
Ihor Otkydach
4.74 (19)
PUMPING STATION – あなた専用の「オールインワン」戦略 PUMPING STATIONは、あなたのトレードをより楽しく、そして効果的に変えてくれる革新的なFXインジケーターです。ただの補助ツールではなく、強力なアルゴリズムを備えた本格的なトレーディングシステムで、より安定したトレードのスタートをサポートします。 この商品をご購入いただくと、以下の特典を無料でお付けします: 専用セットファイル:自動設定による最大パフォーマンスを実現。 ステップバイステップのビデオマニュアル:PUMPING STATION戦略の使い方を学べます。 Pumping Utility:PUMPING STATION専用の半自動トレードボットで、より快適かつシンプルな運用を可能にします。 ※ご購入後すぐにご連絡ください。追加リソースへのアクセスを提供いたします。 PUMPING STATIONの仕組み: トレンド管理:市場のトレンド方向を即座に判断。トレンドはあなたの最高の味方です。 エントリーサイン:チャート上の矢印で、取引のタイミングと方向を明確に示します。 明確な目標設定:インジケーターが自
反転ゾーン - レベル / 主要プレーヤーのアクティブゾーン ロシア語の説明書 /   英語の 説明書 /   MT4バージョン このインジケーターを購入したすべての   さらに 無料で 入手: 3ヶ月   サービスからの取引シグナルへのアクセス   スーパーシグナル     — TPSproSYSTEM アルゴリズムに従った既製のエントリ ポイント。 3ヶ月   定期的に更新されるトレーニング資料にアクセスし、戦略と専門的な成長に集中できます。 平日は24時間365日サポート、非公開のトレーダーチャットへのアクセス(コミュニケーション、サポート、市場状況の分析)。 主な機能: 売り手と買い手のアクティブなゾーンを表示します。 このインジケーターは、買いと売りの適切な最初のインパルスレベル/ゾーンをすべて表示します。これらのレベル/ゾーンがアクティブになると、エントリーポイントの探索が始まり、レベルの色が変わり、特定の色で塗りつぶされます。状況をより直感的に把握できるように、矢印も表示されます。 LOGIC AI - テンプレートをアクティブ化するときにエントリポイントを検索するため
このダッシュボードは、選択されたシンボルの最新の利用可能なハーモニックパターンを表示するので、時間を節約し、より効率的に /   MT4バージョン 。 無料インジケーター:   Basic Harmonic Pattern インジケーター列 Symbol : 選択したシンボルが表示されます。 Trend :   強気または弱気 Pattern : パターンの種類(ガートレー、バタフライ、バット、カニ、サメ、サイファー、ABCD) Entry : エントリー価格 SL: ストップロス価格 TP1: 1回目の利食い価格 TP2: 2回目の利食い価格 TP3:   3回目の利食い価格 Current price :   現在値 Age (in bars):    最後に描画されたパターンの年齢 主な入力項目 Symbols:   "28 Major Currency Pairs "または "Selected Symbols "から選択。 Selected Symbols:   カンマで区切られた監視したいシンボル("EURUSD,GBPUSD,XAUUSD")。ブローカーがペアに接
Quantum TrendPulse を ご紹介します。これは、   SuperTrend   、   RSI   、および Stochastic のパワーを 1 つの包括的なインジケーターに組み合わせて、取引の可能性を最大限に引き出す究極の取引ツールです。精度と効率を求めるトレーダー向けに設計されたこのインジケーターは、市場のトレンド、勢いの変化、最適なエントリー ポイントとエグジット ポイントを自信を持って特定するのに役立ちます。 主な特徴: SuperTrend 統合: 現在の市場動向に簡単に追従し、収益性の波に乗ることができます。 RSI精度: 買われすぎと売られすぎのレベルを検出し、市場の反転のタイミングに最適で、SuperTrendのフィルターとして使用されます。 確率的精度: 確率的振動を活用して、変動の激しい市場で隠れたチャンスを見つけます。SuperTrend のフィルターとして使用されます。 マルチタイムフレーム分析:   M5 から H1 または H4 まで、さまざまなタイムフレームで市場を常に把握します。 カスタマイズ可能なアラート: カスタム取引条件が満たされ
Gartley Hunter Multi - An indicator for searching for harmonic patterns simultaneously on dozens of trading instruments and on all possible timeframes. Manual (Be sure to read before purchasing) | Version for MT4 Advantages 1. Patterns: Gartley, Butterfly, Shark, Crab. Bat, Alternate Bat, Deep Crab, Cypher 2. Simultaneous search for patterns on dozens of trading instruments and on all possible timeframes 3. Search for patterns of all possible sizes. From the smallest to the largest 4. All fou
Weis Wave with Alert MT5
Trade The Volume Waves Single Member P.C.
4.94 (16)
Rental/Lifetime Package Options and Privileges  Rent Monthly Six Months   Yearly/Lifetime Weis Wave with Speed with Alert+Speed Index x x x Manual  x x x Quick Set up Video x x x Blog x x x Lifetime Updates x x x Setup and Training Material x x Discord Access Channel "The SI traders"          x Rectangle Break Alert Tool      x How to trade with it:    http://www.tradethevolumewaves.com   ** If you purchase please contact me to setup your  : Training Room and  complete manual access.  Wei
Was: $249  Now: $149   Market Profile defines a number of day types that can help the trader to determine market behaviour. A key feature is the Value Area, representing the range of price action where 70% of trading took place. Understanding the Value Area can give traders valuable insight into market direction and establish the higher odds trade. It is an excellent addition to any system you may be using. Inspired by Jim Dalton’s book “Mind Over Markets”, this indicator is designed to suit the
FX Power: 通貨の強弱を分析して、より賢い取引を実現 概要 FX Power は主要通貨と金の実際の強弱をあらゆる市場状況で理解するための必須ツールです。強い通貨を買い、弱い通貨を売ることで、 FX Power は取引の意思決定を簡素化し、高い確率の取引機会を見出します。トレンドを追従する場合でも、極端なデルタ値を使用して反転を予測する場合でも、このツールはあなたの取引スタイルに完全に適応します。ただ取引するだけではなく、 FX Power で賢く取引をしましょう。 1. なぜ FX Power がトレーダーにとって非常に有益なのか 通貨と金のリアルタイム強弱分析 • FX Power は主要通貨と金の相対的な強弱を計算し、マーケットダイナミクスに関する明確な洞察を提供します。 • どの資産がリードしているか、または後れを取っているかを監視して、取引するペアを賢く選びましょう。 マルチタイムフレームの包括的なビュー • 短期、中期、長期のタイムフレームで通貨と金の強弱を追跡し、マーケットトレンドに基づいて取引戦略を調整できます。 • スキャルピングからスイングトレード
The Trend Forecaster indicator utilizes a unique proprietary algorithm to determine entry points for a breakout trading strategy. The indicator identifies price clusters, analyzes price movement near levels, and provides a signal when the price breaks through a level. The Trend Forecaster indicator is suitable for all financial assets, including currencies (Forex), metals, stocks, indices, and cryptocurrencies. You can also adjust the indicator to work on any time frames, although it is recommen
MT4版  |  FAQ Owl Smart Levels Indicator は、 Bill Williams の高度なフラクタル、市場の正しい波構造を構築する Valable ZigZag、エントリの正確なレベルをマークする Fibonacci レベルなどの一般的な市場分析ツールを含む 1 つのインジケーター内の完全な取引システムです。 利益を得るために市場と場所に。 戦略の詳細な説明 インジケータを操作するための指示 顧問-取引助手 プライベートユーザーチャット ->購入後に私に書いて、私はプライベートチャットにあなたを追加し、あなたはそこにすべてのボーナスをダウンロードすることができます 力はシンプルさにあります! Owl Smart Levels 取引システムは非常に使いやすいので、専門家にも、市場を勉強し始めて自分で取引戦略を選択し始めたばかりの人にも適しています。 戦略と指標に秘密の数式や計算方法が隠されているわけではなく、すべての戦略指標は公開されています。 Owl Smart Levels を使用すると、取引を開始するためのシグナルをすばやく確認し、注文を出すための
ARIPoint is a powerful trading companion designed to generate high-probability entry signals with dynamic TP/SL/DP levels based on volatility. Built-in performance tracking shows win/loss stats, PP1/PP2 hits, and success rates all updated live. Key Features: Buy/Sell signals with adaptive volatility bands Real-time TP/SL/DP levels based on ATR Built-in MA Filter with optional ATR/StdDev volatility Performance stats panel (Success, Profit/Loss, PP1/PP2) Alerts via popup, sound, push, or email Cu
これはほぼ間違いなく、MetaTraderプラットフォームで見つけることができる最も完全な調和価格形成自動認識インジケーターです。 19種類のパターンを検出し、フィボナッチプロジェクションをあなたと同じように真剣に受け止め、潜在的逆転ゾーン(PRZ)を表示し、適切なストップロスとテイクプロフィットレベルを見つけます。 [ インストールガイド | 更新ガイド | トラブルシューティング | よくある質問 | すべての製品 ] 19の異なる調和価格形成を検出します プライマリ、派生および補完フィボナッチ投影(PRZ)をプロットします 過去の価格行動を評価し、過去のすべてのパターンを表示します この指標は、独自の品質とパフォーマンスを分析します 適切なストップロスとテイクプロフィットのレベルを表示します ブレイクアウトを使用して適切な取引を通知します すべてのパターン比をグラフにプロットします 電子メール/音声/視覚アラートを実装します スコット・M・カーニーの本に着想を得て、この指標は最も純粋で急を要するトレーダーのニーズを満たすように設計されています。ただし、トレードを容易にする
Trend Hunter は、外国為替、仮想通貨、CFD 市場におけるトレンド指標です。 このインジケーターの特別な特徴は、価格がトレンドラインをわずかに突き抜けたときにシグナルを変更することなく、自信を持ってトレンドに従うことです。 インジケーターは再描画されず、バーが閉じた後に市場に参入するシグナルが表示されます。 トレンドに沿って移動すると、インジケーターにはトレンドの方向に追加のエントリーポイントが表示されます。 これらのシグナルに基づいて、小さなストップロスで取引できます。 トレンドハンターは正直な指標です。 インジケーター信号の上にマウスを置くと、信号の潜在的な利益と可能なストップが表示されます。 新しい信号が表示されると、次の通知を受け取ることができます。 アラート プッシュ通知 メールによる通知 電報での通知 チャートのスクリーンショットも Telegram に送信されるため、取引を決定するために端末を開く必要はありません。 インジケーターシグナルは、電報チャネル https://www.mql5.com/ja/market/product/11085#!ta
Contact me for instruction, any questions! - Non-repaint - I just sell my products in Elif Kaya Profile, any other websites are stolen old versions, So no any new updates or support. - Lifetime update free Related product: Bitcoin Expert Introduction The Breakout and Retest strategy is traded support and resistance levels. it involves price breaking through a previous level.  The break and retest strategy is designed to help traders do two main things, the first is to avoid false breakouts. Man
ATrend
Zaha Feiz
4.81 (16)
ATrend: その仕組みと使い方 仕組み MT5プラットフォーム向けの「ATREND」インジケーターは、テクニカル分析手法の組み合わせを利用して、トレーダーに堅牢な買いと売りのシグナルを提供するように設計されています。このインジケーターは主に、ボラティリティ測定のために平均真の範囲(ATR)を活用し、潜在的な市場動向を特定するためのトレンド検出アルゴリズムを併用しています。 購入後にメッセージを残すと、特別なボーナスギフトが贈呈されます。 主な特徴: - ダイナミックなトレンド検出: インジケーターは市場トレンドを評価し、シグナルを適宜調整することで、トレーダーが優位な市場環境に合わせて戦略を立てるのを支援します。     - ボラティリティ測定: ATRを使用することで、インジケーターは最適なストップロス(SL)とテイクプロフィット(TP)レベルを決定するために不可欠な市場ボラティリティを測定します。 - シグナルの視覚化: インジケーターは、チャート上に買いと売りのシグナルを視覚的に表示することで、トレーダーの意思決定を強化します。 操作手順 入力とセッティング - TimeF
TPA True Price Action indicator reveals the true price action of the market makers through 100% non-repainting signals strictly at the close of a candle! TPA shows entries and re-entries, every time the bulls are definitely stronger than the bears and vice versa. Not to confuse with red/green candles. The shift of power gets confirmed at the earliest stage and is ONE exit strategy of several. There are available now two free parts of the TPA User Guide for our customers. The first "The Basics"
Contact me for extra bonus tool, instruction or any questions! - Non-repaint, No lag - I just sell my products in Elif Kaya Profile, any other websites are stolen old versions, So no any new updates or support. - Lifetime update free Introduction W.D. Gann’s theories in technical analysis have fascinated traders for decades. It offers a unique approach beyond traditional chart patterns. This method integrates geometry, time cycles, and even astrology to predict market movements accurately. Gann
Bill Williams Advanced is designed for automatic chart analysis using Bill Williams' "Profitunity" system. The indicator analyzes four timeframes at once. Manual (Be sure to read before purchasing) Advantages 1. Automatically analyzes the chart using the "Profitunity" system of Bill Williams. The found signals are placed in a table in the corner of the screen. 2. Equipped with a trend filter based on the Alligator indicator. Most of the system signals are recommended to be used only according t
Was: $299  Now: $149  Supply Demand uses previous price action to identify potential imbalances between buyers and sellers. The key is to identify the better odds zones, not just the untouched ones. Blahtech Supply Demand indicator delivers functionality previously unavailable on any trading platform. This 4-in-1 indicator not only highlights the higher probability zones using a multi-criteria strength engine, but also combines it with multi-timeframe trend analysis, previously confirmed swings
作者のその他のプロダクト
Burning Scalper - Advanced MFI Trading System Indicator Description Burning Scalper is a comprehensive trading system based on an enhanced Money Flow Index (MFI) indicator, designed for precise identification of market entry and exit points. The indicator combines volume and price analysis, providing traders with a complete picture of market dynamics. Key Features Intelligent Trading Signals The indicator automatically identifies optimal market entry points by analyzing extre
FREE
BluePrint Adaptive Trader - Professional Trading System Advanced Channel Trading System based on our proprietary TrenderFlex PRO algorithm Learn more about TrenderFlex PRO KEY FEATURES • TrenderFlex PRO Channel Technology - Advanced channel calculation based on our proven algorithm • Adaptive Risk Management - Automatic TP/SL calculation based on channel width • Win Rate Statistics - Real-time tracking of TP1, TP2, TP3 success rates • Multi-Timeframe Analysis - Monitor 7 timeframes simultaneou
FREE
### FTBP Telegram Panel - Your On-Chart Notification Center **FTBP Telegram Panel** is not just an Expert Advisor, but a full-featured tool for traders who want to receive instant notifications about their trades in Telegram and manage the visual style of their terminal. The product is completely free! ### Key Features * **Instant Telegram Notifications:** Get alerts for every opened and closed trade, including the ticker, volume, and financial result. * **Interactive Control Panel:** Forget
Veritas EA: アルゴリズム取引の再定義 Veritasの哲学 長年にわたる業界での経験から、静的なモデルはこれらの市場では機能しないと確信しました。Veritas — これは証明、 ダイナミック(動的)なモデル のみが勝者となれることの。私たちは、完全な透明性と静的ロジックの排除という2つの原則に基づいてこのロボットを開発しました。市場の毎日はユニークであるため、アルゴリズムは常に市場の状況に適応します。 私たちの目標は、きれいなパッケージで商品を売ることだけではありません。私たちは、実際に機能するツールを提供します。 私たちは結果を隠しません。Veritas EAは私たち自身のリアル口座で稼働しており、そのパフォーマンスをリアルタイムで監視することができます。 ロボットを無料で入手したい場合は、私のプロフィールを確認してください。 シンプルさと安全性を最優先 Veritas EAの主な利点は、その考え抜かれたシンプルさです。私たちは複雑な最適化作業をすべて引き受けました。このロボットには、 混乱を招くような何十もの入力パラメータはありません 。 なぜなら、トレーダーはプロ
CHART REVOLUTION EA - 半自動売買の革命! MT5の使いにくい標準インターフェースにうんざりしていませんか?ウィンドウの切り替えや複雑な計算はもう忘れましょう! Chart Revolution EA は、あなたのチャートをトレーダーの本格的なコマンドセンターに変える、次世代のプロフェッショナル取引パネルです! CHART REVOLUTIONが選ばれる理由 すべてを1画面で - 余分なウィンドウはもう不要 即時実行 - ワンクリックで取引を開始 スマートなリスク計算 - 証拠金に対する割合(%)でロットを自動計算 視覚的な管理 - すべてのポジションレベルをチャート上に直接表示 4つのスタイリッシュなテーマ - サイバーパンクからマトリックスまで 主な機能 取引パネル: ワンクリックでBUY/SELLポジションを発注 ロット、SL、TPの迅速な設定 クイック選択ボタン (0.01 - 1.00 ロット) プリセットSL/TPレベル (25, 50, 100, 200 ポイント) 全ポジション決済 / 利益のあるポジションの
Reflex Panel - 半自動売買の革命! MT5の使いにくい標準インターフェースにうんざりしていませんか?ウィンドウの切り替えや複雑な計算はもう忘れましょう! Chart Revolution EA は、あなたのチャートをトレーダーの本格的なコマンドセンターに変える、次世代のプロフェッショナル取引パネルです! CHART REVOLUTIONが選ばれる理由 すべてを1画面で - 余分なウィンドウはもう不要 即時実行 - ワンクリックで取引を開始 スマートなリスク計算 - 証拠金に対する割合(%)でロットを自動計算 視覚的な管理 - すべてのポジションレベルをチャート上に直接表示 4つのスタイリッシュなテーマ - サイバーパンクからマトリックスまで 主な機能 取引パネル: ワンクリックでBUY/SELLポジションを発注 ロット、SL、TPの迅速な設定 クイック選択ボタン (0.01 - 1.00 ロット) プリセットSL/TPレベル (25, 50, 100, 200 ポイント) 全ポジション決済 / 利益のあるポジションのみ決済 省スペ
フィルタ:
Findolin
1419
Findolin 2025.09.08 16:47 
 

ユーザーは評価に対して何もコメントを残しませんでした

Stepan Sinic
1242
開発者からの返信 Stepan Sinic 2025.09.08 17:28
Hello 👋 Thank you for your feedback!
Spark690
231
Spark690 2025.09.08 12:13 
 

ユーザーは評価に対して何もコメントを残しませんでした

Stepan Sinic
1242
開発者からの返信 Stepan Sinic 2025.09.08 12:15
Благодарим за ваш отзыв !
Aleksandr Bobrov
121
Aleksandr Bobrov 2025.09.08 10:31 
 

ユーザーは評価に対して何もコメントを残しませんでした

Stepan Sinic
1242
開発者からの返信 Stepan Sinic 2025.09.08 10:32
Good Morning ! Thank you for your feedback!
レビューに返信