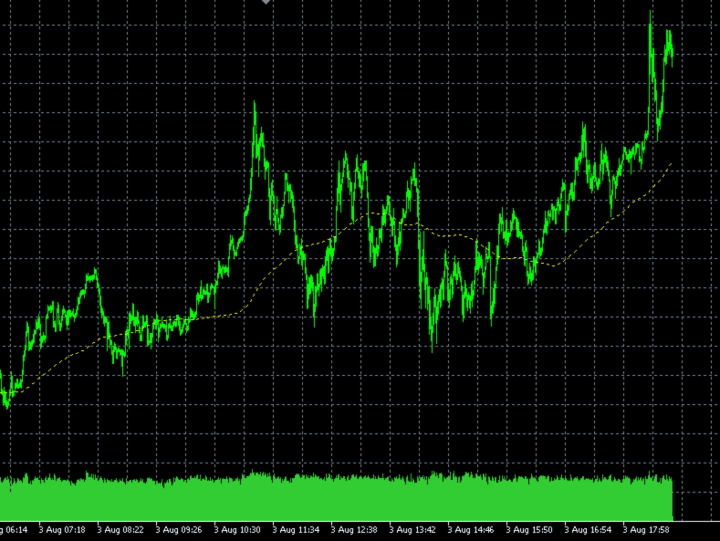
VWMA ProV01 Volume Weighted MA
- インディケータ
- Tahir Mehmood
- バージョン: 1.0
- アクティベーション: 7
📈 正確なトレンドライン
ボリュームに基づいた価格を正確に追跡
🔄 市場の変化に敏感
リアルな価格変動にダイナミックに対応
⚡ スキャルピング & スイング対応
M1スキャルやH4スイングに最適
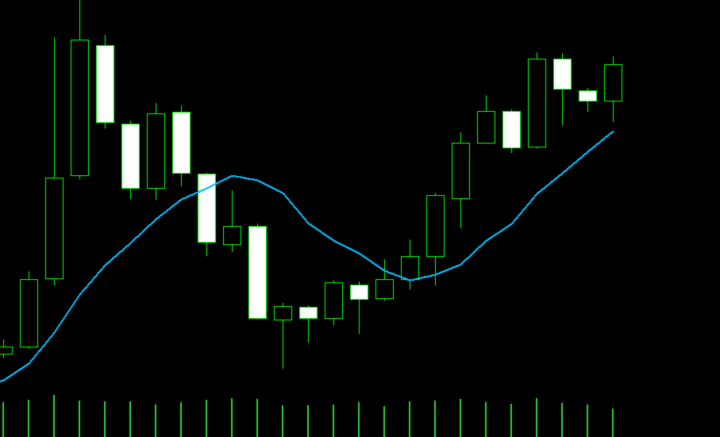
🧠 スマートスムージングロジック
ラグなし、リペイントなし、遅延なし
⏱️ すべての時間足・資産に対応
M1からD1まで、すべてのチャートで動作
📊 ボリュームロジックに基づく
実際の取引量を利用した計算
🧩 ワンステップインストール
Indicatorsフォルダにコピーするだけ
🪶 軽量&高速
CPU使用量が少なく、複数チャートでも快適
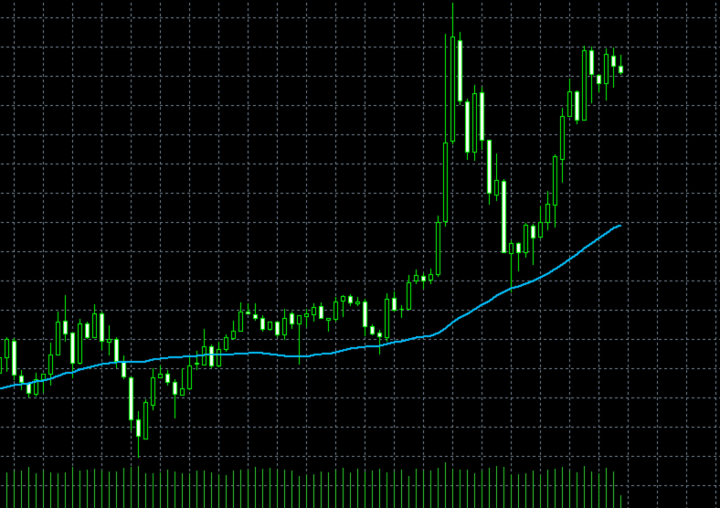
🚀 ラグのないトレンド検出
EMAのような遅れはなし — リアルタイムで追従
🧭 明確なトレンド方向
すぐに読み取れるシンプルなライン
🎓 プロフェッショナルな精度
クリーンなコード、精密なアルゴリズム
🎯 スマートエントリーフィルター
エントリー確認に最適
🛡️ 偽ブレイクへの耐性
ダマシを避けるサポート
🧱 サポート&レジスタンス分析対応
ゾーンやレベルとの併用に最適
⚙️ カスタマイズ可能な入力
期間や色を自由に調整可能
💨 ライブチャートでも高反応
急激な相場変動にも対応
👶 初心者でも簡単
設定不要で即使用可能
♻️ リペイントなし保証
表示されたものはそのまま維持
🔄 リアルタイム更新
価格やボリュームの変化に即時反応
🌐 複数シンボル対応
FX、株価指数、暗号資産、金などで使用可能
EAとの互換性あり
自動売買システムにも対応
🖱️ ワンクリックアクティベーション
デフォルトで5回のアクティベーション付き
💻 最適化されたパフォーマンス
リソース使用を最小限に抑えた設計
🏆 ゴールド対応 (XAUUSD)
金のM1/M5スキャルで実績あり
🔀 RSIやEMAと相性抜群
複数インジケーターとの併用可
📐 トレンド戦略対応
戦略の中核を担う指標
💥 ブレイクアウト確認
パターンや水準突破を検証
🔎 プルバックの認識
押し目や戻りの領域を特定
🔒 すべての市場で信頼性高
レンジ・トレンドどちらでも活躍