Trend Monitor MT5
- インディケータ
- バージョン: 1.52
- アップデート済み: 17 11月 2021
- アクティベーション: 10

The indicator generates early signals basing on ADX reading data combined with elements of price patterns.
Works on all symbols and timeframes.
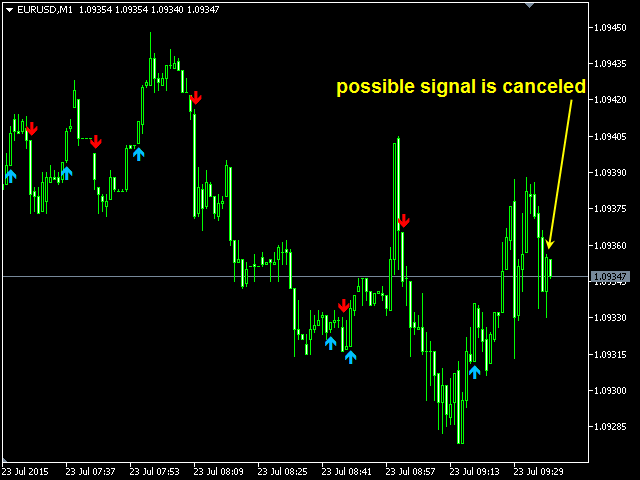
The indicator does not redraw its signals. You see the same things on history and in real time.
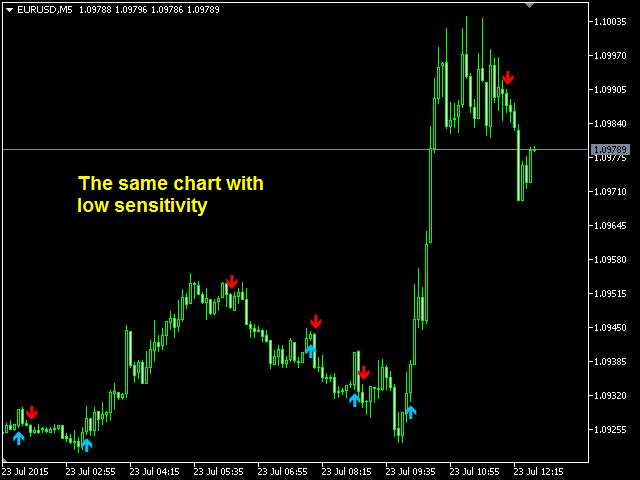
For better visual perception signals are displayed as arrows (in order not to overload the chart).
Features
- The best results are obtained when the indicator works on two timeframes. For example: M30 – the indicator shows the main trend; M5 – the indicator generates signals of entry in trend direction determined on M30.
- It is recommended to use the indicator during session movements to reduce the likelihood of falling into flat.
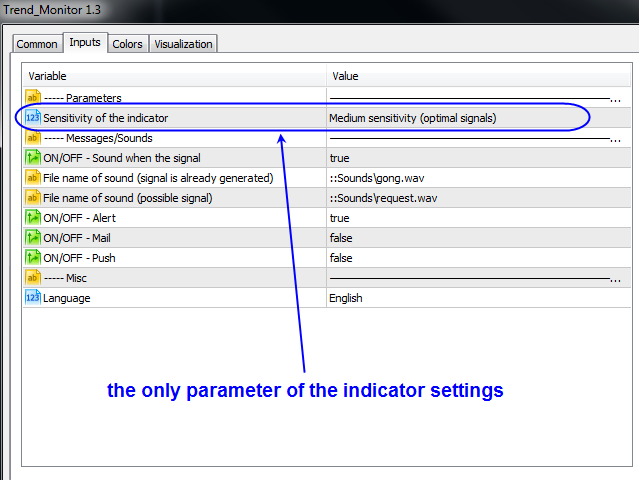
- Easy to use. Filter configuration only requires selection of sensitivity in the "Sensitivity of the indicator" input.
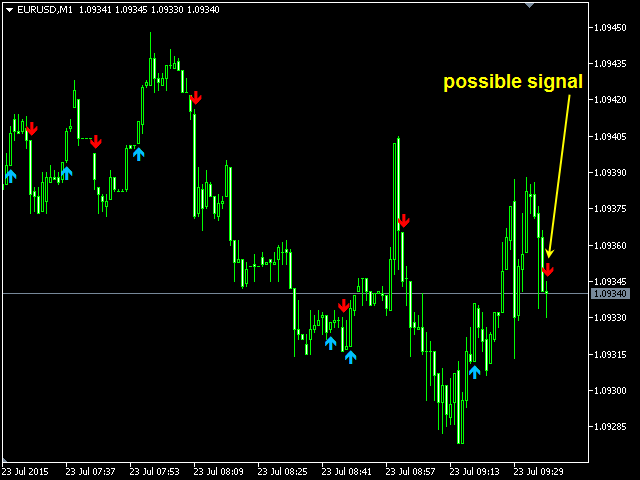
- The signal is given not only when the bar is closed (formed signal), but also on the current bar which is not closed yet (probable signal).
- The indicator sends emails and push notifications to mobile devices.
You can test the functionality of the program by downloading the test version from the Comments tab
Parameters
----- Parameters ----- (The basic indicator parameters)
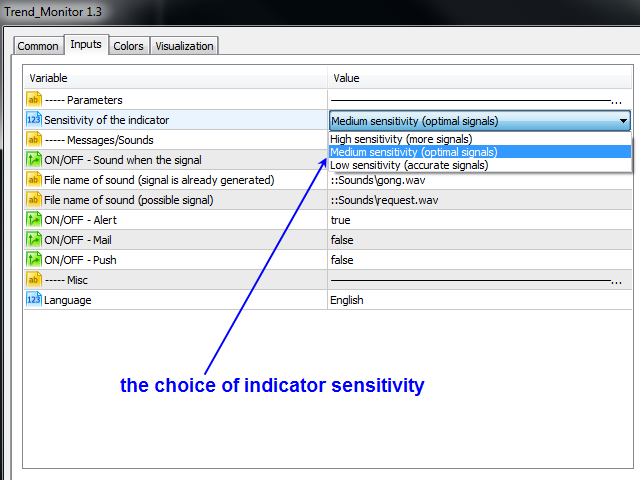
- Sensitivity of the indicator. Can have the following values:
- High sensitivity (more signals) - good for higher timeframes (H4, D1 and higher).
- Medium sensitivity (optimal signals) - best parameters for M5-H1.
- Low sensitivity (accurate signals) - for M1, M5.
- Enable the possible signal (on the current bar) - enable/disable signal on the current incomplete bar (probability signal).
- Use signal filter by Moving Average - filter signals using the Moving Average (Disable - no filter, Enable - use filter, Enable and Show filter - use filter and display the MA).
- Period of Moving Average - the period of the Moving Average used as a filter.
- The averaging Method - the averaging method of the Moving Average used as a filter.
----- Direction of the trend (an arrow in upper right corner) ----- (Color settings of trend direction)
- ON/OFF-Draw the arrow of the trend - show/hide a trend arrow in the upper right corner.
- Color of Up-trend - the color of the signal arrow for the bullish trend.
- Color of Down-trend - the color of the signal arrow for the bearish trend.
----- Messages/Sounds ----- (Notifications and sound settings)
- ON/OFF - Sound when the signal - enable/disable sound alert
- File name of sound (signal is already generated) - name of the sound file played on already formed signal (close bar)
- File name of sound (possible signal) - name of the sound file played on probable signal (current bar)
- ON/OFF - Alert - enable/disable in the terminal when signals emerge.
- ON/OFF - Mail - sending emails.
- ON/OFF - Push - sending push notifications to mobile devices.
----- Misc ----- (Other settings)
- Language – language of messages (English or Russian).
You can test the indicator's demo version here


Ich finde ,die besten Signale kommen im H4 und D1, den Moving Average (drunter/drüber) beachten. Man kann mit dem Indikator gut und lange handeln.