Atlantis Pro

  • Indicadores
  • Mohammed Jebbar
    Mohammed Jebbar
    A 3Algos é uma empresa fintech inovadora, especializada em soluções avançadas de trading algorítmico para as plataformas MetaTrader. Nós capacitamos traders de todos os níveis com ferramentas, indicadores e robôs (Expert Advisors) de ponta, projetados para automatizar decisões de trading e maximizar
  • Versão: 2.7
  • Atualizado: 6 julho 2025
  • Ativações: 5

Atlantis Pro Indicator — Análise Precisa Tick a Tick com Força de Carteira

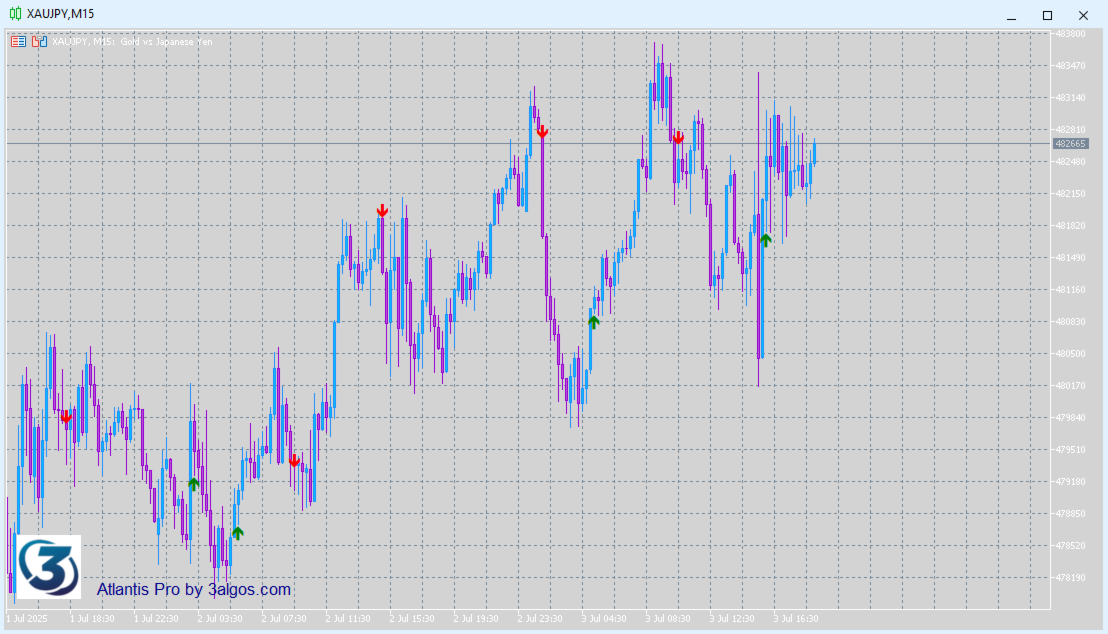
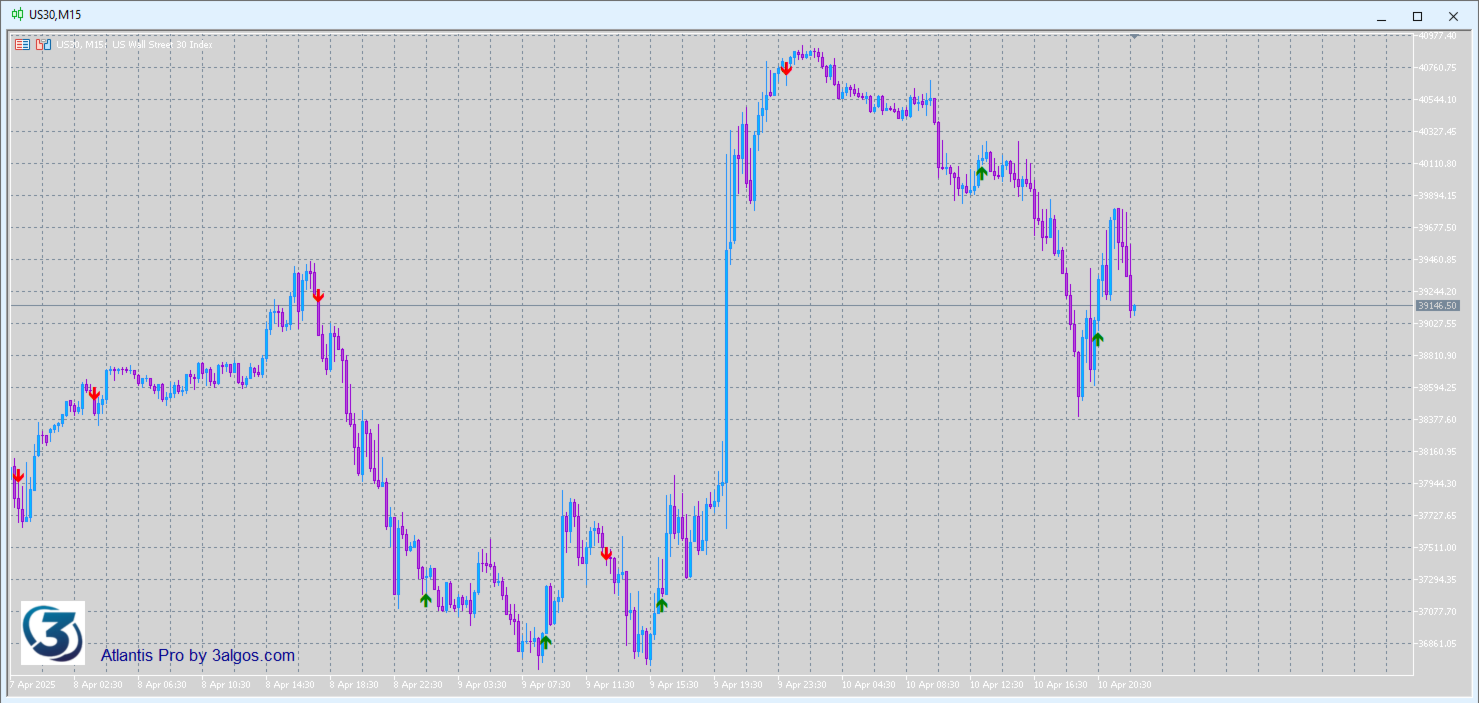
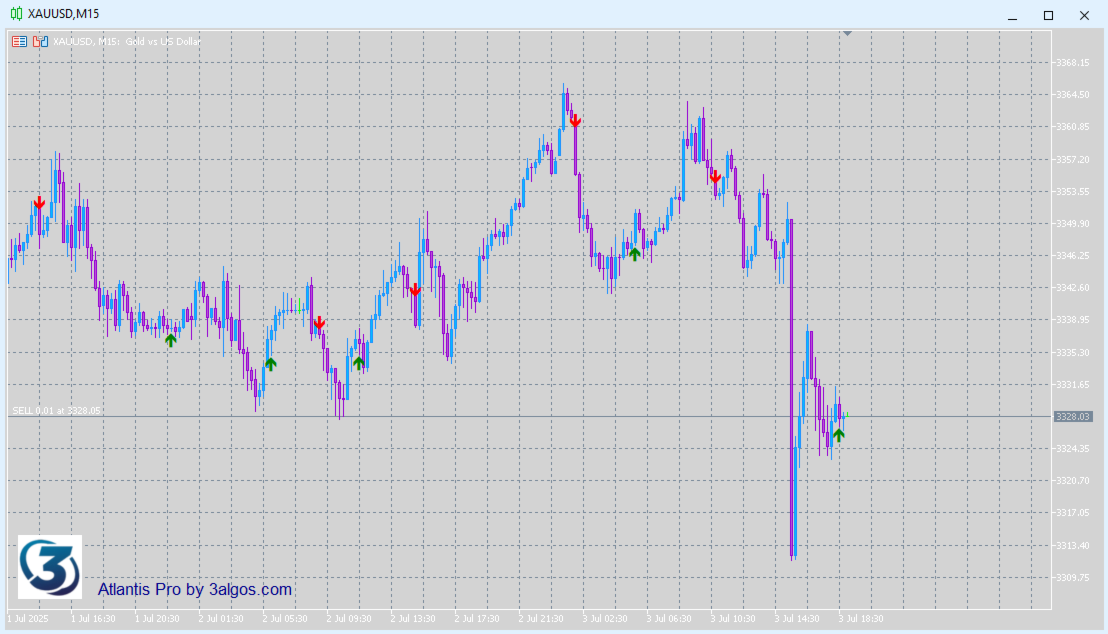
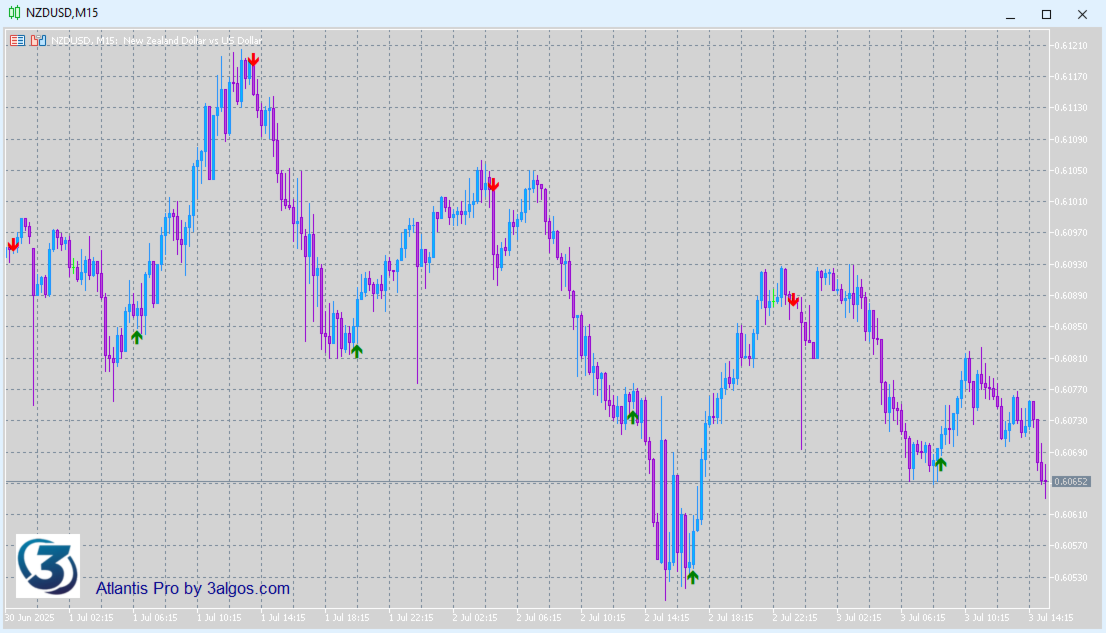
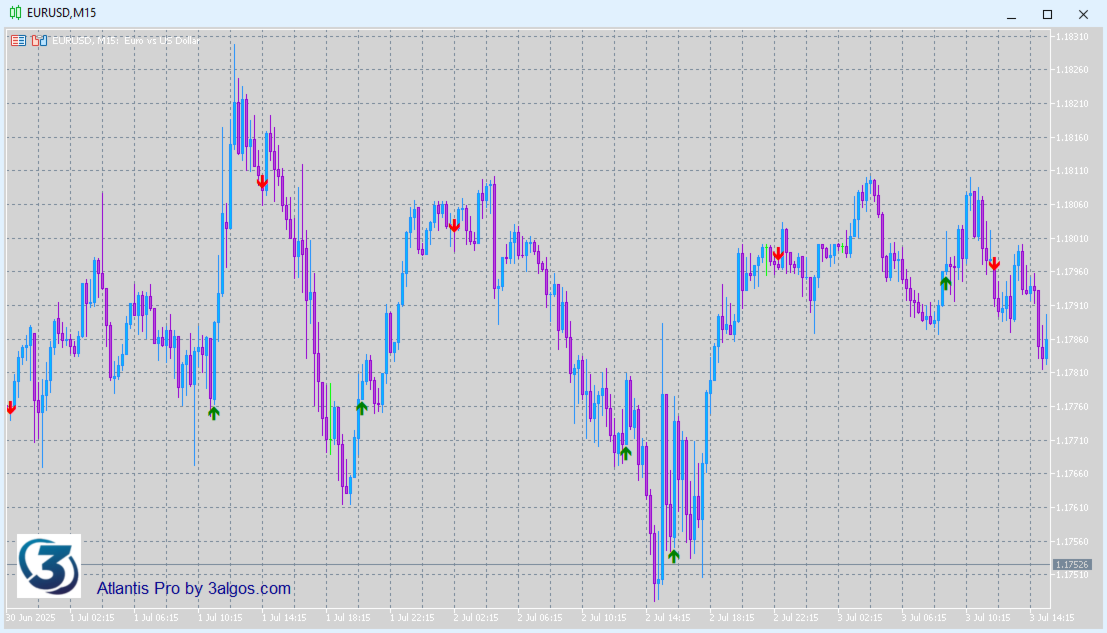
O Atlantis Pro Indicator é uma ferramenta avançada e versátil que aproveita dados tick a tick em tempo real para detectar níveis de preço críticos e zonas de reversão de alta probabilidade com precisão impressionante. Ao analisar cada tick do mercado, o Atlantis Pro identifica mudanças cruciais na pressão de compra e venda, exibindo setas claras de Compra e Venda diretamente no gráfico — visíveis por padrão para agir de imediato.

Projetado para máxima flexibilidade, o Atlantis Pro funciona perfeitamente em qualquer timeframe e em qualquer ativo, incluindo Forex, ações, commodities, índices e criptomoedas. Seu verdadeiro diferencial aparece quando utilizado em múltiplos símbolos ao mesmo tempo: o trader pode monitorar e receber os melhores sinais de entrada e saída em diversos instrumentos simultaneamente, construindo uma abordagem de carteira diversificada que ajuda a reduzir riscos e a aumentar a consistência dos lucros.

Com o Atlantis Pro, você não fica limitado a um único gráfico ou ativo — amplie seu potencial capturando sinais em mercados correlacionados ou não correlacionados, permitindo hedge natural e suavizando oscilações de lucro. Essa capacidade multiativo permite conquistar ganhos mais estáveis e consistentes, mesmo em mercados voláteis.

Ideal para scalpers, swing traders ou investidores de longo prazo, o Atlantis Pro oferece sinais claros e acionáveis em tempo real, fortalecendo sua confiança e precisão na execução das operações.

Principais recursos:
✔️ Processamento de dados tick a tick para sinais ultra precisos
✔️ Setas de Compra/Venda visíveis por padrão
✔️ Funciona em qualquer timeframe e ativo
✔️ Monitoração multiativo para operações de carteira
✔️ Hedge natural entre mercados, lucros mais consistentes
✔️ Sinais claros e diretos no gráfico, sem configuração complexa

Liberte todo o poder da análise tick a tick com uma estratégia de carteira inteligente — evolua seu trading hoje com Atlantis Pro Indicator.
Produtos recomendados
A Master Edition é uma ferramenta analítica de nível profissional projetada para visualizar a estrutura do mercado através da lente do volume e do fluxo de dinheiro. Ao contrário dos indicadores de volume padrão, esta ferramenta exibe um Perfil de Volume Diário diretamente no seu gráfico, permitindo ver exatamente onde a descoberta de preços ocorreu e onde o "dinheiro inteligente" está posicionado. Esta Master Edition é projetada para clareza e velocidade, apresentando um sistema único de Auto-T
VOLUME PROFILE SAF-XII Análise de Perfil de Mercado Profissional para MT5 (O indicador dos sonhos para traders de Grade/Grid) O QUE É O PERFIL DE VOLUME (VOLUME PROFILE)? O Perfil de Volume é uma ferramenta institucional profissional que exibe a atividade de negociação em níveis de preços específicos, ao contrário dos indicadores de volume tradicionais que mostram o volume ao longo do tempo. Ele revela ONDE a negociação ocorreu dentro da janela de sua escolha, ajudando a identificar: ÁREAS DE V
BoxChart MT5
Evgeny Shevtsov
5 (7)
The market is unfair if only because 10% of participants manage 90% of funds. An ordinary trader has slim changes to stand against these "vultures". This problem can be solved. You just need to be among these 10%, learn to predict their intentions and move with them. Volume is the only preemptive factor that faultlessly works on any timeframe and symbol. First, the volume appears and is accumulated, and only then the price moves. The price moves from one volume to another. Areas of volume accumu
O indicador cria cotações atuais, que podem ser comparadas com as históricas e, com base nisso, fazer uma previsão do movimento dos preços. O indicador possui um campo de texto para navegação rápida até a data desejada. Opções: Símbolo - seleção do símbolo que o indicador exibirá; SymbolPeriod - seleção do período do qual o indicador coletará dados; IndicatorColor - cor do indicador; HorisontalShift - deslocamento das cotações desenhadas pelo indicador pelo número especificado de barras; I
Symbol: EURUSD Timeframe: 30 minutes (M30) For other symbols or timeframes, adjust the settings to match the market. Volume Profile POC Breakout builds a volume profile from recent candles, finds the Point of Control (POC) and marks clean breakouts of that level. Each breakout is shown as a complete trade plan with entry, stop loss and three take profit levels, filtered by the higher timeframe trend and rated by a quality score. The indicator does not open trades. It is a visual and analysis to
Was: $249  Now: $99   Market Profile defines a number of day types that can help the trader to determine market behaviour. A key feature is the Value Area, representing the range of price action where 70% of trading took place. Understanding the Value Area can give traders valuable insight into market direction and establish the higher odds trade. It is an excellent addition to any system you may be using. Inspired by Jim Dalton’s book “Mind Over Markets”, this indicator is designed to suit the
Smart SMC FVG
Ekkasawat Pitichalermroch
SMC + Volume Profile + FVG: Indicator Guide Overview SMC + Volume Profile + FVG is an all-in-one indicator for MetaTrader 5. It combines three popular price-action tools on a single chart: Smart Money Concepts (SMC): market structure (swings, BOS, CHoCH) and Order Blocks Fair Value Gaps (FVG): price imbalances left behind by fast moves Volume Profile: where the most trading happened, shown as POC, Value Area High and Value Area Low Everything is drawn automatically. You can turn each part on or
LevelsHunter Pro
Dmitrii Kovalevskii
LevelsHunter Pro – Perfil de Volume Profissional com Análise Histórica O que é LevelsHunter Pro é um indicador de perfil de volume que não só mostra os níveis atuais POC, VAH e VAL, mas também permite   voltar no tempo   e ver onde esses níveis estavam no momento de qualquer negociação passada. Esta não é uma ferramenta para adivinhar no gráfico. É para a   análise fria   do que já aconteceu. Por que um trader precisa disso O problema:   A maioria dos indicadores mostra apenas «aqui e agora». Vo
English Version Unlock the Power of Volume with Next-Generation Volume Profile This advanced Volume Profile indicator transforms your MetaTrader 5 chart into a powerful volume analysis tool. Unlike standard volume indicators that only show volume over time, this tool displays volume distribution across   price levels , allowing you to pinpoint exactly where the "big money" is trading. Why choose this indicator? Dynamic Price Bins:   Set your own precision (number of rows) to view volume clust
Spike Blast Pro
Israr Hussain Shah
Here   our more valuable tools SMC Trend Trading   ,  Easy SMC Trading  ,  Institutional SMC Architect Volume Analysis Tools  ,  Volume flow Profile  ,  Market volume profile  , FVG with Volume  , Liquidity Heatmap Profile  ,  Volume Spread Analysis Spike Blaster Pro is a next-generation MT5 indicator designed specifically for synthetic markets. It works seamlessly on Boom Index and Weltrade Index , providing traders with sharp, reliable spike detection signals. What makes Spike Blaster Pro po
The "MR Volume Profile 5" indicator is a charting tool that displays trading volume at different price levels rather than time intervals. A key concept in volume profile is the point of control (POC)—the price level with the highest volume traded during the session or time range. While tools like VWAP or OBV provide volume trends, the "MR Volume Profile 5" indicator offers granular detail about where the most market activity occurs at specific price levels. This makes it a more precise tool for
Volume Profile Multiple — Perfis de Volume Múltiplos com Buffers para Trading Algorítmico Cansado de desenhar o Volume Profile bloco por bloco, tendo que redesenhar e recalcular tudo sempre que muda de timeframe? O Volume Profile Multiple desenha automaticamente vários perfis de volume consecutivos no gráfico, revelando onde o interesse institucional realmente esteve em cada trecho do mercado — e não apenas no último intervalo visível. O que o indicador faz por você O indicador divide o históric
Boom Crash SMC
Israr Hussain Shah
Here   our more valuable tools SMC Trend Trading   ,  Easy SMC Trading  ,  Institutional SMC Architect Volume Analysis Tools  ,  Volume flow Profile  ,  Market volume profile  , FVG with Volume  , Liquidity Heatmap Profile  ,  Volume Spread Analysis Deriv boom and crash index spike killer system you can use it only on m5 timeframe  follow the structure and get signal with alert on phone open trade set sl tp and enjoy easy analysis and trading made simple 
Blahtech Supply Demand MT5
Blahtech Limited
4.57 (14)
Was: $299  Now: $99  Supply Demand uses previous price action to identify potential imbalances between buyers and sellers. The key is to identify the better odds zones, not just the untouched ones. Blahtech Supply Demand indicator delivers functionality previously unavailable on any trading platform. This 4-in-1 indicator not only highlights the higher probability zones using a multi-criteria strength engine, but also combines it with multi-timeframe trend analysis, previously confirmed swings a
Daily & Composite Volume Profile   This is a professional-grade market profile tool designed for MetaTrader 5. It utilizes a   Dual-Profile System   to visualize supply, demand, and liquidity concentrations. Key Features Left Side: Daily Session Profiles Automatically identifies the start and end of every trading day. Generates a unique Volume Profile for each individual day. Allows you to see how value migrated from yesterday to today (e.g., Is today's volume higher or lower than yesterday?).
Here   our more valuable tools SMC Trend Trading   ,  Easy SMC Trading  ,  Institutional SMC Architect Volume Analysis Tools  ,  Volume flow Profile  ,  Market volume profile  , FVG with Volume  , Liquidity Heatmap Profile  ,  Volume Spread Analysis The    Liquidity Heatmap   is a sophisticated institutional trading tool designed to reveal where over-leveraged traders are trapped. By calculating estimated liquidation levels based on volume spikes and leverage, this indicator draws a dynamic "h
Brief Description The Balance Curve Dashboard is a sophisticated visual tool that transforms your trading history into an interactive, high-performance equity curve display directly on your MT5 chart. Unlike traditional balance lines that draw on the chart as standard objects, this indicator uses a custom Canvas-based rendering engine to create a crisp, anti-aliased, and fully customizable visual representation of your portfolio's performance. Key Features: Interactive Visual Dashboard · Ful
Volume Profile Canvas - Professional Volume Profile Indicator for MetaTrader 5 DESCRIPTION Volume Profile Canvas is a professional volume profile indicator for MetaTrader 5 that renders directly on the chart using a high-performance Canvas engine. It calculates and displays the volume distribution across price levels, identifying the Point of Control (POC), Value Area High (VAH) and Value Area Low (VAL) in real time. This is a pure analysis tool. It does not trade. It gives you an instant vi
O Volume Profile é uma das ferramentas analíticas mais poderosas usadas por traders profissionais e institucionais. Ao contrário dos indicadores de volume tradicionais, que mostram apenas quando as negociações ocorreram na parte inferior da sua tela, o Volume Profile mostra exatamente em quais níveis de preço essas negociações aconteceram. Isso oferece uma visão de raio-X clara da estrutura do mercado, permitindo que você veja exatamente onde o dinheiro inteligente (smart money) e as instituiçõe
AVISO IMPORTANTE – LICENÇA E ATIVAÇÃO OBRIGATÓRIAS =================================================== Instruções de ativação: Após concluir sua compra, entre em contato conosco imediatamente para receber sua chave de licença, senha ou dados de ativação. Sem eles, o software não funcionará. Estamos aqui para garantir um processo de ativação tranquilo e ajudá-lo com qualquer dúvida. --- Volume Delta Profile V2 Enhanced ================================ Ferramenta Profissional de Análise
Poc volume honeyflow
Ali Abdalrasool Ai-sayyd Sobai
POC Highlighter - Volume Profile Indicator This indicator displays the Volume Profile and clearly marks the Point of Control (POC) with a prominent yellow horizontal line. The POC represents the price level with the highest traded volume within the visible chart range or selected period. Key Features: - Automatic calculation and display of Volume Profile histogram at the right side of the chart. - Highlights the POC level with a customizable yellow line (default: solid yellow). - Adjustable p
PivotWave
Jeffrey Quiatchon
Introducing PivotWave – your ultimate trading companion that redefines precision and market analysis. Designed with traders in mind, PivotWave is more than just an indicator; it’s a powerful tool that captures the pulse of the market, identifying key turning points and trends with pinpoint accuracy. PivotWave leverages advanced algorithms to provide clear visual signals for optimal entry and exit points, making it easier for traders to navigate volatile market conditions. Whether you are a begin
This Volume Delta Profile is an advanced MetaTrader 5 indicator that visualizes   volume delta (order flow imbalance)   using a volume profile-style histogram. It shows the difference between buying and selling pressure at specific price levels, helping traders identify supply and demand zones. This indicator provides a unique perspective on market dynamics by visualizing the imbalance between buying and selling pressure, offering insights beyond traditional volume analysis. Core Concept Positiv
VibeFox Volume Profile — Volume Profile para MetaTrader 5 VibeFox Volume Profile é um conjunto completo de ferramentas de Volume Profile para MetaTrader 5. Ele constrói a distribuição horizontal do volume negociado ao longo do preço, para que você veja instantaneamente onde o mercado concentrou mais atividade, onde negociou pouco e quais níveis de preço provavelmente agirão como ímãs ou barreiras. Cada perfil é desenhado diretamente no gráfico e controlado a partir de um painel moderno e operado
Volume Profile For MT5
Abdelkhabir Yassine Alaoui
Perfil de Volume VPVR para MT5 O Perfil de Volume VPVR é um indicador poderoso e de alto desempenho para MetaTrader 5, projetado para replicar o Perfil de Volume (Faixa Visível) avançado diretamente no seu gráfico. Ele fornece uma visão profunda da estrutura do mercado, visualizando onde a atividade de negociação está concentrada, ajudando os traders a identificar níveis de preço importantes com precisão. Este indicador analisa dinamicamente a distribuição do volume entre os níveis de preço e
TradeAQ
Guo Sheng Zhao
LuoMo Volume & Price Structure 8.98 A multi-function chart indicator for   MetaTrader 4 and MetaTrader 5 , designed to display key volume, volatility, sentiment, and price-structure information directly on the main chart. Main Features Volume and price-based Support & Resistance Volume spike and exhaustion signals ATR volatility expansion alerts Volume Profile with HVN and LVN Bullish and bearish sentiment distribution Developing or fixed POC VAH and VAL levels Supply and Demand zones Volume-wei
Adaptive Volume Profile desenha o Perfil de Volume das últimas barras diretamente no gráfico: o Point of Control (POC), a Value Area (VAH / VAL), os nós de volume alto (HVN), os nós de volume baixo (LVN) e um histograma de volume opcional. O tamanho das linhas de preço adapta-se à volatilidade atual (ATR), por isso o perfil permanece legível em qualquer símbolo e período. Recursos POC - o nível de preço com o maior volume negociado na janela Value Area (VAH / VAL) - a faixa de preço que contém a
FREE
Swing Volume Profile MT5 Swing Volume Profile Indicator — Auto Swing Detection, Volume Profile, Fibonacci Retracement & RSI Overlay in One Chart Tool Swing Volume Profile (SVP) automatically detects structural swings and displays a volume profile for the most recent completed swing — with Fibonacci retracement and RSI overlay. No manual range selection. No trendline required. The indicator finds the swings and builds the profile automatically. MT5 Native • No Repainting • Auto Swing Detection •
Here   our more valuable tools SMC Trend Trading   ,  Easy SMC Trading  ,  Institutional SMC Architect Volume Analysis Tools  ,  Volume flow Profile  ,  Market volume profile  , FVG with Volume  , Liquidity Heatmap Profile  ,  Volume Spread Analysis 1. Institutional Supply & Demand Zones Auto-Detection:   Automatically draws zones at valid pivot points. Smart Extension:   Zones extend into the future for easy visibility but automatically cut off when price breaks them. Mitigation Logic:   When
Here   our more valuable tools SMC Trend Trading   ,  Easy SMC Trading  ,  Institutional SMC Architect Volume Analysis Tools  ,  Volume flow Profile  ,  Market volume profile  , FVG with Volume  , Liquidity Heatmap Profile  ,  Volume Spread Analysis Boom: Take SELL signals only (price spikes up then crashes) Crash: Take BUY signals only (price drops then spikes up) SL goes beyond the line as labeled Interactive Market Watch Panel : A left-side sidebar showing real-time strength indicators (po
Os compradores deste produto também adquirem
Boba Analysis Suite
Trade Ready Solutions LLC
5 (1)
Boba Analysis Suite O Boba Analysis Suite é um indicador de análise para o MetaTrader 5. Reúne a estrutura do mercado, as zonas de preço relevantes e o contexto geral do mercado numa única visualização do gráfico. Desenvolvido a partir da experiência prática como trader e formador de traders, apoia um processo de análise estruturado: avaliar a direção do mercado, identificar níveis importantes e analisar vários períodos gráficos em conjunto. Análise em contexto O significado de cada sinal depend
ARIPoint
Temirlan Kdyrkhan
1 (4)
ARIPoint is a powerful trading companion designed to generate high-probability entry signals with dynamic TP/SL/DP levels based on volatility. Built-in performance tracking shows win/loss stats, PP1/PP2 hits, and success rates all updated live. Key Features: Buy/Sell signals with adaptive volatility bands Real-time TP/SL/DP levels based on ATR Built-in MA Filter with optional ATR/StdDev volatility Performance stats panel (Success, Profit/Loss, PP1/PP2) Alerts via popup, sound, push, or email Cu
O UZFX {SSS} Scalping Smart Signals v5.0 MT5 é um indicador de negociação de alto desempenho, sem repintura, concebido para scalpers, day traders e swing traders que exigem sinais precisos e em tempo real em mercados em rápida evolução. Desenvolvido pela (UZFX-LABS), este indicador combina a análise da ação do preço, a confirmação de tendências e a filtragem inteligente para gerar sinais de compra e venda de alta probabilidade, sinais de alerta e oportunidades de continuação de tendências em tod
AriFocus
Temirlan Kdyrkhan
AriFocus - Non-Repainting Buy/Sell Signals AriFocus - one clear signal. AriFocus marks buy and sell signals directly on the chart and suggests a stop-loss level for each one. Every signal is confirmed on bar close and never repaints. - Buy/sell arrows, confirmed on bar close - Suggested stop-loss level for every signal - Trend band and candle coloring to show direction at a glance - 10 ready-made presets, or your own settings (14 calculation methods) - Pop-up, push and email alerts with entr
Azimuth Pro
Ottaviano De Cicco
5 (7)
Azimuth Pro V2: Estrutura Fractal Sintética e Entradas Confirmadas para MT5 Visão geral Azimuth Pro é um indicador de estrutura swing multinível da Merkava Labs . Quatro camadas de swing aninhadas, VWAP ancorado em swings, detecção de padrões ABC, filtragem estrutural de três timeframes e entradas confirmadas em barra fechada — um gráfico, um fluxo de trabalho dos micro-swings aos macro-ciclos. Este não é um produto de sinais cegos. É um fluxo de trabalho baseado em estrutura para traders que v
OrderFlow Absorption – Indicador Profissional de Delta e Sinais de Absorção para MT5 Desbloqueie o poder da verdadeira análise de fluxo de ordens com o OrderFlow Absorption – o indicador definitivo de histograma de delta e sinais de absorção para MetaTrader 5. Desenvolvido para traders que desejam enxergar o que realmente acontece por trás de cada movimento de preço, esta ferramenta revela pressões ocultas de compra/venda e eventos de absorção que movimentam o mercado. Recursos Visualização do H
ARICoins
Temirlan Kdyrkhan
ARICoin is a powerful trading companion designed to generate high-probability entry signals with dynamic TP/SL/DP levels based on volatility. Built-in performance tracking shows win/loss stats, PP1/PP2 hits, and success rates all updated live. Key Features: Buy/Sell signals with adaptive volatility bands Real-time TP/SL/DP levels based on ATR Built-in MA Filter with optional ATR/StdDev volatility Performance stats panel (Success, Profit/Loss, PP1/PP2) Alerts via popup, sound, push, or email Cust
Gem SIGNAL
Shengzu Zhong
5 (1)
GEM Signal Pro GEM Signal Pro é um indicador seguidor de tendência para MetaTrader 5, desenvolvido para traders que desejam sinais mais claros, setups mais estruturados e uma gestão de risco mais prática diretamente no gráfico. Em vez de mostrar apenas uma seta simples, o GEM Signal Pro ajuda a apresentar a ideia completa da operação de forma mais clara e fácil de entender. Quando as condições são confirmadas, o indicador pode mostrar o preço de entrada, o stop loss e os alvos de take profit no
Chimera Volume
Marko Milenkovic
Chimera Volume para MetaTrader 5 Análise avançada de volume e visualização da atividade de mercado O Chimera Volume é um indicador personalizado para MetaTrader 5, concebido para analisar a atividade do volume normalizado e apresentar as mudanças na participação de mercado através de um quadro visual dinâmico. O indicador processa dados de volume de ticks utilizando algoritmos de normalização adaptativa e gera uma representação estruturada da intensidade do volume, das fases de acumulação e das
Meravith Scanner
Ivan Stefanov
5 (3)
O MERAVITH SCANNER é um indicador profissional de mercados financeiros para MetaTrader 5 que consolida várias ferramentas analíticas em um único sistema integrado. Ele realiza todos os cálculos automaticamente usando uma metodologia proprietária de preço médio ponderado por volume (VWAP), eliminando completamente a interpretação subjetiva. O indicador funciona em todas as classes de ativos (Forex, Ações, Índices, Commodities, Criptomoedas) e em todos os prazos, de M1 a Mensal. O princípio fundam
TrendMaestro5
Stefano Frisetti
note: this indicator is for METATRADER4, if you want the version for METATRADER5 this is the link:  https://www.mql5.com/it/market/product/108106 TRENDMAESTRO ver 2.5 TRENDMAESTRO recognizes a new TREND from the start, he never makes mistakes. The certainty of identifying a new TREND is priceless. DESCRIPTION TRENDMAESTRO identifies a new TREND in the bud, this indicator examines the volatility, volumes and momentum to identify the moment in which there is an explosion of one or more of these da
Meravith MT5
Ivan Stefanov
5 (3)
MERAVITH é um indicador multitemporal de volume e liquidez para MetaTrader 5 que mostra a tendência, as zonas de suporte e resistência, a entrada, os alvos e o stop loss em cada tempo gráfico. Ele dá a você um mapa completo da liquidez do mercado, uma ferramenta de liquidez no estilo dos hedge funds, e faz todos os cálculos automaticamente com um método próprio de preço médio ponderado por volume, portanto não há interpretação subjetiva. Funciona em Forex, ouro (XAUUSD), índices e cripto, em tod
Cycles Plotter
Edoardo Centorame
Cycles Plotter Indicador de Ciclos Personalizáveis com Médias Móveis e Data de Início O Cycles Plotter é um indicador técnico avançado que traça dois ciclos sinusoidais completamente personalizáveis, somente mediante input do usuário. Não gera ciclos automaticamente: todos os ciclos são calculados exclusivamente com base nos parâmetros definidos pelo usuário, oferecendo aos traders uma ferramenta visual para estudar as oscilações de preço e as potenciais mudanças de tendência, sem produzir sinai
AriX
Temirlan Kdyrkhan
1 (4)
AriX Indicator for MT5 A powerful trend-following and signal-evaluation tool AriX is a custom MT5 indicator that combines Moving Averages and ATR-based risk/reward logic to generate clear buy/sell signals. It visualizes dynamic SL/TP levels, evaluates past trade outcomes, and displays win/loss statistics in a clean on-chart panel. Key features include: Buy/Sell signals based on MA crossovers ATR-based SL/TP1/TP2/TP3 levels with visual lines and labels Signal outcome tracking with real-time stat
Veja o que o mercado está realmente fazendo.      Acompanhe as 3 fases do mercado ao vivo à sua frente (Contração, Expansão, Tendência) e faça entradas melhores no início da fase   de Tendência.      Pare de adivinhar. Comece a ler o mercado como fazem as instituições e o smart money.   Apex Market Structure Pro para MT5 é uma ferramenta de análise smart-money de precisão que elimina o ruído e mostra a verdadeira   estrutura sob cada vela: liquidez, mudanças de estrutura, zonas de acumulação e
Title:FX-AIEA Supply and Demand Zone Indicator (MT5) — Technical Overview Version: 2.51 | Platform: MetaTrader 5 Introduction Supply and demand zones are considered a core manifestation of institutional order flow, providing a more direct reflection of buying and selling pressure than traditional support/resistance levels. This indicator attempts to automate the identification of high-probability supply and demand zones using an adaptive ZigZag algorithm, reducing the subjectivity and time asso
ORB Seeker MT5
Marcela Goncalves De Oliveira
Preço especial para limitar a disponibilidade e manter a escassez do produto! Apenas $599! Após a compra, entre em contato comigo para receber o EA ORB Seeker bônus e os arquivos de configuração otimizados personalizados. Faça sessões de tratamento eficazes com confiança! O ORB Seeker MT5 é um indicador profissional de Ruptura da Faixa de Abertura (ORB) desenvolvido para traders que buscam precisão, simplicidade, flexibilidade e uma estrutura de gráfico clara. Ele traça automaticamente a faixa
Volume Arrow Signal Product Description Volume Arrow Signal is a smart trading indicator designed to help traders identify potential buy and sell opportunities using price action, volume behavior, and directional arrow signals. The indicator places clear arrows directly on the chart, making it easy to spot possible market reversals, trend continuations, and entry opportunities without spending hours analyzing charts manually. Whether you are trading Gold (XAUUSD) , Forex pairs, Indices, or Crypt
Gold Xausd Hunter
Metin Erkamoglu
5 (2)
MATADOR GOLD XAUUSD M5 Scalp Signals for MT5 MATADOR GOLD is a decision-support indicator for MetaTrader 5, designed for traders who analyze short-term Gold movement on the M5 timeframe. The indicator does not open, close, or manage trades automatically. It provides buy and sell signal guidance so the user can make their own trading decisions according to their risk plan, broker conditions, and trade management rules. Main purpose MATADOR GOLD is built to help traders avoid noisy signal flow and
Footprint — é um indicador para análise de order flow e volume. Ele ajuda a identificar a estrutura do mercado no nível de clusters, encontrar zonas-chave com alta atividade e trabalhar com filtros diretamente no gráfico, sem a necessidade de abrir constantemente a janela de configurações. Recursos do indicador Footprint gráfico de clusters Bid x Ask, Delta; painel de controle no gráfico; controles deslizantes (sliders) para ajuste de filtros; Absorption; Initiative; Stacked Imbalances; Big Trad
Zain Gold ScalpingV5
Ahmed Gamal Abdel Nasser Mohamed
Zain Gold Scalping V5 is a technical analysis indicator for MetaTrader 5 designed for Forex and Gold markets. It provides chart-based market information, trend analysis, signal conditions, and an on-screen dashboard to help traders analyze price movement across multiple timeframes. Main Features The indicator supports multiple timeframes, including M1, M5, M15, M30, H1 and higher timeframes. It can be used with Gold (XAUUSD), Forex currency pairs, indices and other supported instruments. The in
Quantum Momentum Guard (QMG) Advanced Breakout & Momentum Indicator for MetaTrader 5 Quantum Momentum Guard (QMG) is a next-generation MetaTrader 5 trading indicator designed to identify high-probability breakout opportunities using a powerful combination of advanced momentum analysis and high-level mathematical calculations . Unlike ordinary indicators that generate signals based on a single condition, QMG confirms every breakout with momentum strength and mathematical validation , ensuring
KenKem Master Volume Profiler - Brief Introduction A Display-only volume-profile cockpit for XAUUSD, BTCUSD and other liquid symbols. Draws profile structure, multi-timeframe flow, EMA trend and study-only setup markers. Places no orders. Not a signal service.  It maps where the market has actually traded and reads recent order flow, so you can see structure and lean at a glance.  What it shows: Master and local volume profiles (POC and value-area high/low) - the price shelves that matter. A liv
VTrende Pro
Andrii Diachenko
5 (1)
VTrende Pro - MTF indicator for trend trading with a display panel for MT5 *** Videos can be translated into any language using subtitles (video language - Russian) Although the signals of the VTrende Pro indicator can be used as signals of a full-fledged trading system, it is recommended to use them in conjunction with the Bill Williams TS. VTrende Pro is an extended version of the VTrende indicator. Difference between Pro version and VTrende: - Time zones - Signal V - signal 1-2 waves -    S
First time on MetaTrader, introducing IQ Star Lines, an original Vedic Astrology Based Intraday Trading Indicator. We don't offer free or bonus indicators in exchange of reviews from you. You won't need any free products with this indicator to make it work. ;) Enjoy! Welcome to the new and updated  IQ Star Lines , the ultimate fusion of ancient planetary cycles and modern quantitative trading, published for the first time on Metatrader. This is an indicator built by the developer, who has spent
Navigator Equilibrium: fase do mercado, momentum, picos e divergências em uma única janela Chega de alternar entre um oscilador de momentum, um filtro de tendência, um medidor de volatilidade e um detector de divergências. O Navigator Equilibrium reúne tudo em uma única janela com código de cores, para que você veja de relance se o momentum está ganhando ou perdendo força, quem está no controle, se o mercado está em tendência ou em consolidação, e onde preço e momentum divergem. Foi criado para
Boom & Crash & PainX & GainX Ultimate Spike Detector Trade Spikes With Confidence — Not Guesswork Catching spikes should be one of the most profitable strategies in synthetic markets. But for most traders, it becomes one of the most frustrating. You enter too early… price goes against you. You wait for a spike… it never comes. You finally catch one… but don’t know whether to hold or close. You make profit… then give it all back because there’s no exit plan. This is exactly the problem the Ultim
Historical Similarity Matcher Indicator (HI.SI.MA) Try it free today — demo version now available!   https://www.mql5.com/en/market/product/167114 Overview The Historical Similarity Matcher is a technical analysis indicator for MetaTrader 5. It scans historical price data to find segments that show statistical similarity to a user-selected reference period on the chart.
Em poucas palavras Este indicador combina dois especialistas — o RSI e o MACD — num único sistema. Em vez de você olhar para dois gráficos separados e tentar adivinhar, ele toma a decisão por você: quando ambos os indicadores concordam, ele desenha uma seta (compra ou venda). O mais importante: as setas não são repintadas . Depois que aparece, fica no lugar. Você pode fazer backtesting e operar ao vivo com total confiança. O que significa "Combo" Normalmente, um trader olha para o RSI (que mede
Filtro:
Sem comentários
Responder ao comentário