Direct Scalping
- インディケータ
- バージョン: 1.5
- アップデート済み: 7 4月 2025
- アクティベーション: 5

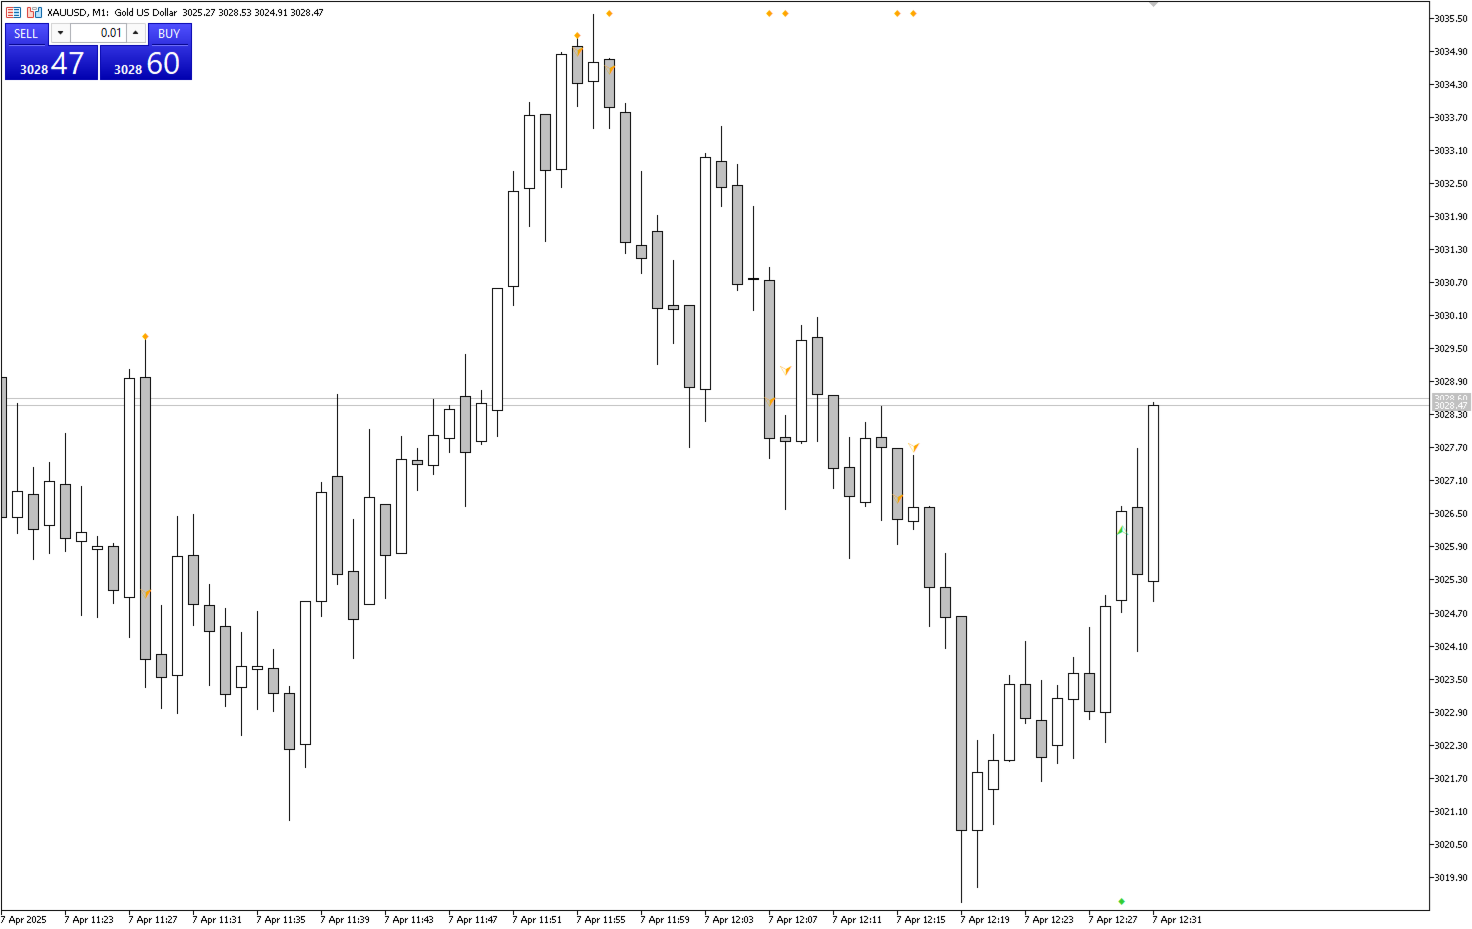
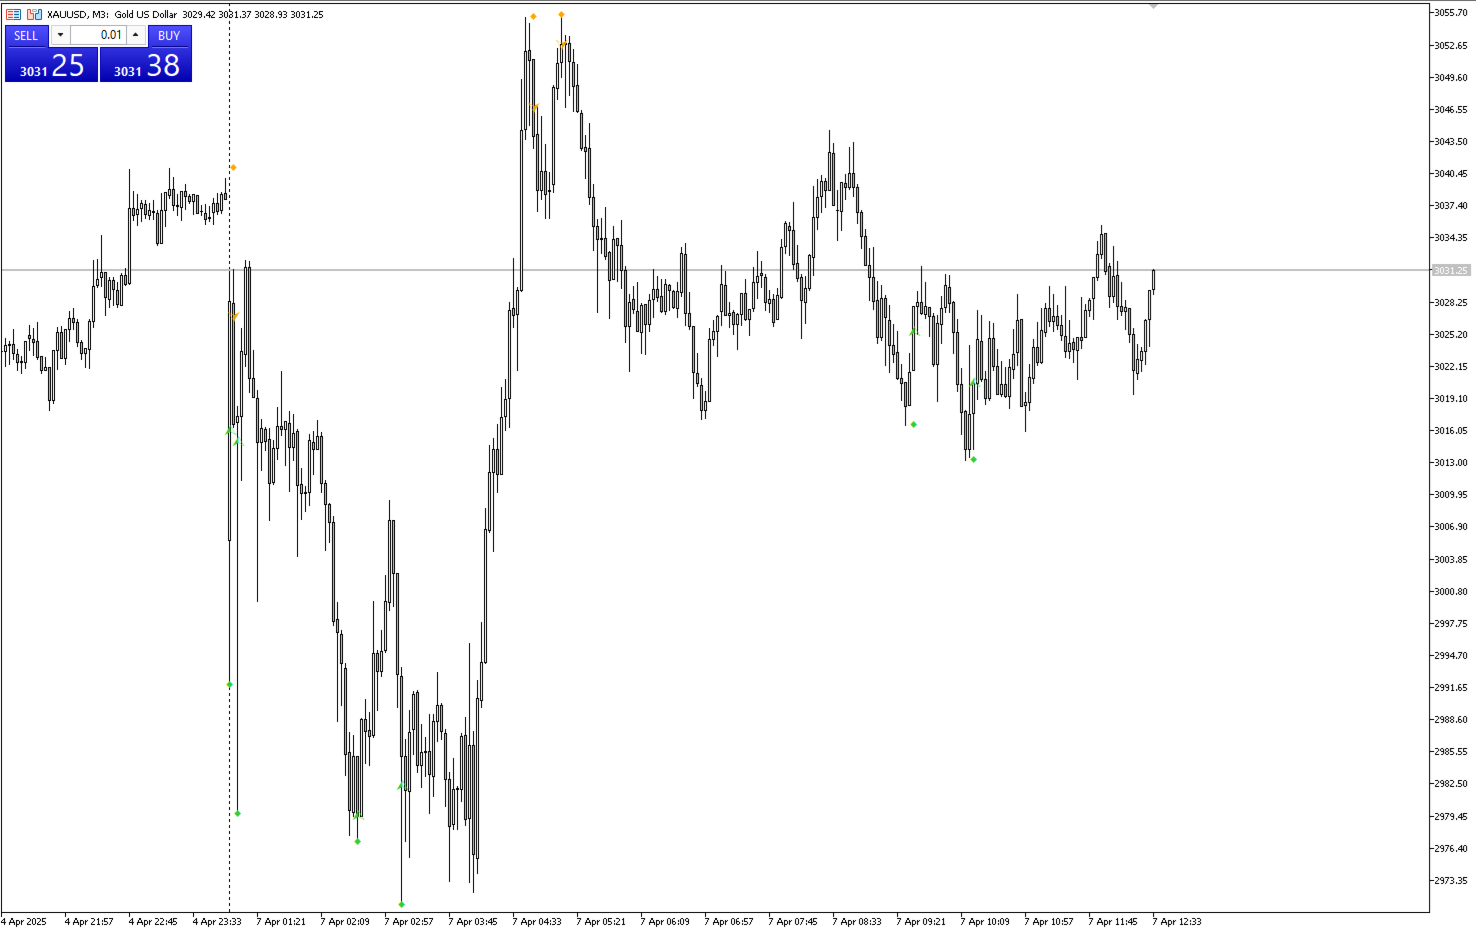
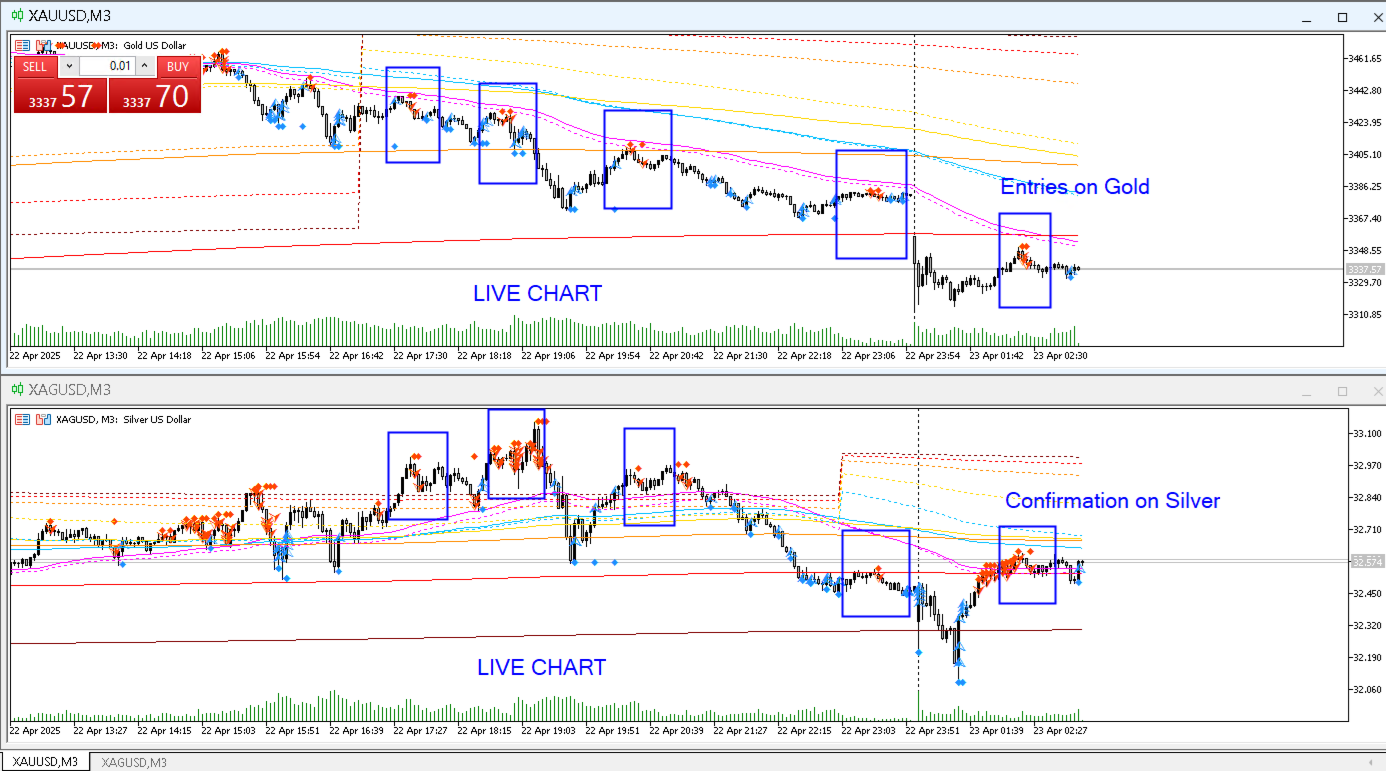
Direct Scalping shows the most SUPER SUPER SUPER EARLY opportunity to scalp the market.
Do entry as early as possible, as soon as the first sign appears.
It plays sound alert so that you can wait the moment while doing something else.
Remember to cut loss below the '◆' area. Yes, it is not stop loss but cut loss (exit on candle close).
Made for M1 timeframe, but higher is good too.
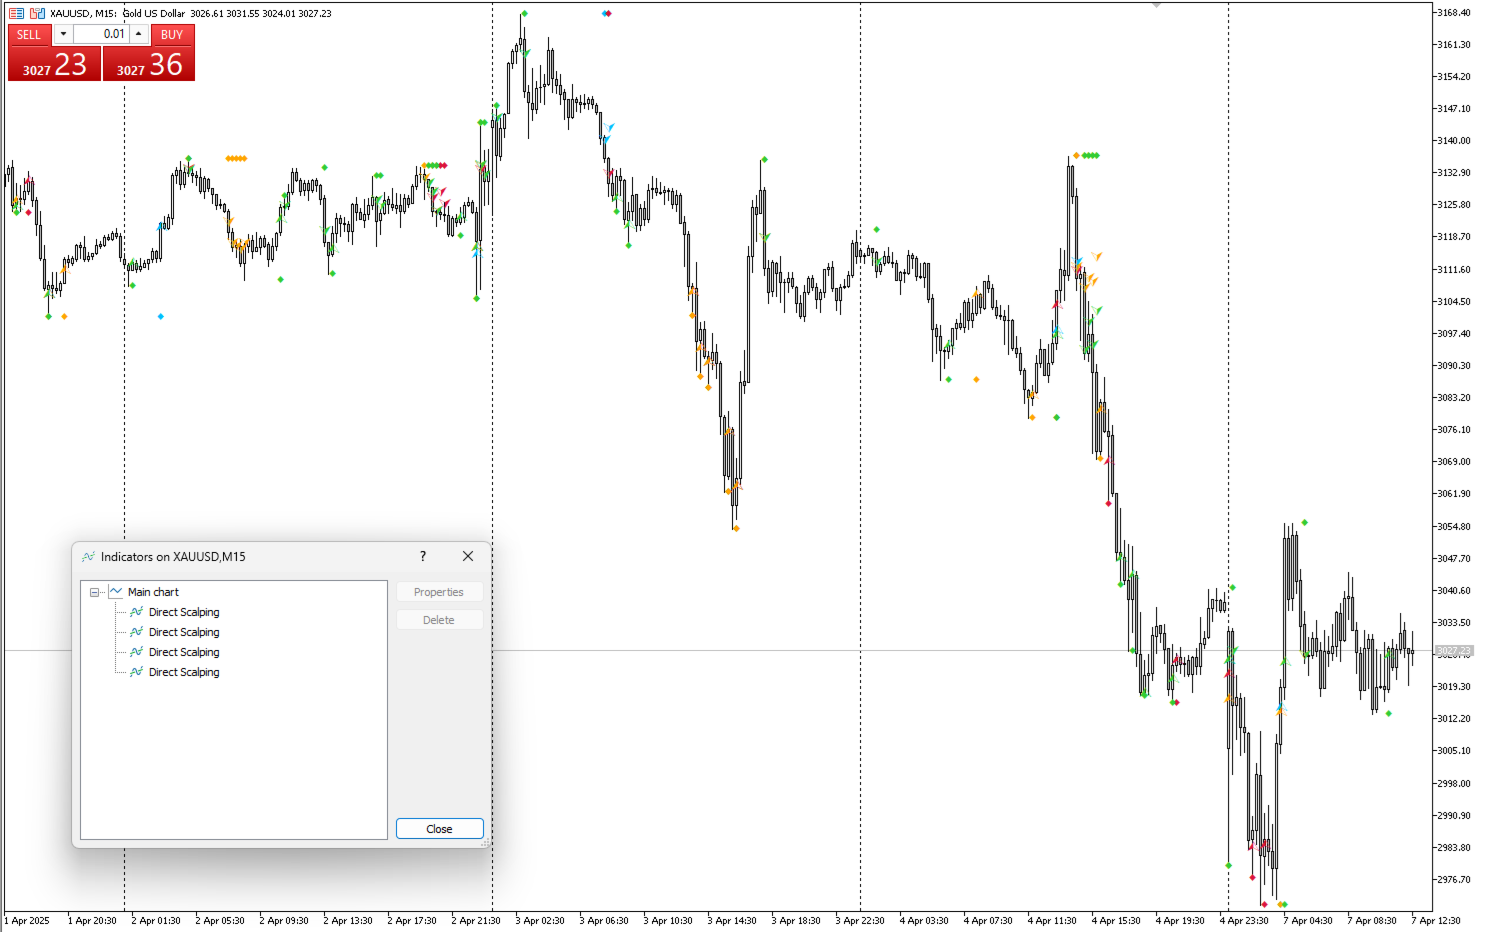
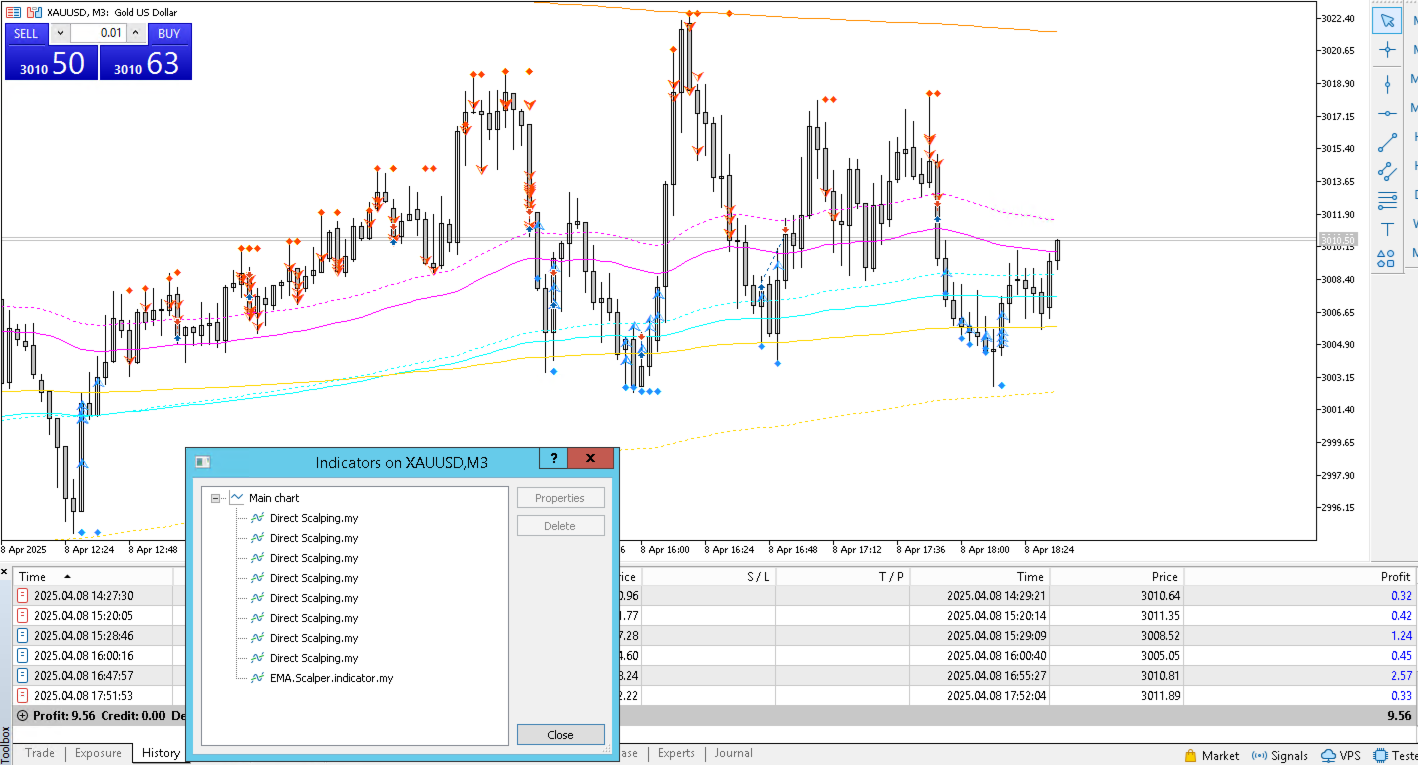
My new favorite setup: M3 using 8 indicators with different parameters: 11, 18, 25, 32, 39, 46, 53, and 60.
Combined with my EMA Scalper Indicator to stay with main trend: 80, 200, 400, 1000, 2000, and 4000.
Happy scalping.
Parameters:
- Timeframe multiplier: to detect higher timeframe based on candle count. If you on M1, 60 means it detects all possible H1 candle on every minute.
- Is play sound alert: if it's true then it will play wav file below every first sign.
- Buy sound: set wav file that exist on MetaTrader's sound folder.
- Sell sound: set wav file that exist on MetaTrader's sound folder.
Signals on historical data are slightly different from signals on live data.
Sound does not play in Strategy Tester.