Volume Poc Wvap

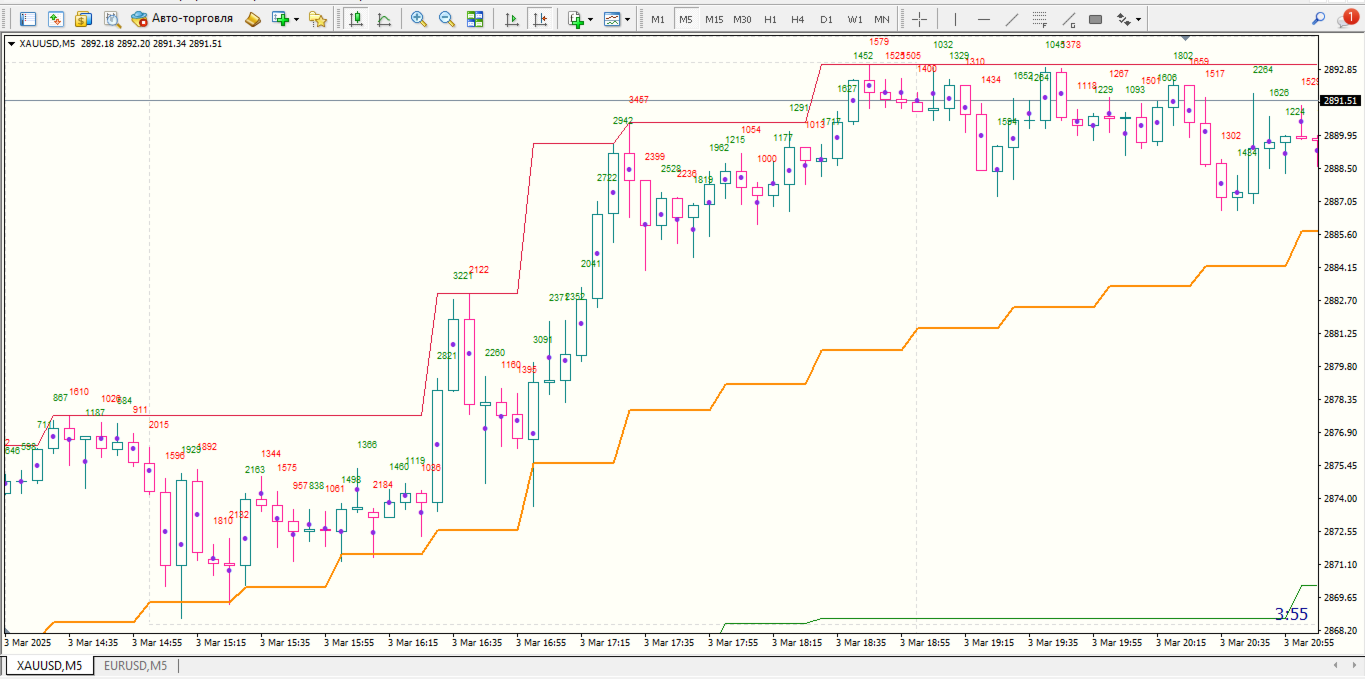
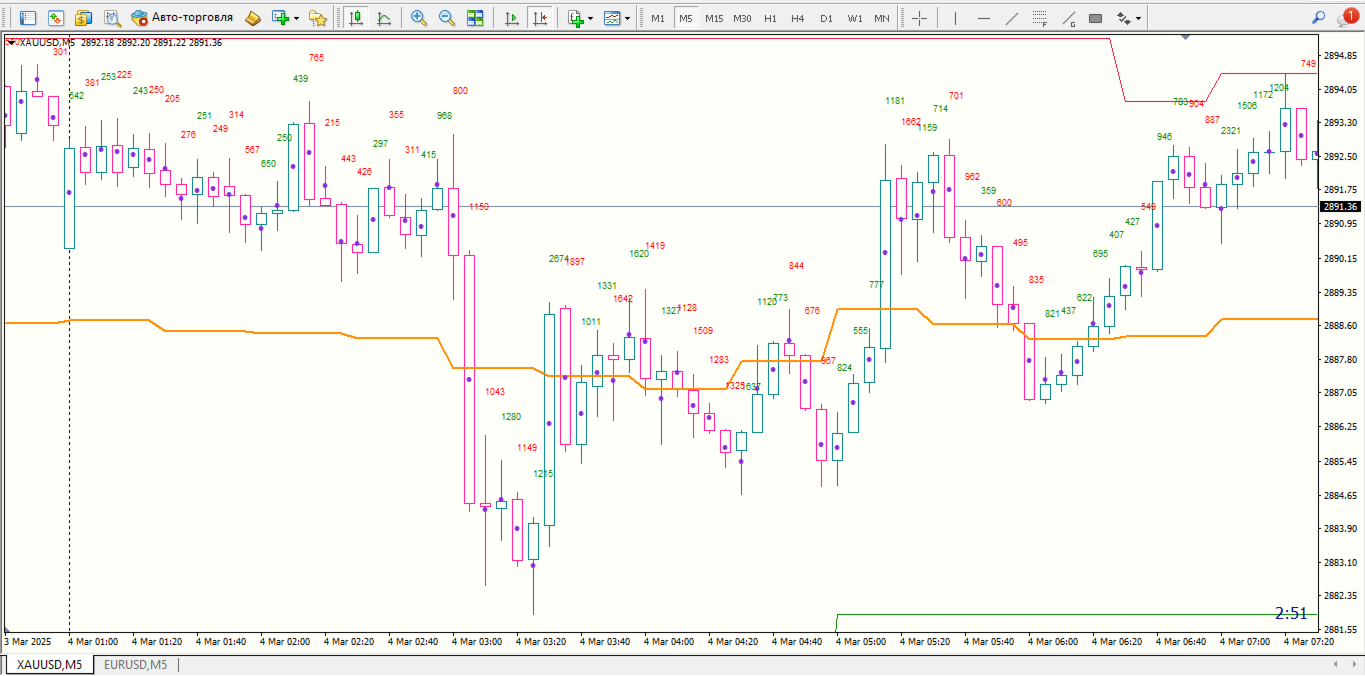
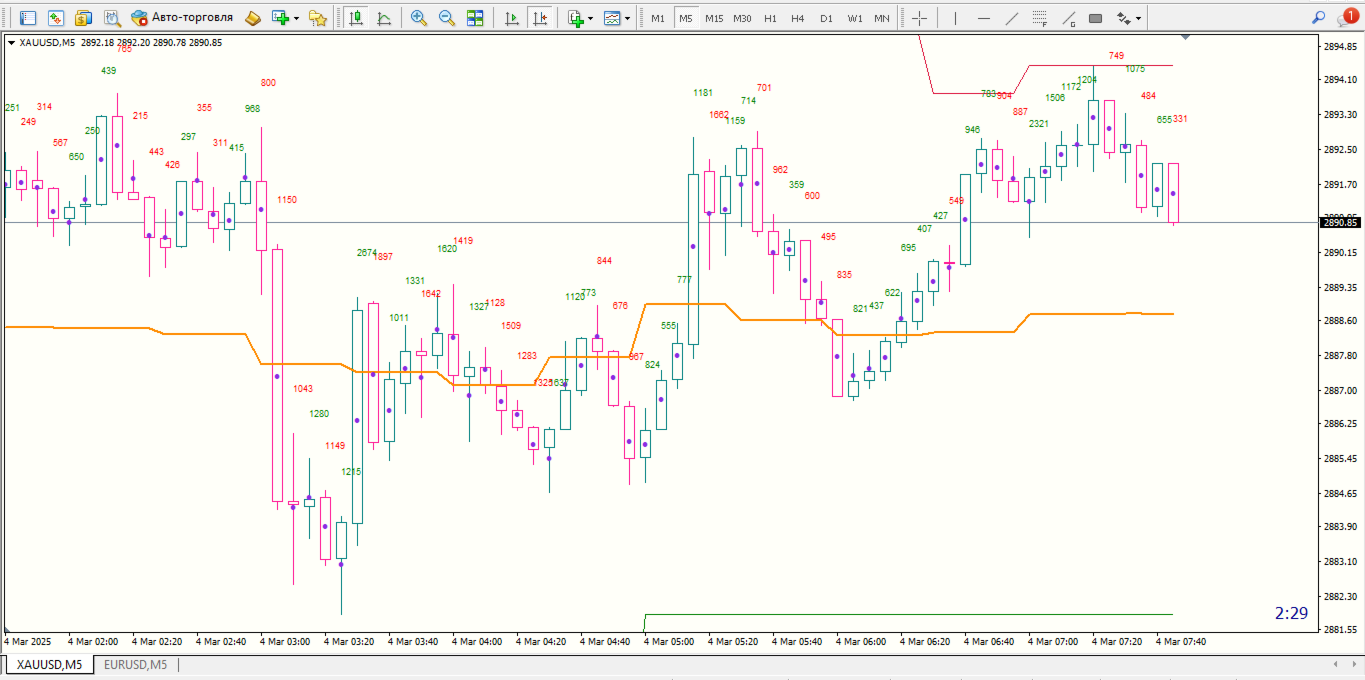
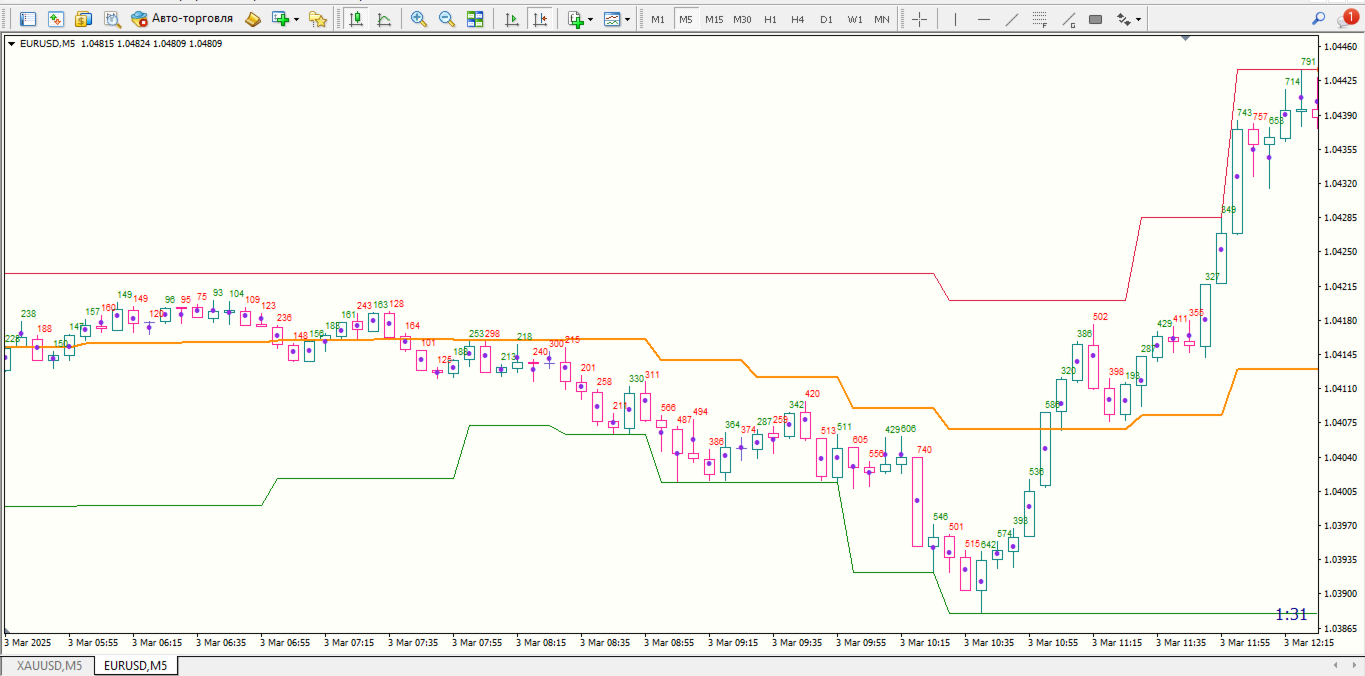
The "Volume POC WVAP" Indicator is a revolutionary tool for traders seeking in-depth analysis across various financial markets. This unique indicator, based on tick volumes in the MT4 terminal, provides indispensable information for making informed trading decisions in the following markets: Forex, binary options, cryptocurrency, spot, futures, and indices.

Key Features:

  1. WVAP Line:

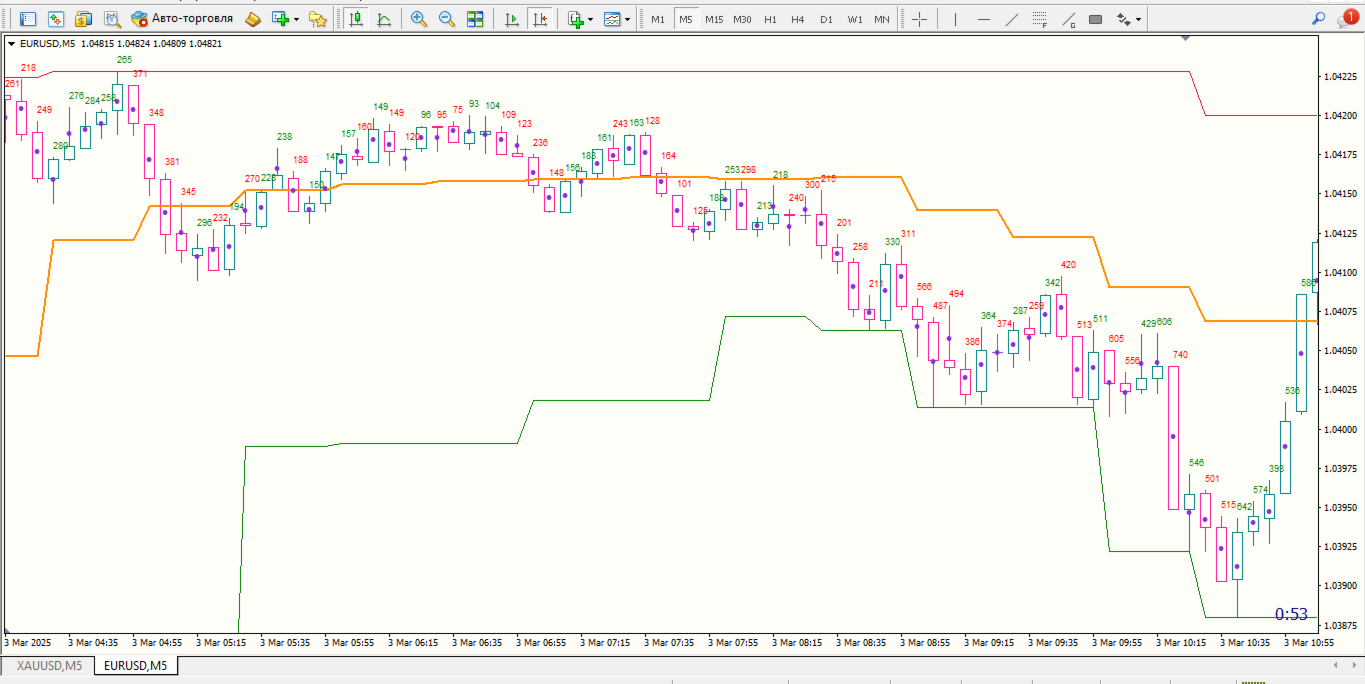
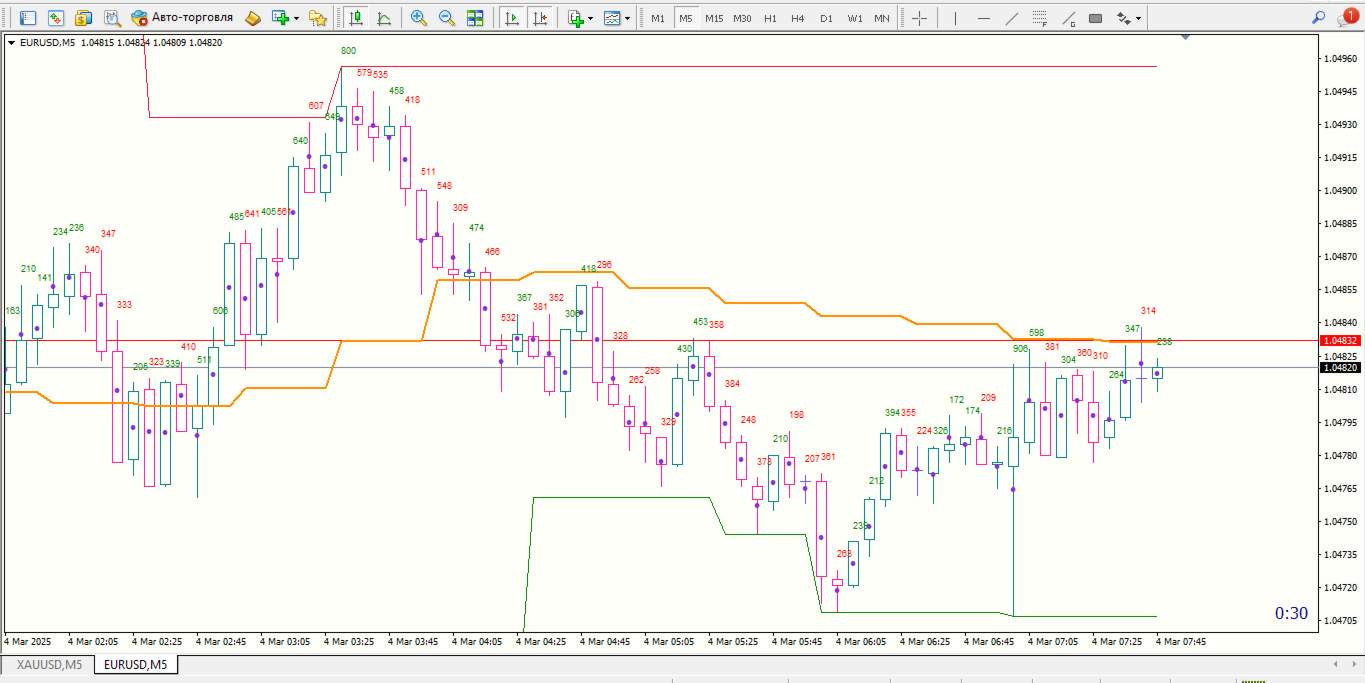
    • Weighted Volume Average Price: The WVAP calculates the weighted volume average price on the selected timeframe, allowing you to see the average price at which significant volume transactions occur.

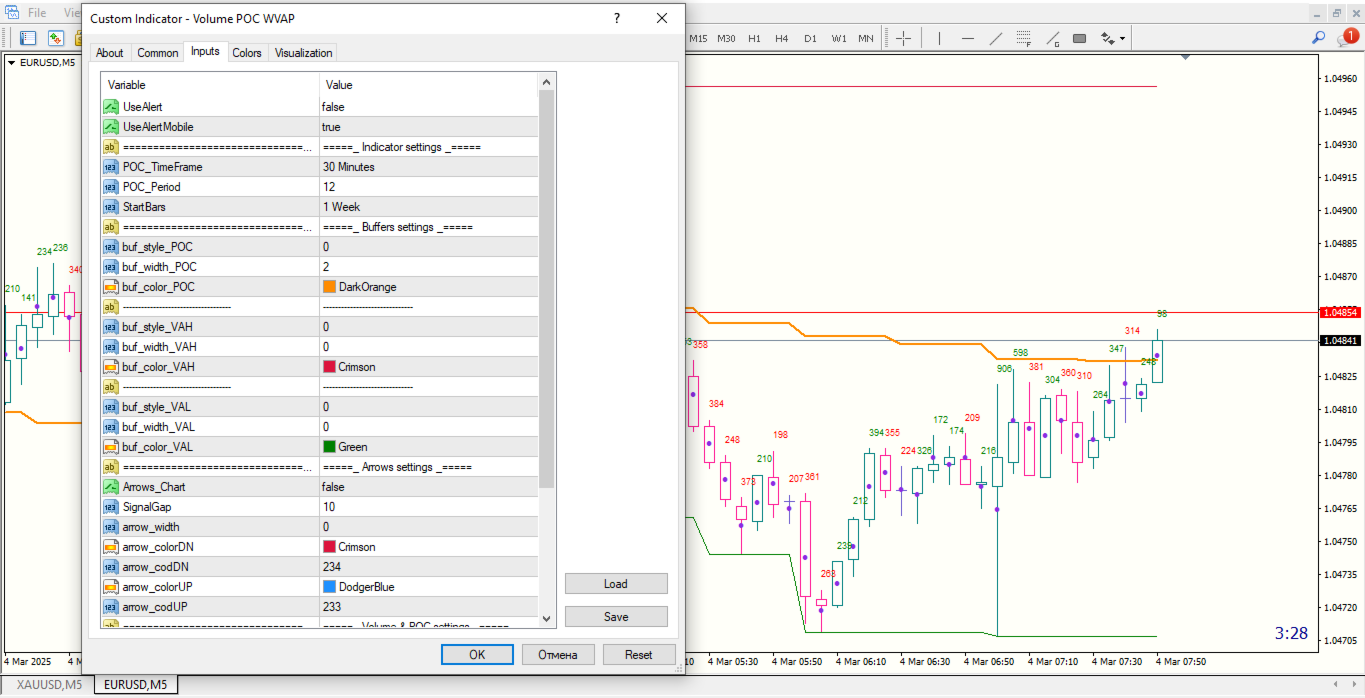
    • Flexible Timeframe Selection: The ability to choose timeframes (M15, M30, etc.) ensures the indicator can adapt to any market conditions and strategies, even if the chart is set to M5.

  2. Maximum and Minimum Lines:

    • Key Levels: These lines display critical maximum and minimum levels for the chosen timeframe, helping identify potential support and resistance levels.

  3. Texts and POC Dots:

    • Total Traded Volume: The total traded volume on each candle is displayed as text, giving you insights into the strength and intensity of market movements.

    • POC Level: The Point of Control (POC) level on each candle is marked by dots, indicating the most actively traded price levels.

  4. Customizable Arrows and Sound Alerts:

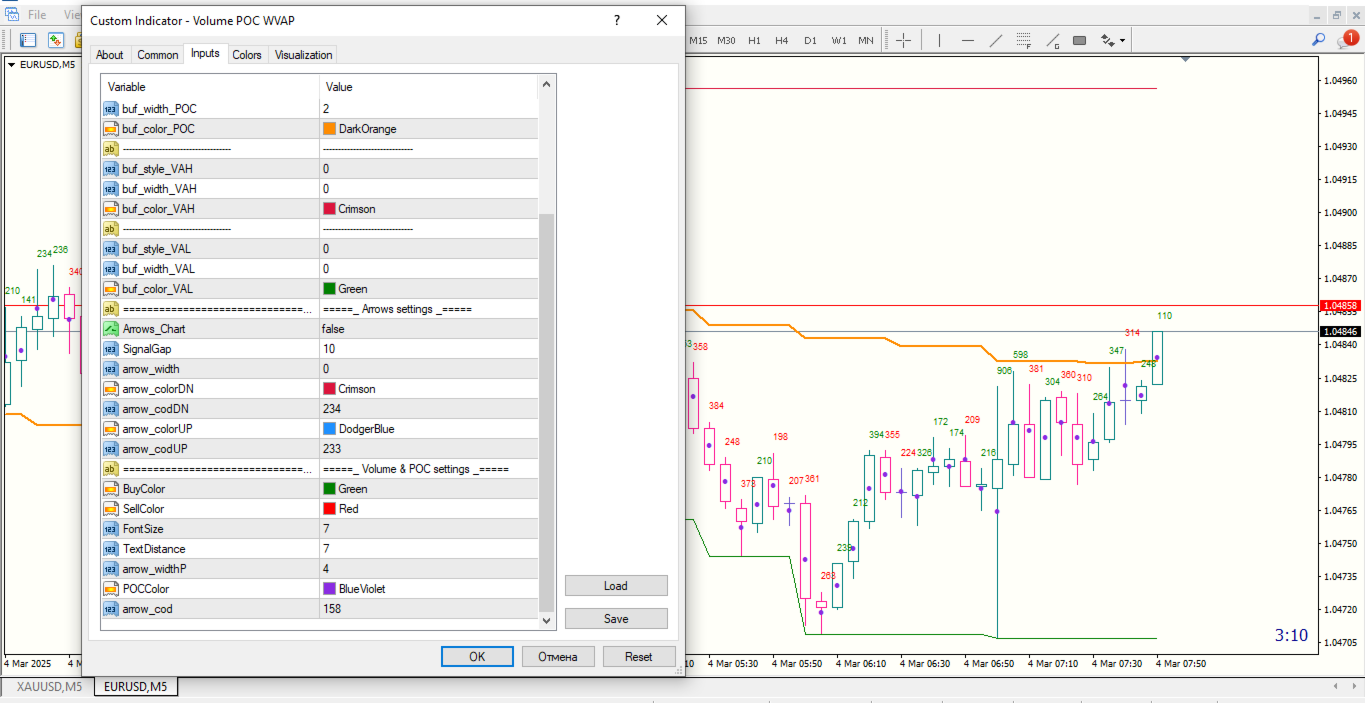
    • Alerts and Notifications: The ability to enable/disable arrows with sound alerts when the price crosses the WVAP line allows for prompt market reactions.

Advantages of Using "Volume POC WVAP":

  • Full Customization:

    • Personalization: Line colors, thickness, distance from bars, and other parameters are fully customizable, ensuring maximum convenience and alignment with your preferences.

    • Flexibility: You can select the timeframe and set the start of history loading according to your needs.

  • Intuitive Interface:

    • Convenience and Efficiency: The ease of use and clear graphical elements make the indicator intuitive and effective, even for beginners.

  • Advanced Analytical Capabilities:

    • In-depth Analysis: The indicator provides detailed volume analysis at various levels, helping identify key market trends and potential entry and exit points.

Application in Various Markets:

  • Forex: The indicator helps determine the average price and trading volumes on currency pairs, allowing for more precise decision-making.

  • Binary Options: Utilizing volumes and the WVAP level, along with maximum/minimum levels, aids in accurately predicting price movements.

  • Cryptocurrency: Volume analysis and POC levels help assess market activity in cryptocurrencies and identify key entry and exit levels.

  • Spot and Futures: The indicator helps understand trading dynamics and volumes in the spot and futures markets.

  • Indices: Volume and average price analysis allow for accurate trend identification and volatility assessment in index markets.

The "Volume POC WVAP" Indicator is your reliable companion in the world of trading. With its help, you can quickly and accurately assess market conditions, identify critical price levels, and make well-informed trading decisions.

Join our community of professional traders and experience the power of the "Volume POC WVAP" Indicator today! 🚀📈


おすすめのプロダクト
Volume Profile Master Pro — Visible Range Volume Profile for MT4 Volume Profile Master Pro brings institutional-grade volume analysis to your MT4 charts. Unlike standard volume indicators that show when volume occurred, this tool shows where — at each price level — giving you a precise map of market activity to identify high-probability trade setups. OVERVIEW The indicator calculates and displays a Visible Range Volume Profile (VRVP) that automatically updates as you scroll the chart. Every time
A technical indicator that calculates its readings on trading volumes. In the form of a histogram, it shows the accumulation of the strength of the movement of the trading instrument. It has independent calculation systems for bullish and bearish directions. Works on any trading instruments and time frames. Can complement any trading system. The indicator does not redraw its values, the signals appear on the current candle. It is easy to use and does not load the chart, does not require addition
BoxChart MT4
Evgeny Shevtsov
4.4 (5)
The market is unfair if only because 10% of participants manage 90% of funds. An ordinary trader has slim changes to stand against these "vultures". This problem can be solved. You just need to be among these 10%, learn to predict their intentions and move with them. Volume is the only preemptive factor that faultlessly works on any timeframe and symbol. First, the volume appears and is accumulated, and only then the price moves. The price moves from one volume to another. Areas of volume accumu
Was: $249  Now: $99   Market Profile defines a number of day types that can help the trader to determine market behaviour. A key feature is the Value Area, representing the range of price action where 70% of trading took place. Understanding the Value Area can give traders valuable insight into market direction and establish the higher odds trade. It is an excellent addition to any system you may be using. Blahtech Limited presents their Market Profile indicator for the MetaTrader community. Ins
Description The Market Profile & Volume Profile Indicator is a powerful technical analysis tool designed to visualize market activity and price distribution over specific timeframes. Unlike standard technical indicators that focus solely on price over time, this indicator organizes price data to show where the market spent the most time (TPO) and where the most volume was traded (Volume Profile). It automatically calculates and displays key structural levels such as the Point of Control (POC) ,
インディケータは現在のクオートを作成し、これを過去のものと比較して、これに基づいて価格変動予測を行います。インジケータには、目的の日付にすばやく移動するためのテキスト フィールドがあります。 オプション: シンボル - インジケーターが表示するシンボルの選択; SymbolPeriod - 指標がデータを取る期間の選択; IndicatorColor - インジケータの色; HorisontalShift - 指定されたバー数だけインディケータによって描画されたクオートのシフト; Inverse - true は引用符を逆にします。false - 元のビュー。 ChartVerticalShiftStep - チャートを垂直方向にシフトします (キーボードの上下矢印)。 次は日付を入力できるテキストフィールドの設定で、「Enter」を押すとすぐにジャンプできます。
Price vs Vwap
Pieter Gerhardus Van Zyl
Check out my German Pro Signal - https://www.mql5.com/en/signals/2354346 Price vs VWAP is a clean, non-repainting indicator that compares raw market price directly against a rolling Volume Weighted Average Price (VWAP) over a configurable time window. It plots two lines in a separate window: the real closing price and a dynamically calculated VWAP based on recent volume and price interaction. By adapting the VWAP lookback to the chart timeframe, it delivers a clear view of value versus executio
This indicator identifies pinbar candlesticks on the chart and displays an arrow as a trade signal based on the candlestick pattern. It offers user-friendly features, including push notifications and other types of alerts. It is most effective for identifying entry points or potential reversals at premium or discount prices. Additionally, it works on any time frame.
FREE
This indicator is a conventional analytical tool for tick volumes changes. It calculates tick volumes for buys and sells separately, and their delta on every bar, and displays volumes by price clusters (cells) within a specified bar (usually the latest one). The algorithm used internally is the same as in the indicator VolumeDelta , but results are shown as cumulative volume delta bars (candlesticks). Analogous indicator for MetaTrader 5 exists - VolumeDeltaBars . This is a limited substitution
Скрипт собирает размеры всех ценовых волн на текущем графике, которые не меньше заданной величины, и сохраняет их в CSV файл. Каждая строка таблицы будет содержать дату/время окончания волны и ее размер. Если вам нужно знать размеры волн в реальном времени, то воспользуйтесь индикатором Wave Size into ZigZag , Wave Size Histogram  или ZZ Histogram . ПАРАМЕТРЫ MinWaveSize:  минимальный размер дял волн, которые попадут в статистику PositiveValues:   true  - в файл сохраняется только размер волны
この指標は、指定されたバー数の作業ヒストグラム上の最大および最小価格ボリューム(市場プロファイル)のレベルを検索します。   合成のプロフィール。 ヒストグラムの高さは完全に自動化されており、あらゆる計測器と時間枠に適応します。 著者のアルゴリズムが使用され、よく知られている類似体を繰り返さない。 二つのヒストグラムの高さは、ろうそくの平均高さにほぼ等しい。 スマートアラートは、ボリュームレベルに関する価格を通知するのに役立ちます。 コンセプトSmart Money   。 Low Volume - Imbalance. は、良い市場の文脈を見つけ、市場の構造を決定し、バイナリオプションのフィルタとして使用されます。 それは価格のための磁石です。 High Volume - Liquidity. は、累積を終了するときのテストに使用されます。 入力パラメータ   。 基本   。 Bars Count - カウントして表示するバーの数   。 Signal Fractal = 5 (色信号のレベルのために)。 レベルは、次の条件の下で信号になります:それを超えない上部と下部に五
Time Bubble ***Specialized for GBPJPY 1H time frame*** (tested for two years with success rates about 82%) Time Circle's smart algorithm detects the price circles with time . give strong signals at the right time as result of combine the price and time. our team spent months to develop this indicator specially for GBPJPY ..with high success rates about 82% win trades over two years .tested from December 2016 to November 2018. *** in last two years total signals 1012 with 829 Wins and 183 Lo
プロフェッショナルな累積デルタ&ボリューム中央値インジケーター この強力なボリューム分析ツールを使用して、 実際の売買圧力 を追跡します。 ボリューム比較インジケーター (Volume Compare Indicator) は、 累積デルタ (Cumulative Delta) と ボリューム中央値 (Volume Medians) を組み合わせて、 機関投資家の活動、 不均衡、 および潜在的な反転を特定するのに役立ちます。  主な特徴:  累積デルタヒストグラム – リアルタイムで純粋な買いボリュームと売りボリュームを視覚化します。  売買ボリューム中央値 – 平均的な買いボリュームと売りボリュームのレベルを示す水平線。  スマートなボリューム分類 – 以下を区別します: 強い買い(緑) – 強気(ブル)の圧力。 強い売り(赤) – 弱気(ベア)の圧力。 買いボリューム中央値(青線) – 標準的な買いボリュームの基準。 売りボリューム中央値(オレンジ線) – 標準的な売りボリュームの基準。  カスタマイズ可能なパラメーター – 感度に合わせて CDIPeriod と CDIRang
製品名 Smart Moving Averages (MT4) – SmartView シリーズ 短い説明 MetaTrader プラットフォームで独特なユーザー体験を提供する Moving Averages インジケーター。以前は利用できなかった高度な機能を提供し、ダブルクリックで設定を開く、削除せずにインジケーターを非表示/表示する、インジケーターウィンドウをチャート全体のサイズで表示するなどの機能を備えています。SmartView Indicators シリーズの残りの部分とシームレスに連携するように設計されています。 概要 SmartView シリーズは、革新的な機能を通じて MetaTrader プラットフォーム上のインジケーターに独特で特徴的なユーザー体験を提供し、インジケーター管理をより速く、より簡単にします。各インジケーターには、チャート上のスマートコントロールパネルが装備されており、基本情報を表示し、すべての重要な機能への迅速なアクセスを提供します。 以前は利用できなかった独自の機能 SmartView シリーズは、インジケーターでの作業をより簡単で迅速にする高度な機
FREE
It will be the best tool for you to make a profit! Through unique algorithms You're going to see an amazing amount of right trading signals Make huge profits every day and realize more possibilities!   Like the car no money to buy it, the love of the girls dare not to pursue?Or the credit card bill is not paid, the rent does not have the extra money to settle?Or are you fed up with being bossed around by your boss and Hope to get more people's respect?Can't afford to buy the things you want ? wa
ドンチャン時間同期アナライザーは、 従来のドンチャンチャネル分析に強力な マルチタイムフレーム 分析機能を追加し、トレーダーは5つの異なるチャート期間にわたって トレンドの強さ と潜在的な 反転シグナル を同時に監視できます。この高度なインジケーターは、選択したタイムフレームにおける最高値と最低値を算出し、複数のタイムホライズンにおけるトレンドの方向の収束を特定するのに役立つ 明確な視覚的シグナル を生成します。分単位から時間単位までの統合分析を提供することで、単一タイムフレームツールよりも深い市場洞察を提供し、トレーダーが 重要なブレイクアウトを確認し 、タイムフレーム確認を通じて 偽シグナルを回避するのに 役立ちます。 コア機能 この洗練されたツールは、実績のある ドンチャンチャネル戦略を 複数の時間枠に同時に適用し、同期したシグナルをプロットすることで、短期的な価格変動が長期的なトレンドと一致しているかどうかを明らかにします。システムは、選択した時間枠において、価格が重要なサポートレベルまたはレジスタンスレベルを突破すると、別のインジケーターウィンドウに色分けされた矢印を生成し
Extract Candle Power は 、各ローソク足中の売り手と買い手の行動に関する貴重な洞察を提供するリアルタイムの出来高抽出インジケーターです。出来高データを分析することで、トレーダーは市場の傾向や反転の可能性について、より多くの情報に基づいた意思決定を行うことができ、従来の移動平均指標の機能を超えています。 この強力なツールを使用すると、現在のローソク足の売り手と買い手の出来高を抽出して分析したり、以前のローソク足の出来高と比較したりすることができます。この情報は、市場におけるトレーダーの現在の位置を理解する上で非常に重要です。さらに、ライブローソク足の出来高と移動平均を比較することで、潜在的な反転ポイントを簡単に特定できます。 Extract Candle Power インジケーターは非常に汎用性が高く、すべての時間枠および通貨ペアで効果的に機能します。これは正確な洞察を提供し、より長い時間枠で使用する場合に特に価値があります。特定の取引戦略がある場合でも、さまざまな時間枠に適応したい場合でも、このインジケーターはニーズに合わせて調整できます。 このインジケーターは、取
Rainbow Price Visualizer v1.21 See where the market really breathes. Turns your MT4 chart into an ultra-precise heatmap that highlights price zones favored by big players. Why it matters 300 price levels at 0.2‑pip resolution — microscopic detail. 8 visual themes (Rainbow, Fire, Ocean…) for instant readibility. Smart opacity: low noise fades, real zones pop. Lightweight rendering with automatic cleanup. Fully customizable: saturation, opacity, resolution, history depth. Bands project into the f
「シグナル ヒストグラム スキャルパー」インジケーターは、再描画やラグのないヒストグラムとシグナルの形式の一般的なインジケーターです。 「シグナル ヒストグラム スキャルパー」インジケーターは、トレンドに沿った最適なエントリー ポイントをチャート上に表示します。 フィルターとして他のトレンド指標と組み合わせて使用​​することをお勧めします。 このインジケーターは M5 タイムフレームで良好な結果を示しており、シグナルはローソク足が閉じた後に生成され、緑と赤の円の形で表示されます。 「シグナル ヒストグラム スキャルパー」インジケーターは、純粋な形でのスキャルピングとフィルターを使用した日中取引を目的としています。 スクリーンショットは、ポジションのエントリーポイントとエグジットポイントの例を示しています。 「シグナル ヒストグラム スキャルパー」インジケーターを使用して取引する場合、インジケーター アルゴリズムには独自のスキャルピング戦略が含まれているため、常に黒字になります。
VPPD:Ваш «Рентген» для графика. Простыми словами о сложном Представьте, что рынок — это большое здание. Обычные графики показывают вам только его фасад (цену). **VPPD** — это инструмент, который показывает вам чертежи несущих конструкций и подсчитывает, сколько людей зашли через парадный вход, а сколько вышли через черный. Это индикатор для MetaTrader 4, который показывает, где на самом деле находятся деньги крупных игроков и кто сейчас рулит рынком: покупатели или продавцы.   В чем суть
Market Profile 3
Hussien Abdeltwab Hussien Ryad
3 (2)
Market Profile 3 MetaTrader 4 indicator  — is a classic Market Profile implementation that can show the price density over time, outlining the most important price levels, value area, and control value of a given trading session. This indicator can be attached to timeframes between M1 and D1 and will show the Market Profile for daily, weekly, monthly, or even intraday sessions. Lower timeframes offer higher precision. Higher timeframes are recommended for better visibility. It is also possible t
FREE
This indicator displays the histogram and arrows on chart. When Simple The Best Pro are placed on a chart, they identify the trend.  The color of may be blue or red. The blue color stands for upside moves and the red color stands for downside trends. The indicator offers to set Stop Loss (SL) and  Take Profit (TP)  setting. The default value is ATR. Indicator has automatic optimization. The STB is a unique indicator that shows the tendency (button Bars) of a particular signals. The STB tells us
MT4 バージョン: https://www.mql5.com/ja/market/product/157433 MT5 バージョン: https://www.mql5.com/ja/market/product/167286 出来高インバランスは、設定可能なルックバックレンジ内で、活発な価格帯、方向性のプレッシャー、そして「空」の価格帯を特定できるように設計された、軽量な出来高プロファイルとデルタ・インバランスの可視化ツールです。 総出来高のみを表示する従来の出来高プロファイルとは異なり、このインジケーターは各価格帯を以下のように分割します。 ブル出来高(買い圧力) - 強気のローソク足(終値 > 始値)から推定 ベア出来高(売り圧力) - 弱気のローソク足(終値 ≤ 始値)から推定 その結果、チャート右側にTradingView風のすっきりとしたプロファイルが描画され、さらにデルタ・サマリー・パネルには価格帯全体のパーセンテージ・インバランス(Δ%)が表示されるため、買い手と売り手が優勢な場所を簡単に特定できます。 また、ゼロ出来高ゾーン(選択したルックバックレンジ内で出来高
Market Profile Shows where the price has spent more time, highlighting important levels that can be used in trading. It is a powerful tool which is designed to take the fundamental components which comprise every market; price/volume/time, and visually display their relationship in real-time as the market develops for a pre-determined time period. Very powerful tool!
Dollar mint indicator is a special workmanship with years of experience in forex.   Dollar mint ea is a fully non repaint indicator optimised with price action data such that once it gives you a signal t . The indicator   can be used to trade anything on the mt4 with much ease. Benefits ; Fully non repaint Use in any timeframe Use in all the available tradable assets on mt4 Best to use on h4. It generates fully analysed buy and sell signals based on trend and also filters out retracements and
PipFinite Exit EDGE
Karlo Wilson Vendiola
4.83 (115)
Did You Have A Profitable Trade But Suddenly Reversed? In a solid strategy, exiting a trade is equally important as entering. Exit EDGE helps maximize your current trade profit and avoid turning winning trades to losers. Never Miss An Exit Signal Again Monitor all pairs and timeframes in just 1 chart www.mql5.com/en/blogs/post/726558 How To Trade You can close your open trades as soon as you receive a signal Close your Buy orders if you receive an Exit Buy Signal. Close your Sell orders if
Smart Predictor — Continuous Market Forecasting with Intelligent Signals SmartPredictor  offers a fresh perspective on technical analysis. This indicator combines price data smoothing with advanced forecasting elements to create a seamless, continuous "past-present-future" view. No more guessing where the price might go — you can now see the most probable scenario plotted directly on your chart. Key Innovation: Zero Visual Lag Unlike standard averaging indicators such as moving averages that a
Price Magnet — Price Density and Attraction Levels Indicator Price Magnet is a professional analytical tool designed to identify key support and resistance levels based on statistical Price Density. The indicator analyzes a specified historical period and detects price levels where the market spent the most time. These zones act as “magnets,” attracting price action or forming a structural base for potential reversals. Unlike traditional Volume Profile tools, Price Magnet focuses on price-time d
OrderFlow Absorption – MT4用プロフェッショナル・デルタ&アブソープションシグナルインジケーター OrderFlow Absorptionで本物のオーダーフロー分析の力を解き放ちましょう。MetaTrader 4向けの究極のデルタヒストグラム&アブソープションシグナルインジケーターです。あらゆる価格変動の裏側で何が起きているのかを知りたいトレーダーのために設計されており、市場を動かす隠れた買い/売り圧力や吸収イベントを明らかにします。 特徴 デルタヒストグラムの可視化:   買い圧力・売り圧力を色分けされたヒストグラムで即座に表示。 アブソープションシグナル検出:   高度なロジックで強気・弱気の吸収イベントを特定し、反転の兆しを早期に通知。 チャートマーカー:   吸収シグナルをチャート上に直接マークし、視覚的に分かりやすく表示。 ポップアップアラート:   新しい吸収シグナルが出現した際にリアルタイムで通知。 カスタマイズ可能な閾値:   弱いシグナルを除外し、高確率のセットアップに集中。 リソース管理:   大きなチャートでも高速に動作する効率的な計算。
Was: $299  Now: $99   Supply Demand uses previous price action to identify potential imbalances between buyers and sellers. The key is to identify the better odds zones, not just the untouched ones. Blahtech Supply Demand indicator delivers functionality previously unavailable on any trading platform. This 4-in-1 indicator not only highlights the higher probability zones using a multi-criteria strength engine, but also combines it with multi-timeframe trend analysis, previously confirmed swings
このプロダクトを購入した人は以下も購入しています
An exclusive indicator that utilizes an innovative algorithm to swiftly and accurately determine the market trend. The indicator automatically calculates opening, closing, and profit levels, providing detailed trading statistics. With these features, you can choose the most appropriate trading instrument for the current market conditions. Additionally, you can easily integrate your own arrow indicators into Scalper Inside Pro to quickly evaluate their statistics and profitability. Scalper Inside
Linear Trend Predictor ー - エントリ ポイントと方向サポート ラインを組み合わせたトレンド インジケーター。高値/安値チャネルを突破するという原理に基づいて機能します。 インジケーターのアルゴリズムは市場のノイズをフィルタリングし、ボラティリティと市場の動向を考慮します。 インジケーターの機能  平滑化手法を使用して、市場のトレンドと、買い注文または売り注文を開くためのエントリー ポイントを表示します。  任意の時間枠のチャートを分析して、短期および長期の市場の動きを判断するのに適しています。  あらゆる市場や時間枠に適応可能な入力パラメータにより、トレーダーはインジケーターを独自にカスタマイズできます。  設定されたインジケーター信号は消えず、再描画もされません。ローソク足の終値で決定されます。  いくつかの種類の通知が矢印と組み合わされています。  このインジケーターは、独立した取引システムとして使用することも、他の取引システムへの追加として使用することもできます。  あらゆるレベルの経験を持つトレーダーが使用できます。 主なパラメータ Vol
「 Dynamic Scalper System 」インジケーターは、トレンド波の中でスキャルピング取引を行う手法のために設計されています。 主要通貨ペアと金でテスト済みで、他の取引商品との互換性があります。 トレンドに沿った短期的なポジションオープンのシグナルを提供し、追加の価格変動サポートも提供します。 インジケーターの原理 大きな矢印はトレンドの方向を決定します。 トレンド波の中では、小さな矢印の形でスキャルピングシグナルを生成するアルゴリズムが機能します。 赤い矢印は強気方向、青い矢印は弱気方向です。 トレンドの方向には敏感な価格変動ラインが描かれ、小さな矢印のシグナルと連動します。 シグナルは次のように機能します。適切なタイミングでラインが現れるとエントリーシグナルが形成され、ラインが開いている間はポジションが保持され、完了すると取引が終了します。 推奨される動作時間枠はM1~H4です。 矢印は現在のローソク足に形成され、次のローソク足が開いている場合は、前のローソク足の矢印は再描画されません。 入力パラメータ Trend Wave Period - トレンド方向
まず第一に、この取引インジケーターは再描画されず、再描画されず、遅延しないことを強調する価値があります。これにより、手動取引とロボット取引の両方に理想的なものになります。 ユーザーマニュアル:設定、入力、戦略。 アトミックアナリストは、価格の強さとモメンタムを利用して市場でより良いエッジを見つけるためのPA価格アクションインジケーターです。ノイズや誤ったシグナルを除去し、取引ポテンシャルを高めるための高度なフィルターを備えています。複雑なインジケーターの複数のレイヤーを使用して、アトミックアナリストはチャートをスキャンし、複雑な数学的計算をシンプルなシグナルと色に変換します。これにより、どのような初心者トレーダーでも理解して使用し、一貫した取引の決定を行うことができます。 「アトミックアナリスト」は、新規および経験豊富なトレーダー向けにカスタマイズされた包括的な取引ソリューションです。プレミアムインジケーターとトップノッチの機能を1つの取引戦略に組み合わせ、すべてのタイプのトレーダーにとって汎用性のある選択肢にします。 デイリートレーディングとスキャルピング戦略:高速で正確な
トレンドラインプロ   市場の真の方向転換点を理解するのに役立ちます。この指標は、真のトレンド反転と主要プレーヤーが再び参入するポイントを示します。 分かりますか     BOSライン   複雑な設定や不要なノイズなしに、より長い時間足でのトレンドの変化と重要なレベルを把握できます。シグナルは再描画されず、バーが閉じた後もチャート上に残ります。 VERSION MT 5     -     RFI LEVELS PRO インジケーター と組み合わせることで、その潜在能力を最大限に発揮します。 インジケーターが示す内容: 本当の変化   トレンド(BOSライン) 一度シグナルが現れたら、それは有効です!これは、リペイント機能を持つインジケーターとの重要な違いです。リペイント機能を持つインジケーターは、シグナルを発した後、それを変更し、資金の損失につながる可能性があります。これにより、より高い確率と精度で市場に参入できます。また、矢印が現れた後、目標値(利益確定)に達するか、反転シグナルが現れるまで、ローソク足の色を変更する機能もあります。 繰り返しエントリ       主要プレーヤーの
NAM Order Blocks
NAM TECH GROUP, CORP.
3.67 (3)
MT4マルチタイムフレームオーダーブロック検出インジケーター。 特徴 -チャートコントロールパネルで完全にカスタマイズ可能で、完全な相互作用を提供します。 -必要な場所でコントロールパネルを表示および非表示にします。 -複数の時間枠でOBを検出します。 -表示するOBの数量を選択します。 -さまざまなOBユーザーインターフェイス。 -OBのさまざまなフィルター。 -OB近接アラート。 -ADRの高線と低線。 -通知サービス(画面アラート|プッシュ通知)。 概要 注文ブロックは、金融機関や銀行からの注文収集を示す市場行動です。著名な金融機関と中央銀行が外国為替市場を牽引しています。したがって、トレーダーは市場で何をしているのかを知る必要があります。市場が注文ブロックを構築するとき、それは投資決定のほとんどが行われる範囲のように動きます。 注文の構築が完了すると、市場は上向きと下向きの両方に向かって急激に動きます。注文ブロック取引戦略の重要な用語は、機関投資家が行っていることを含むことです。それらは主要な価格ドライバーであるため、機関投資家の取引を含むあらゆる戦
GOLD Impulse with Alert
Bernhard Schweigert
4.67 (12)
このインディケータは、当社の2つの製品 Advanced Currency IMPULSE with ALERT  +   Currency Strength Exotics . のスーパーコンビネーションです。 このインジケーターは全ての時間枠で作動し、8つの主要通貨と1つのシンボルの強弱のインパルスをグラフで表示します。 このインジケータは、金、エキゾチックペア、商品、インデックス、先物など、あらゆるシンボルの通貨強度の加速度を表示することに特化されています。金、銀、原油、DAX、US30、MXN、TRY、CNHなどの通貨強度の加速度(インパルスまたは速度)を表示するために、任意のシンボルを9行目に追加できる、この種の最初のものです。 新しいアルゴリズムに基づいて構築され、潜在的な取引の特定と確認がさらに容易になりました。これは、通貨の強さや弱さが加速しているかどうかをグラフィカルに表示し、その加速の速度を測定するためです。加速すると物事は明らかに速く進みますが、これはFX市場でも同じです。つまり、反対方向に加速している通貨をペアリングすれば、潜在的に利益を生む取引を特定
MTF Supply Demand Zones
Georgios Kalomoiropoulos
4.82 (22)
次世代の自動化された需要と供給のゾーン。どのチャートでも機能する新しい革新的なアルゴリズム。すべてのゾーンは、市場の価格行動に従って動的に作成されています。 2種類のアラート --> 1) 価格がゾーンに達したとき 2) 新しいゾーンが形成されたとき もう 1 つの役に立たない指標はありません。実績のある完全な取引戦略を手に入れることができます。     新機能:     価格が需給ゾーンに達したときにアラートを出す     新しい需給ゾーンが作成されたときにアラートを発します     プッシュ通知アラート     ピップ単位のゾーン幅ラベル     MTF のもう 1 つのタイムフレーム。したがって、現在より 2 時間足高いのではなく、現在より 3 時間足し上に見えるようになります。     アラート/ゾーン/MTF 機能を有効/無効にするボタン あなたが得る利点:     取引から感情を取り除きます。     取引エントリをオブジェクト化します。     確率の高いセットアップで利益を上げましょう。     描画ゾーンから時間を節約します。
現在20%OFF! 初心者やエキスパートトレーダーに最適なソリューションです。 このインディケータは、エキゾチックペア・コモディティ・インデックス・先物など、あらゆるシンボルの通貨の強さを表示することに特化したインディケータです。金、銀、原油、DAX、US30、MXN、TRY、CNHなどの通貨の強さを表示するために、9行目にどのシンボルでも追加することができます。独自の機能を多数搭載し、新しい計算式を採用したため、ユニークで高品質、かつ手頃な価格のトレーディングツールとなっています。新しいトレンドやスキャルピングチャンスのトリガーポイントを正確に把握することができるため、あなたのトレードがどのように改善されるか想像してみてください。 ユーザーマニュアル:ここをクリック   https://www.mql5.com/en/blogs/post/708876 すべての時間枠に対応します。あなたはすぐにトレンドを見ることができるようになります! 新しいアルゴリズムに基づいて設計されているため、潜在的な取引の特定と確認がより簡単になります。これは、8つの主要通貨と1つのシンボルの強弱
MetaForecast M4
Vahidreza Heidar Gholami
5 (2)
MetaForecastは、価格データのハーモニクスに基づいて、どんな市場の未来を予測し視覚化します。市場が常に予測可能ではありませんが、価格にパターンがある場合、MetaForecastは可能な限り正確な未来を予測できます。他の類似製品と比較して、MetaForecastは市場のトレンドを分析することでより正確な結果を生成することができます。 入力パラメータ Past size (過去のサイズ) MetaForecastが将来の予測を生成するために使用するバーの数を指定します。モデルは選択したバー上に描かれた黄色の線で表されます。 Future size (将来のサイズ) 予測すべき将来のバーの数を指定します。予測された将来は、ピンクの線で表示され、その上に青い回帰線が描かれます。 Degree (程度) この入力は、MetaForecastが市場で行う分析のレベルを決定します。 Degree 説明  0 Degree 0の場合、価格の全てのピークや谷、そして詳細をカバーするために、「Past size」の入力に大きな値を使用することが推奨されています。  1 (推奨) Degre
Super Reversal Indicator with Alert 概要 Super Reversal Indicator with Alert は、マルチタイムフレーム分析を用いて高確率の相場反転ポイントを特定するためのトレーディングツールです。ストキャスティクスのモメンタム、需給ゾーン、そして価格のリジェクションシグナルを組み合わせて分析を行います。 本インジケーターは、明確な視覚シグナルとリアルタイムアラートにより、トレーダーが市場の転換点を見極めるのをサポートします。 主な機能 マルチタイムフレーム ストキャスティクス分析 上位時間足のストキャスティクスを使用(ユーザー設定可能) モメンタムの変化やクロスシグナルを検出 エントリー精度を高めるための買われ過ぎ・売られ過ぎレベルを表示 反転リジェクションシグナル 重要な価格帯での強いリジェクションローソク足を検出 以下のポイントでの反転を識別 日足高値での売り反転 日足安値での買い反転 視認性を高めるため、チャート上に矢印を表示 需給ゾーン(Supply and Demand) H4およびD1の上位時間足から重要なゾーンを自動
Introducing the Delta Volume Profile Indicator - Unleash the Power of Institutional Precision!  Technical Indicator: Are you ready to trade like the pros? The Delta Volume Profile Indicator is no ordinary tool. It’s a high-precision, cutting-edge indicator that puts the power of institutional-grade trading in your hands. This unique indicator analyses delta volume distribution in real-time, revealing the market's hidden buy/sell imbalances that the biggest financial institutions rely on to antic
Order Block Hunter
Noha Mohamed Fathy Younes Badr
5 (10)
Order block hunter indicator is the best indicator for  hunt the order blocks that area where there has been a large concentration of limit orders waiting to be executed Order blocks are identified on a chart by observing previous price action and looking for areas where the price experienced significant movement or sudden changes in direction .This indicator does that for you by using very complicated codes and helps you to take the best areas To buy and sell because it make marks at the best a
Dynamic Forex28 Navigator - 次世代の Forex 取引ツール。 現在 49% オフ。 Dynamic Forex28 Navigator は、長年人気のインジケーターを進化させたもので、3 つの機能を 1 つにまとめています。 Advanced Currency Strength28 インジケーター (レビュー 695 件)  + Advanced Currency IMPULSE with ALERT (レビュー 520 件) + CS28 コンボ シグナル (ボーナス)。 インジケーターの詳細 https://www.mql5.com/en/blogs/post/758844 次世代の Strength インジケーターが提供するもの  オリジナルで気に入っていたすべての機能が、新機能と精度の向上によって強化されました。 主な機能: 独自の通貨強度計算式。 すべての時間枠でスムーズかつ正確な強度ライン。 トレンドの特定と正確なエントリーに最適です。 ダイナミックマーケットフィボナッチレベル (マーケットフィボナッチ)。 このインジケーターに固有
Advanced Supply Demand
Bernhard Schweigert
4.91 (299)
現在40%オフ 初心者にもエキスパートトレーダーにも最適なソリューション このインジケーターは独自の機能と新しい公式を多数内蔵しており、ユニークで高品質かつ手頃な取引ツールです。このアップデートでは、2つの時間枠ゾーンを表示できるようになります。より長いTFだけでなく、チャートTFとより長いTF(ネストゾーンを表示)の両方を表示できます。すべてのSupply Demandトレーダーの皆さんのお気に召すはずです。:) 重要情報の公開 Advanced Supply Demandの可能性を最大化するには、 https://www.mql5.com/ja/blogs/post/720245 にアクセスしてください。   エントリーまたはターゲットの正確なトリガーポイントを正確に特定できれば取引がどのように改善されるか想像してみてください。新しい基盤となるアルゴリズムに基づいて構築されているため、買い手と売り手の間の潜在的な不均衡をさらに簡単に特定できます。これは、最も強い需要と供給のゾーンと、過去のパフォーマンス(古いゾーンを表示)がグラフィカルに表現されるためです。これらの機能は、最適な
このインジケーターは、反転ポイントと価格戻りゾーンを正確に表示します。     主要プレーヤー 。新たなトレンドが形成される場所を把握し、最大限の精度で意思決定を行い、すべての取引をコントロールします。 TREND LINES PRO インジケーターと組み合わせることで、その潜在能力を最大限に発揮します。 VERSION MT5 インジケーターが示す内容: 新しいトレンドの始まりに活性化する反転構造と反転レベル。 リスクと報酬の比率を最小限に抑えた利益 確定 と 損失停止の レベルの表示     RR 1:2   。 インテリジェントな削減ロジックによるストップロス。 指定されたインジケーターから 2 つのトレンド タイプの反転パターンを表示します。 指標: トレンドを追う   TREND LINES PRO   (世界的なトレンドの変化) TREND PRO   (クイックトレンド変更) シンプルで効果的   スキャナー   リアルタイムトレンド(新機能)。 マルチタイムフレームのインストゥルメント フィルタリング。 画面   利益     LOGIC AI信号の後。 当日プラス方
Adaptive Volatility Range [AVR] is a powerful tool for identifying key trend reversal points. AVR accurately reflects the Average True Range (ATR) of volatility, taking into account the Volume-Weighted Average Price (VWAP). The indicator adapts to any market volatility by calculating the average volatility over a specific period, ensuring a stable rate of profitable trades. You receive not just an indicator but a professional automated trading system , AVR-EA . Advantages: Automated Trading Sys
説明書(ロシア語)  /  説明書 (英語)  /  バージョン MT5 主な機能: 売り手と買い手のアクティブなゾーンを表示します。 このインジケーターは、買いと売りの適切な最初のインパルスレベル/ゾーンをすべて表示します。これらのレベル/ゾーンがアクティブになると、エントリーポイントの探索が始まり、レベルの色が変わり、特定の色で塗りつぶされます。状況をより直感的に把握できるように、矢印も表示されます。 LOGIC AI - テンプレートをアクティブ化するときにエントリポイントを検索するためのゾーン(円)の表示 視認性を向上させるため、人工知能を用いて進入ポイントを探索したゾーンを表示する機能が追加されました。 より高い時間枠からのレベル/ゾーンの表示(MTFモード) より長い時間間隔でレベル/ゾーンを表示する機能を追加しました。また、インジケーターに自動トレンド検出機能(   TPSproTREND PRO   )を実装しました。 取引のための個別の専門的なステップバイステップのアルゴリズム このアルゴリズムは、トレンドの方向と逆方向の両方でデイトレードを行うために設計されていま
BTMM State Engine Pro is a MetaTrader 4 indicator for traders who use the Beat The Market Maker approach: Asian session context, kill zone timing, level progression, peak formation detection, and a multi-pair scanner from a single chart. It combines cycle state logic with a built-in scanner dashboard so you do not need the same tool on many charts at once. What it does Draws the Asian session range; session times can follow broker server offset or be set in inputs. Tracks level progression (L
Volatility Trend System - a trading system that gives signals for entries. The volatility system gives linear and point signals in the direction of the trend, as well as signals to exit it, without redrawing and delays. The trend indicator monitors the direction of the medium-term trend, shows the direction and its change. The signal indicator is based on changes in volatility and shows market entries. The indicator is equipped with several types of alerts. Can be applied to various trading ins
Looking for a powerful yet lightweight swing detector that accurately identifies market structure turning points? Want clear, reliable buy and sell signals that work across any timeframe and any instrument? Buy Sell Arrow MT Swing is built exactly for that — precision swing detection made simple and effective. This indicator identifies Higher Highs (HH) , Higher Lows (HL) , Lower Highs (LH) , and Lower Lows (LL) with remarkable clarity. It is designed to help traders easily visualize market stru
現在40%OFF! 初心者やエキスパートトレーダーのためのベストソリューション! このダッシュボードソフトウェアは、28の通貨ペアで動作しています。それは私達の主要な指標(高度な通貨の強さ28と高度な通貨インパルス)の2に基づいています。それは全体の外国為替市場の大きい概観を与えます。それは、すべての(9)時間枠で28の外国為替ペアのための高度な通貨の強さの値、通貨の動きの速度と信号を示しています。チャート上で1つのインディケータを使用して市場全体を観察し、トレンドやスキャルピングの機会をピンポイントで見つけることができたら、あなたのトレードがどのように改善されるか想像してみてください。 このインディケータには、強い通貨と弱い通貨の識別、潜在的な取引の識別と確認がより簡単になるような機能が搭載されています。このインディケータは、通貨の強さや弱さが増加しているか減少しているか、また、すべての時間枠でどのように機能しているかをグラフィカルに表示します。 新機能として、現在の市場環境の変化に適応するダイナミックなマーケットフィボナッチレベルが追加され、すでに当社のAdvanced
このインジケーターを購入すると、プロ仕様のトレードマネージャーを無料で差し上げます。 まず第一に、このトレーディングシステムがノンリペイント、ノンリドロー、ノンラグのインジケーターであることを強調する価値がある。これにより、手動取引とロボット取引の両方に理想的なものになっています。 オンラインコース、マニュアル、プリセットのダウンロード。 「スマートトレンドトレーディングシステム MT5」は、新規および経験豊富なトレーダー向けにカスタマイズされた包括的なトレーディングソリューションです。10以上のプレミアムインジケーターを組み合わせ、7つ以上の堅実なトレーディング戦略を備えており、多様な市場状況に対応する多目的な選択肢となっています。 トレンドフォロー戦略:トレンドを効果的に乗り越えるための正確なエントリーとストップロス管理を提供します。 リバーサル戦略:潜在的なトレンドの反転を特定し、トレーダーがレンジ相場を活用できるようにします。 スキャルピング戦略:高速で正確なデイトレードおよび短期取引のために設計されています。 安定性:すべてのインジケーターはノンリペイント、ノンリドロー、ノ
Trend Screener
STE S.S.COMPANY
4.79 (95)
トレンドインジケーター、1つのツールに組み込まれたすべての重要なトレンド機能を備えたトレンドトレーディングとフィルタリングのための画期的なユニークなソリューション! これは、すべてのシンボル/商品(外国為替、商品、暗号通貨、インデックス、株式)で使用できる100%再描画されていないマルチタイムフレームおよびマルチ通貨インジケーターです。 期間限定オファー: サポートおよびレジスタンス スクリーナー インジケーターは、たった 50 ドルで永久的にご利用いただけます。(元の価格 250 ドル) (オファー延長) トレンドスクリーナーは、チャート内のドットで矢印トレンドシグナルを提供するインジケーターに続く効率的なインジケーターです。 トレンド分析インジケーターで使用できる機能: 1.トレンドスキャナー。 2.最大利益分析を備えたトレンドライン。 3.トレンド通貨強度メーター。 4.アラート付きのトレンド反転ドット。 5.アラート付きの強いトレンドドット。 6.トレンド矢印 毎日の分析例、毎日のシグナルパフォーマンス...など、トレンドスクリーナーインジケーターを使用して、ここで見つけること
GEM Signal Pro GEM Signal Pro は、MetaTrader 4 向けのトレンドフォロー型インジケーターです。より明確なシグナル、より整理されたトレードセットアップ、そして実用的なリスク管理をチャート上で確認したいトレーダーのために設計されています。 単純な矢印だけを表示するのではなく、GEM Signal Pro はトレード全体の考え方を、より見やすく分かりやすい形で表示します。条件が確認されると、インジケーターはエントリー価格、ストップロス、利確目標をチャート上に表示し、トレードセットアップをより効率的に確認できるようにします。 動作の仕組み このインジケーターは、まず内部ロジックに基づいて有効なシードシグナルを検出します。 確認条件が満たされると、GEM Signal Pro はチャート上に完全なセットアップを表示します。これにより、トレーダーはトレード構造をより明確に把握し、手作業による分析を減らすことができます。 チャート上のトレードレベル 確認済みシグナルに対して、GEM Signal Pro は以下を表示できます。 エントリー価格 ストップロス テ
FX Power: 通貨の強弱を分析して、より賢い取引を実現 概要 FX Power は主要通貨と金の実際の強弱をあらゆる市場状況で理解するための必須ツールです。強い通貨を買い、弱い通貨を売ることで、 FX Power は取引の意思決定を簡素化し、高い確率の取引機会を見出します。トレンドを追従する場合でも、極端なデルタ値を使用して反転を予測する場合でも、このツールはあなたの取引スタイルに完全に適応します。ただ取引するだけではなく、 FX Power で賢く取引をしましょう。 1. なぜ FX Power がトレーダーにとって非常に有益なのか 通貨と金のリアルタイム強弱分析 • FX Power は主要通貨と金の相対的な強弱を計算し、マーケットダイナミクスに関する明確な洞察を提供します。 • どの資産がリードしているか、または後れを取っているかを監視して、取引するペアを賢く選びましょう。 マルチタイムフレームの包括的なビュー • 短期、中期、長期のタイムフレームで通貨と金の強弱を追跡し、マーケットトレンドに基づいて取引戦略を調整できます。 • スキャルピングからスイングトレード
Introduction Harmonic Patterns are best used to predict potential turning point. Traditionally, Harmonic Pattern was identified manually connecting peaks and troughs points in the chart. Manual harmonic pattern detection is painfully tedious and not suitable for everyone. You are often exposed under subjective pattern identification with manual pattern detection. To avoid these limitations, Harmonic Pattern Plus was designed to automate your harmonic pattern detection process. The functionality
CRT Multi-Timeframe Market Structure & Liquidity Sweep Indicator Non-Repainting | Multi-Asset | MT5 Version Available MT5 Version:   https://www.mql5.com/en/market/product/162075 Full User Guide — explains what each feature does and why:   https://www.mql5.com/en/blogs/post/767525 Quick Start User Guide  — explains how to configure and in what order:  https://www.mql5.com/en/blogs/post/767540 Indicator Overview CRT Ghost Candle HTF Fractal is a complete institutional-grade market structure too
Hi, I made one of best sygnalizators on a stock markets. It's prepared for a pro players. There is not even, a one mistake. It works on every timeframe and every stock market. Test it before you say something, in my 7 years I check houndreds of fakes. This one work right in time, not in slow motions. It' s a dot with 3 levels of strong power depends on how strong market is. If power is high you have very profitable results but the most important it's allways on time. So it is protecting your acc
The Reversal Master is an indicator for determining the current direction of price movement and reversal points. The indicator will be useful for those who want to see the current market situation better. The indicator can be used as an add-on for ready-made trading systems, or as an independent tool, or to develop your own trading systems. The Reversal Master indicator, to determine the reversal points,  analyzes a lot of conditions since the combined analysis gives a more accurate picture of t
作者のその他のプロダクト
The indicator for Forex and Binary options is based on 2 standard indicators in MT4: ADX and RVI. The signals are received when the lines of both indicators intersect simultaneously. But the reverse of the signals is also written into the codes. This is when the signals are converted in the opposite direction. You can also enable and disable each of the indicators. And also 2 types of signals can be used in RVI: 1) Just when one line is above/below the other (this is good to use as a recoilles
The arrow indicator for Forex and Binary options is based on tick volumes. Unlike many volume indicators, the "Super volumes" indicator calculates bullish and bearish volumes and gives signals based on the predominance of any of them. If, say, there was an advantage of bullish volumes in this range at the moment, then the signal will be on Buy. Or if the predominance was bearish volumes, then, accordingly, the signal will be on Sell. In the indicator settings in the "volumes" variable, you can
The arrow indicator "Anaconda LD" is a reversal indicator for the Forex market and mainly for Binary options. The algorithm is written on the basis of reversal patterns. It is better to use it together with other indicators to filter signals. Even with the standard ones in MT4, even with other custom ones. Any channel indicators or level indicators are especially suitable... You need to select your expiration time for different assets. Which are 1-5 bars on different pairs.
The arrow indicator for Binary Options and Forex is a reversal indicator. Created and written on the basis of reversal patterns. It is recommended for Binary Options to put it on the M5 chart. Enter into transactions for 1-3 bars. Depending on the trading sessions, you need to select your expiration time for a different asset.  You can change settings in external variables. Thus, you can both increase and decrease the frequency of signals. The arrows of the indicator do not draw at all. So you
The arrow indicator "Create a cool signal" for the Binary options and Forex market is a kind of constructor of its signals! In which you can choose your own signal conditions based on 10 standard MT4 indicators prescribed in it, plus another third-party buffer indicator that you can add to the "buffer indicators" variable. This is done simply! Prescribe the name of your indicator and prescribe its numbers (you will find them in the colors section where the numbers up to the buffer color are in
バイナリオプションと外国為替"高速道路の利益"の指標は、チャネルラインの背後にある価格を見つけるという原則に基づいています。 価格がチャネルを離れ、徐々にそれに戻り始めた後、信号が表示されます。 そのような指標を取引することは非常に簡単で便利です。 そして、初心者のトレーダーや長年の経験を持つトレーダーでさえ、それを取引することができます。 アセットごとに独自の設定を選択する必要があります。 たとえば、変数"A_Period"に設定されているトレンドのバーを計算するための期間です。 トレンドは、チャネルの中央の線で示されます。 緑の色は購入を意味し、赤い色は販売を意味します。 また、"Range"変数で設定されている異なる取引セッションでチャネル幅を調整する必要があります。 その中のデジタル値が高いほど、チャンネルは広くなります。 さて、下の変数では、便利な矢印と線のパラメータを選択できます。 厚さ、バーからの矢印の距離、それらのコードと色。 矢印はリアルタイムでは描画されません。 彼らはバーからバーにジャンプして消えることはありません。 しかし、タイムスタンプを切り替えた後
矢印インジケーター「クールボリューム」は、Mt4のティックボリュームに基づいています。 インジケータ自体は、一定期間(時間枠の選択)で購入または売却するボリュームの数を追跡します。 そして、売り手または買い手の量が異常に過剰になると、それは売るか買うためのシグナルを与えます。 色付きのヒストグラムは下のウィンドウに描かれており、緑色は現時点での買い手の優位性を示しています。これは、この価格帯で増加する可能性のある即時の逆転を意味します。 逆に、赤い色は売り手の優位性を示しており、これは潜在的な即時の下向きの逆転を意味します。 また、視覚的な利便性のために、矢印がメインチャートウィンドウに直接追加されました。 ユーザーの便宜のために、外部変数には、信号の周波数と履歴(HistoryBars)上のそれらの数の設定変数が含まれています。 ただし、値を1000を超えるように設定することはお勧めしません。 これの多くはあなたの端末のパフォーマンスを遅くします。 また、"===<<矢印設定>>>==="セクションでは、任意の矢印とヒストグラムパラメータを自分で設定することができます。
The Space signals signal indicator is my new development for trading on the Forex and Binary options markets. The algorithm of the indicator is written so that it tracks the trend and gives signals for the end of the corrective price movement. In the settings, you can set the signal period yourself. The higher the value in the "period" variable, the less frequent the signals will be. But they will naturally be of higher quality.  You can also choose the arrow codes on the chart, the distance
The indicator for Forex and Binary Options trading is based on the standard Mt4 Simple Moving Average indicator. But the difference from the standard indicator is that its lines are repainted in different colors depending on the state of the trend. If the color is green, then the trend is to buy. If it's red, then it's for sale. During a trend phase change, an audio alert appears along with a buffer on the chart in the middle of the lines. Thus, it is possible to determine the state of the trend
The new Dynamic PACK Hi Tf indicator is based on tick volumes. The middle line shows the average price for the selected period of the selected senior timeframe. The upper and lower lines show the maximum/minimum of the same selected period of the same timeframe. In the settings, the user can optionally choose which timeframe and bar calculation period he needs. You can also change the style, thickness, and color of each of the lines.  In the "StsrtBars" parameter, you can select the start peri
The Level DELTA indicator for MetaTrader 4 (MT4) – a powerful volume analysis tool that stands out with its capabilities and accuracy. Indicator Description The Level DELTA indicator is designed for volume analysis in a separate MT4 window. Its main task is to identify and display divergences, allowing traders to make more informed and timely decisions. Indicator Features Volume Analysis : The indicator analyzes volumes in financial markets, allowing you to see how volumes are distributed over d
POC, Volume Profile, Market Profile, Volume Indicator, Dynamic POC, Tick Volume, Forex Volume The Dynamic POC Hi Tf Arrow indicator is a reliable volume analysis tool (volume profile, market profile, tick volume) for accurately determining POC levels and price reactions. Dynamic POC Hi Tf arrow for MT4 Description Dynamic POC Hi Tf arrow is a professional volume analysis indicator designed to accurately identify key price levels and market direction. It is built on tick volume data and displ
Quantum Empire GRID PRO - Next Generation Trading System Revolutionary Trading Technology Quantum Empire GRID PRO represents a breakthrough in automated trading, combining intelligent grid strategy with averaging system and signal filtering. After 2+ years of real-market testing, this EA has proven its stability and profitability across various asset classes. Key Features: Smart Averaging System : When closing a series of trades, profit averages 3:1 relative to losses 4 Signal Mode
Quantum Dynamic POC Hi Tf for MT5 Description: The "Quantum Dynamic POC Hi Tf" is a unique indicator developed for volume analysis. It is suitable for both real volumes (on futures contracts) and tick volumes (on the Forex market). The indicator is a channel tool consisting of three lines that dynamically change depending on the selected timeframe: Middle Line : the main dynamic Point of Control (POC), which reflects the average volume price. Upper Line : the maximum of the selected timeframe. L
The Quantum   DELTA indicator for MetaTrader 5 (MT5) – a powerful volume analysis tool that stands out with its capabilities and accuracy. Indicator Description The Quantum   DELTA indicator is designed for volume analysis in a separate MT5 window. Its main task is to identify and display divergences, allowing traders to make more informed and timely decisions. Indicator Features Volume Analysis : The indicator analyzes volumes in financial markets, allowing you to see how volumes are distribute
Title: MACD Signals Discover the MACD Signals indicator – your reliable assistant in the world of trading! Description: The "MACD Signals" indicator is designed to make your trading more successful and efficient. It displays signals on the main chart as bright vertical lines that are easy to spot. You can customize the color and thickness of these lines to perfectly match your style and preferences. Features: Signals: Vertical lines on the main chart that stand out among other elements.
フィルタ:
レビューなし
レビューに返信