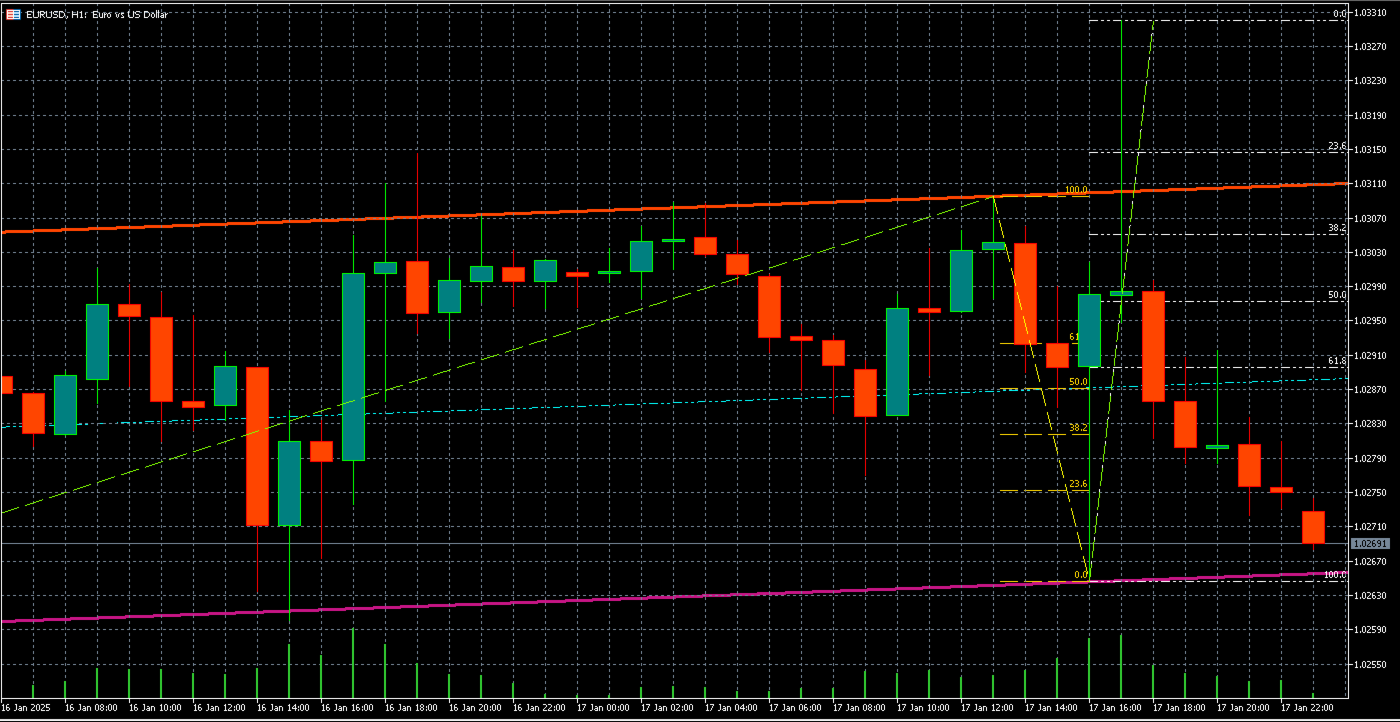
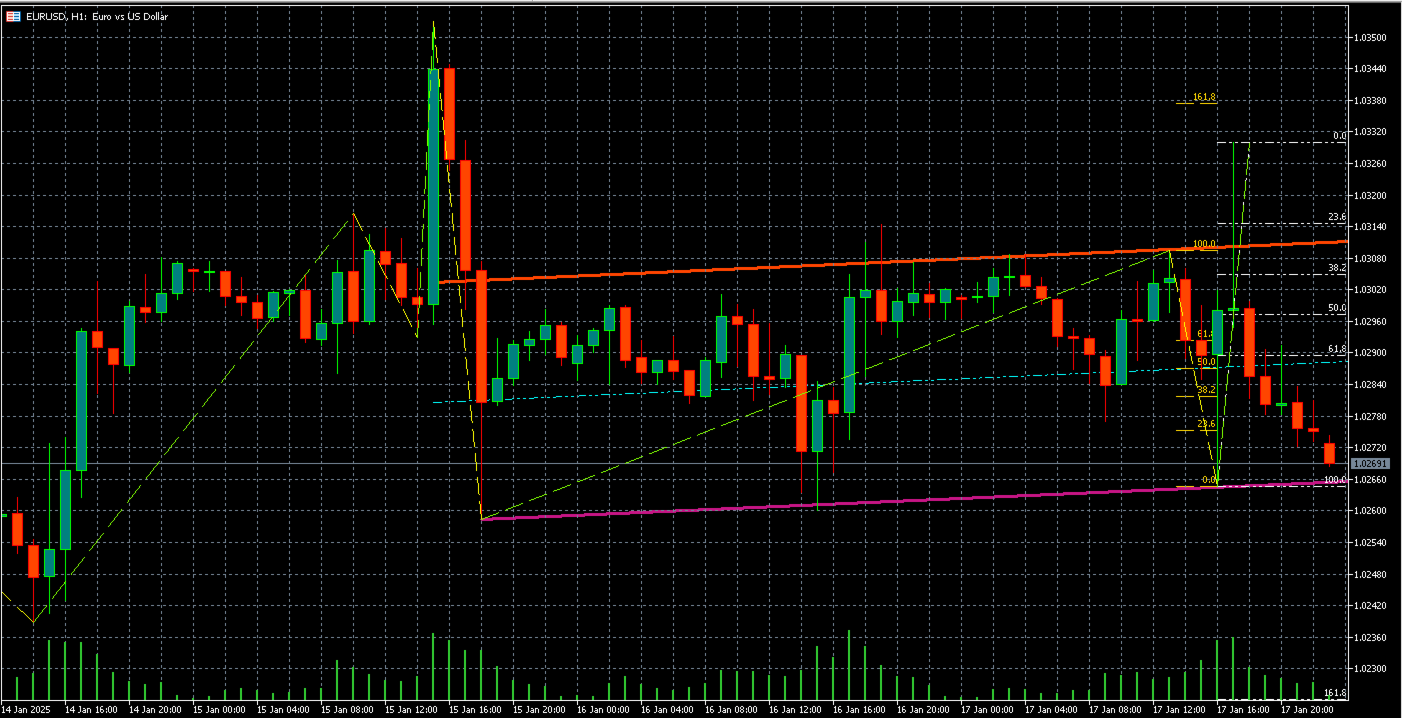
ParabolicSAR Fibo Channel

ParabolicSAR_Fibo_Channel is an indicator built not on the price deviation from the last extremum, as in a regular similar filter, but on the readings of Parabolic SAR and its intersection with the price chart. As a result, the indicator has a smaller delay in determining a new reversal point. In addition, the filter very conveniently built in Fibonacci levels, which are built on the basis of three consecutive ZigZag peaks, as well as a channel built on the same points. As a result, this indicator becomes a very good independent indicator - a trading strategy that can be successfully used in medium-term trading. However, as always, it requires work on setting the parameters for each currency pair and timeframe.


おすすめのプロダクト
Auto Fractal Support And Resistance is a powerful multi-timeframe indicator designed for traders who want to trade lower timeframes with higher timeframe accuracy. When your mouse cursor is on a line you can easily see fractal describtion and index of fractal candle  and timeframe of that fractal candle.  This indicator automatically detects H1 and D1 fractal levels and draws clean horizontal support and resistance lines on any lower timeframe chart (M1, M5, M15, M30). Now you can see where the
CosmiCLab SMC FIBO CosmiCLab SMC FIBO is a professional trading indicator designed for traders who use Smart Money Concepts (SMC), market structure analysis and Fibonacci retracement levels. The indicator automatically detects market swings and builds Fibonacci levels based on the latest impulse movement. It also identifies market structure changes such as BOS (Break of Structure) and CHOCH (Change of Character), helping traders understand the current market direction. CosmiCLab SMC FIBO also pr
これは、価格ラベル付きのAdvanced ZigZagDynamic および/または ExtendedFractals インジケーターの極値に基づくサポートおよびレジスタンスレベルのMTFインジケーターです(無効にすることができます)。 MTFモードでは、より高いTFを選択できます。デフォルトでは、レベルはZigZagインジケータードットに基づいて生成されます。フラクタルインジケータードットは、ZigZagと一緒に、またはその代わりに使用することもできます。使用を簡素化し、CPU時間を節約するために、計算はバーの開口部ごとに1回実行されます。 パラメーター: ForcedTF-レベル計算のチャート時間枠(現在の時間枠と等しいか、それを超える場合があります) MinPipsLevelWidth-ポイント単位の最小レベル幅(非常にタイトなレベルに使用) Use ZigZag Extremums points -ZigZagピークを使用してサポート/抵抗レベルを計算することを有効/無効にします Fixed pips range -ジグザグインジケーターを計算するための最小値と最大値の間の距離
Support & Resistance indicator is a modification of the standard Bill Williams' Fractals indicator. The indicator works on any timeframes. It displays support and resistance levels on the chart and allows setting stop loss and take profit levels (you can check the exact value by putting the mouse cursor over the level). Blue dashed lines are support level. Red dashed lines are resistance levels. If you want, you can change the style and color of these lines. If the price approaches a support lev
This is an advanced multi-timeframe version of the popular Hull Moving Average (HMA) Features Two lines of the Hull indicator of different timeframes on the same chart. The HMA line of the higher timeframe defines the trend, and the HMA line of the current timeframe defines the short-term price movements. A graphical panel with HMA indicator data from all timeframes at the same time . If the HMA switched its direction on any timeframe, the panel displays a question or exclamation mark with a tex
SMC Venom Model BPR インジケーターは、スマート マネー (SMC) コンセプトで取引するトレーダー向けのプロフェッショナル ツールです。価格チャート上の 2 つの主要なパターンを自動的に識別します。 FVG   (フェアバリューギャップ) は、3 本のローソク足の組み合わせで、最初のローソク足と 3 番目のローソク足の間にギャップがあります。ボリュームサポートのないレベル間のゾーンを形成し、価格修正につながることがよくあります。 BPR   (バランス価格範囲) は、2 つの FVG パターンの組み合わせで、「ブリッジ」を形成します。これは、価格がボリュームアクティビティの少ない動きで動くときに、ブレイクアウトしてレベルに戻るゾーンで、ローソク足の間にギャップを作成します。 これらのパターンは、大規模な市場プレーヤーと一般参加者の相互作用が発生するチャート上のボリュームと価格動向の分析に基づいて、トレーダーが主要なサポート/レジスタンス レベル、ブレイクアウト ゾーン、エントリ ポイントを識別するのに役立ちます。 インジケーターは、長方形と矢印の形でパターンを視覚
CRT Candle Range Theory HTF MT5.   Ultimate CRT Indicator: Advanced ICT Concepts and Malaysian SnR Trading System Discounted   Price $50  !!     Secure your lifetime access now before it switches to subscription-only ! Master the Market Maker's Footprints with the Most Advanced Candle Range Theory Indicator Unlock the true power of Smart Money Concepts (SMC) and trade precisely like the institutions with the Ultimate CRT Indicator . Built exclusively for serious traders, this indicator automates
サポート線と抵抗線のプロットにうんざりしていませんか? サポートレジスタンス は、非常に興味深いひねりを加えてチャート内のサポートとレジスタンスラインを自動検出およびプロットするマルチタイムフレームインジケーターです。価格レベルは時間とともにテストされ、その重要性が高まるにつれて、ラインは太くなり、暗くなります。 [ インストールガイド | 更新ガイド | トラブルシューティング | よくある質問 | すべての製品 ] 一晩でテクニカル分析を強化 チャートを閲覧せずに重要な価格レベルを検出 一目ですべての価格レベルの相対的な強さを認識する すべての取引で最大30時間のプロットラインを節約 インジケーターは、すべての価格レベルの年齢を表示します インジケーターは再描画されていません 過去および現在の価格レベルは近接によって崩壊し、現在の市場行動に合わせて調整されます。動作は、必ずしもピークではない場所に線が引かれます。 価格レベルは、時間とともに拒否されるにつれて、より暗く、より広くなります ノイズを避けるために、重要でない価格レベルは定期的にクリアされます カスタマイズ可能な時間枠の
GEN TrendPivot Hunter Developer: Gede Egi Overview GEN TrendPivot Hunter is a multifunctional indicator for MetaTrader 5. It combines Pivot-based Support & Resistance, Fair Value Gaps (FVG), and Trendlines into one analytical tool. The indicator helps visualize possible price reaction areas and market structures directly on the chart. All drawing styles, alerts, and notifications can be customized through the input parameters. The tool does not generate trading signals automatically; it is inte
Support & Resistance Zone Indicator This indicator dynamically identifies and draws support and resistance zones based on recent price action and fractal patterns. By analyzing ZigZag pivot points and tracking price reactions (touches, bounces, and breaks), the indicator determines the strength and validity of each zone. Key Features: Multi-Timeframe Support: Can work across different timeframes. Fractal-Based Detection: Utilizes both fast and slow fractal detection to find significant swing po
Noize Absorption Index - is the manual trading system that measures the difference of pressure between bears forces and bulls forces. Green line - is a noize free index that showing curent situation. Zero value of index shows totally choppy/flat market.Values above zero level shows how powerfull bullish wave is and values below zero measures bearish forces.Up arrow appears on bearish market when it's ready to reverse, dn arrow appears on weak bullish market, as a result of reverse expectation.
Mine Farm is one of the most classic and time-tested scalping strategies based on the breakdown of strong price levels. Mine Farm is the author's modification of the system for determining entry and exit points into the market... Mine Farm - is the combination of great potential with reliability and safety. Why Mine Farm?! - each order has a short dynamic Stop Loss - the advisor does not use any risky methods (averaging, martingale, grid, locking, etc.) - the advisor tries to get the most
MetaTraderでは、複数の   水平線   を描画し、それぞれの価格レベルを追跡するのは面倒な作業になることがあります。このインジケーターは、価格アラートの設定、サポートとレジスタンスの表示、その他の手動用途のために、等間隔で複数の水平線を自動で描画します。 このインジケーターは、短期間で売買による利益を狙いたい初心者のFXトレーダーに最適です。水平線は、相場がトレンド中またはレンジ相場である場合に、エントリーの可能性があるゾーンを見つける手助けをしてくれます。 機能 入力設定に基づいて、瞬時に複数の水平線を描画可能。 各水平線を区別しやすいように、カラフルなカラーテーマを採用。 複数の取引セッションのレンジを追跡するのに必須のツール。 価格が水平線にタッチした際にアラートを送信。 アラート間に間隔を設定でき、過度な通知を防止。 完全にカスタマイズ可能。 解説 このインジケーターは、入力設定で指定されたデータと指示に従って水平線を描画します。価格がこれらの水平線でどのように反応するかを観察することで、重要なサポート・レジスタンス付近でのトレード機会を見極めることができます。
Your Trend Friend
Luigi Nunes Labigalini
5 (1)
The trend is your friend! Look at the color of the indicator and trade on that direction. It does not  repaint. After each candle is closed, that's the color of the trend. You can focus on shorter faster trends or major trends, just test what's most suitable for the symbol and timeframe you trade. Simply change the "Length" parameter and the indicator will automatically adapt. You can also change the color, thickness and style of the lines. Download and give it a try! There are big movements w
RBreaker Gold Indicatorsは、金先物の短期日内取引戦略であり、トレンドフォローと日内反転の2つの取引手法を組み合わせたものです。トレンド相場での利益を捉えるだけでなく、相場が反転した際には迅速に利確し、その流れに沿ってポジションを反転させることができます。 この戦略は、アメリカの雑誌『Futures Truth』において、15年連続で最も収益性の高い取引戦略トップ10に選ばれた実績を持ち、非常に長いライフサイクルを誇り、現在も国内外で広く使用・研究されています。 本インディケーターは、2026年の金先物の値動きに対応し、14日間のATR指標に基づいて、ブレイクアウト係数A、観察係数B、リバーサル係数Rをより合理的な値で定義しています。非常に優れたインディケーターであり、安定的な年間収益を実現しています。ぜひおすすめします〜
DYJ BoS インジケーターは、次のような市場構造の変化の主な要素を自動的に識別してマークします。 構造のブレイクアウト (BoS): 価格が大きく変動し、構造の前のポイントを突破したときに発生します。 彼は上昇トレンドと下降トレンドの可能性のあるライン(UP と DN、つまり連続した新高値と新安値)をマークし、価格がこれらのラインを突破すると、赤(弱気)と緑(強気)の矢印でマークします。 BoS は通常、価格が以前の価格変動によって確立されたスイング安値または高値を決定的に突破したときに発生します。価格がスイング高値を上回ったりスイング安値を下回ったりすると、単に以前に形成された市場構造から抜け出すだけなので、「ブレイクアウト」構造と呼ばれます。これは多くの場合、市場センチメントとトレンドの方向の変化を示し、既存のトレンドの継続または新しいトレンドの始まりを示唆します。 ポジションのクローズの精度を高めるために、通常はストップロスとテイクプロフィットを設定しないことが推奨されます。最終ポジションは通常、同じ方向の次のブレイクスルー ポイント、または反対方向のブレイクスルー
Hunter’s Scope: ボラティリティおよびトレンド強度インジケーター (MT5) Hunter’s Scopeは、方向性の強さとボラティリティの両方をフィルタリングすることで価格拡大を特定する、MetaTrader 5用の高モメンタムインジケーターです。重要なインパルス(衝動)的なローソク足を検出し、モメンタムトレードのための明確かつ客観的なシグナルを提供します。 コアロジック:二層フィルター 遅行性のクロスオーバーではなく、以下の二段階確認モデルを使用します: トレンド強度 (ADX): ADXがユーザー定義のしきい値を超えた場合のみシグナルが発生し、レンジ相場や低モメンタム市場を除外します。 ボラティリティ拡大 (ATR): 特定のATR倍率を超えたローソク足のみをインパルスと見なし、統計的に有意な動きであることを保証します。 主な特徴 非再描画: ローソク足確定時にシグナルが生成され、固定されます。 モメンタム重視: 反応遅延型のインジケーターではなく、インパルス的な動きを狙います。 統合診断パネル: ADX、ATRしきい値、ローソク足サイズをリアルタイムで表示。 クリ
Auto Optimized RSI   は、正確な売買シグナルを提供するために設計された、使いやすいスマートな矢印インジケーターです。過去のデータを使ったトレードシミュレーションに基づき、各通貨ペアや時間足に最適なRSIの買い/売りレベルを自動で見つけ出します。 このインジケーターは、独立したトレードシステムとしても、既存の戦略の一部としても使用できます。特に短期トレーダーにとって便利なツールです。 従来のRSI(70/30など)の固定レベルとは異なり、 Auto Optimized RSI   はリアルな価格の動きとバックテスト結果に基づき、ダイナミックにレベルを調整します。勝率、ドローダウン、平均利益/損失といった重要な統計をモニターし、現在の市場に適応して、本当に機能するシグナルを提供します。 RSIが最適化されたレベルをクロスすると、チャート上に買い・売りの矢印が表示され、成功率の高いエントリーポイントを見つけるのに役立ちます。 ご購入後にご連絡いただければ、追加のツールや特別なトレードのヒントを無料でお渡しいたします! 皆様のトレードが成功しますように!
Swing Points Pro v2 – Enhanced Highs and Lows Indicator with Push Notifications Overview : The Swing Points Pro v2 indicator is a powerful and reliable tool designed to help traders identify critical swing highs and lows on their charts. Whether you trade Forex, Stocks, or Crypto, this updated version provides advanced features to enhance your market analysis, with real-time push notifications for key market movements. Key Features : Accurate Swing Identification : Pinpoints major swing highs a
Caicai L&S Yield Histogram Important Notice: This indicator is an integral tool of the automated EA Caicai Long and Short Pair Trading . This indicator visually displays the percentage deviation (Yield %) of a pair's current spread relative to its own historical mean. It is an excellent tool for quickly visualizing the gross financial potential of a market distortion in Long & Short operations. Main Features: Percentage Visualization: Understand the size of the distortion in palpable percentage
Indicator Name: Fibaction – price action candle Detector Description: Fibo Signal Boxes is a powerful Smart Money Concept (SMC)-inspired indicator that auto-detects price action candles. bullish hammers and shooting stars, then draws precise Fibonacci entry zones and multiple take-profit levels directly on the chart. as for the SL personally i use 40 pips rules  Key Features: Detects bullish hammer and shooting star reversal candles. Automatically draws Fibonacci entry and TP boxes. as
**   All Symbols   x   All Timeframes   scan just by pressing scanner button ** Discount: The price is $50$, But now it is just $39, Limited time offer is active. *** Contact me  to send you instruction and add you in "Trend Reversal group" for sharing or seeing experiences with other users. Introduction: Trendlines are the most famous technical analysis in trading . Trendlines continually form on the charts of markets across all the different timeframes providing huge opportunities for traders
ProEngulfingの無料バージョンは、1日あたり1つのシグナル制限と少ない機能を備えたQualifiedEngulfingです。 mql5コミュニティのKoala Trading Solutionチャンネルに参加して、Koala製品に関する最新情報を確認してください。参加リンクはこちら: https ://www .mql5 .com /en /channels /koalatradingsolution この製品のMT4バージョンは、以下のリンクからダウンロード可能です: https ://www .mql5 .com /en /market /product /52023 ProEngulfing – MT4向けのプロフェッショナルなエンガルフパターンインジケーターの紹介 ProEngulfingは、精密なエンガルフパターンを識別し、強調表示するために設計された最先端のインジケーターで、信頼性の高いシグナルを提供します。MetaTrader 4向けに開発され、取引の意思決定に役立ちます。 ProEngulfingの仕組み: ProEngulfingは、高度なアルゴリズムを使
This Indicator enhances the default Relative Strength Index (RSI) by introducing several improvements. First, it visually highlights overbought and oversold regions by changing the RSI color from white to red. Second, it includes additional reference lines at 20, 40, 50, 60, and 80, providing a clearer framework for assessing RSI values. The most notable feature is the use of the middle 50-line to indicate the current market cycle. The color of the 50-line dynamically reflects the cycle: green f
HAS RSI Signal — SL/TP自動計算機能付き プロフェッショナル・トレンドインジケーター HAS RSI Signal は、信頼性の高いクラシックな手法と最新のノイズ除去アルゴリズムを融合させた強力なトレーディングツールです。 平均足スムーズド(Heiken Ashi Smoothed) と RSI を組み合わせることで、トレンドの転換点や買われすぎ・売られすぎ圏からの脱出タイミングを正確に捉え、明確なエントリーシグナルを提示します。 主な特徴: 二重のフィルタリング: 平均足スムーズドで市場の「ノイズ」を除去し、RSIで勢い(モメンタム)の強さを確認します。 損切り・利確ラインの自動計算: 単にシグナルを出すだけでなく、ボラティリティ( ATR )に基づいた最適なストップロス(SL) と テイクプロフィット(TP)を自動で算出します。 視覚的な分かりやすさ: シグナルはチャート上にカラーキャンドルとして表示されるため、一目でトレンドを把握でき、取引画面をスッキリと保てます。 充実の通知機能: アラート、音声、スマートフォンへのプッシュ通知機能を搭載。チャンスを逃すこと
Price Magnet — Price Density and Attraction Levels Indicator Price Magnet is a professional analytical tool designed to identify key support and resistance levels based on statistical Price Density. The indicator analyzes a specified historical period and detects price levels where the market spent the most time. These zones act as “magnets,” attracting price action or forming a structural base for potential reversals. Unlike traditional Volume Profile tools, Price Magnet focuses on price-time d
Trend Master Chart、必要なトレンド指標です。 チャートをオーバーレイし、色分けを使用してさまざまな市場のトレンド/動きを定義します。 2 つの移動平均と異なるオシレーターを組み合わせたアルゴリズムを使用します。 これら 3 つの要素の周期は変更可能です。 どの時間枠やペアでも機能します。 上昇トレンドまたは下降トレンド、およびこのトレンドへのさまざまなエントリーポイントを一目で識別できます。 たとえば、顕著な上昇トレンド (薄緑色) では、このトレンド内のさまざまな市場インパルスが濃い緑色のローソク足で表示されます。 設定可能なアラートを使用すると、これらの衝動を決して見逃すことがなくなります。 MT4のバージョンです。 入力パラメータ: Period 1: 高速期間移動平均。 Period 2: 低速期間の移動平均。 Oscillator period: オシレーター周期。 Sell/Buy alert: 市場衝動アラート、トレンドエントリーポイント。 Bullish/Bearish alert: トレンドが変化した場合のアラート。 ポップ
Basic Support and Resistance   インジケータは、テクニカル分析を強化するために必要なソリューションです。このインジケータを使用すると、チャートにサポートレベルとレジスタンスレベルを投影できます/ mt4バージョン 機能 フィボナッチレベルの統合: サポートと抵抗レベルとともにフィボナッチレベルを表示するオプションを使用すると、私たちの指標は市場行動と逆転領域の可能性についてさらに深い洞察を提供します。 パフォーマンスの最適化: 各バーの開口部のみで拡張ラインを更新するオプションを使用すると、インジケータは、サポートレベルと抵抗レベルの精度を犠牲にすることなく最適なパフォーマンスを保証します。 入力 メイン設定 Timeframe:  この入力を通じて、より高い時間枠のサポートラインとレジスタンスラインをチャート上に表示することを選択できます。 Support/Resistance Strength [Number of Bars]:   この入力を使用して、サポートと抵抗の強度を決定できます。数が高いほど、サポート/抵抗がより強くなります。 Pric
Pivot Points MT5 is a universal color multicurrency/multisymbol indicator of the Pivot Points levels systems. You can select one of its three versions: Standard Old, Standard New and Fibo . It plots pivot levels for financial instruments in a separate window . The system will automatically calculate the Pivot Point on the basis of market data for the previous day ( PERIOD_D1 ) and the system of support and resistance levels, three in each. A user can choose colors for the indicator lines. The on
Market Shift Levels This indicator detects trend shifts and visualizes key market structure turning points using Hull Moving Average logic. It highlights potential areas of support and resistance where price is likely to react, empowering traders to spot early trend transitions. Market Shift Levels   are horizontal zones that mark the moment of a directional change in market behavior. These shifts are based on crossovers between two smoothed Hull Moving Averages (HMA), allowing the indicator
このプロダクトを購入した人は以下も購入しています
SuperScalp Pro
Van Minh Nguyen
4.63 (24)
SuperScalp Pro – 高度なマルチフィルタースキャルピングインジケーターシステム SuperScalp Pro は、クラシックな Supertrend と複数のインテリジェント確認フィルターを組み合わせた高度なスキャルピングインジケーターです。M1 から H4 まで複数の時間足で効率的に動作し、XAUUSD、BTCUSD、主要 Forex 通貨ペア向けに最適化されています。 このインジケーターは明確な Buy / Sell シグナルを提供し、ATR に基づいてエントリー価格、Stop Loss、Take Profit を自動計算します。Fibonacci Take Profit 機能により、重要な価格帯で早期決済し、到達時に通知を送信します。 初期設定では Fibonacci Take Profit が有効化されており、より安定した取引体験を重視しています。チャートに適用するだけですぐ利用可能です。上級者向けに、すべてのパラメータは自由にカスタマイズできます。 EMA、RSI、ADX、Volume、VWAP、Bollinger Bands、MACD Divergence な
このインジケーターを購入された方には、以下の特典を 無料 で提供しています: 各トレードを自動で管理し、ストップロスとテイクプロフィットを設定し、戦略ルールに基づいてポジションを決済する補助ツール 「Bomber Utility」 様々な銘柄に合わせたインジケーターの設定ファイル(セットファイル) 「最小リスク」、「バランスリスク」、「待機戦略」 の3つのモードで使用できる Bomber Utility 用の設定ファイル このトレーディング戦略をすぐに導入・設定・開始できる ステップバイステップのビデオマニュアル ご注意: 上記の特典を受け取るには、MQL5のプライベートメッセージシステムを通じて販売者にご連絡ください。 オリジナルのカスタムインジケーター 「Divergence Bomber(ダイバージェンス・ボンバー)」 をご紹介します。これは、MACDのダイバージェンス(乖離)戦略に基づいた 「オールインワン」型のトレーディングシステム です。 このテクニカルインジケーターの主な目的は、価格とMACDインジケーターの間に発生するダイバージェンスを検出 し、将来の価格の動きを示す
Entry In The Zone and SMC Multi Timeframe is a real-time 2-in-1 market analysis tool that combines market structure analysis and a No Repaint BUY / SELL signal system into a single indicator, built on Smart Money Concepts (SMC) — a widely adopted framework used by professional traders to understand market structure. This indicator helps you see the market more clearly, make decisions based on structure rather than guesswork, and focus on high-probability zones where price is more likely to react
SignalTech MT5 is an unique fully rule based trading system for EURUSD, USDCHF, USDJPY, AUDUSD, NZDUSD, EURJPY, AUDJPY, NZDJPY, CADJPY.  All the winning trades with chart setups are published on the comments page. 2026-05 3173 Pips (Until 05-18 NY Closed) 2026-04 2243 Pips 2026-03 2165 Pips 2026-02 2937 Pips 2026-01 2624 Pips 2025-12 1174 Pips It can generate signals with Buy/Sell Arrows and Pop-Up/Sound Alerts. Each signal has clear Entry and Stop Loss levels, which should be automatically flag
まず正直に言いましょう。 どんなインジケーターも、それ単体であなたを利益化させることはできません。もしそう言う人がいるなら、それは夢を売っているだけです。完璧な売買シグナル(矢印)を表示するインジケーターは、いくらでも“完璧に見せる”ことができます。正しい過去の区間を拡大して、勝ちトレードだけを切り取ればいいだけです。私たちはそれをしません。 SMC Intraday Formula はツールです。 市場構造を読み取り、最も高い確率の価格ゾーンを特定し、今この瞬間のスマートマネーの痕跡をシンプルな言葉で正確に示します。最終判断はあなたが行います。トレードを実行するのもあなたです。しかし今は「希望」ではなく「精度」でエントリーできます。 私たちはこのインジケーターを、ゴールド(XAUUSD)および主要FX通貨ペアで約3年間、日々のスキャルピングに使用してきました。M1、M5、M15、M30の主要ツールです。これは未来を予測しようとするのではなく、今まさに形成されている高確率セットアップを示し、その理由を説明します。 他のすべてのインジケーターと何が違うのか? ほとんどのトレーディングイ
Power Candles V3 - 自己最適化型強弱インジケーター Power Candles V3は 、通貨や銘柄の強さを、適用されたすべてのチャート上で実行可能なトレードプランに変換します。単にローソク足を色分けするだけでなく、バックグラウンドでリアルタイムの自動最適化を実行し、目の前の銘柄に対して最適なストップロス、テイクプロフィット、およびシグナルの閾値を提示します。ワンクリックで実取引に適用でき、エントリーポイント、ストップロス、テイクプロフィットのラインが正確な価格位置にチャート上に表示され、方向性を示すアラートがリアルタイムで発動します。 このツールは、Stein Investmentsのエコシステムの一部です。  18種類以上のツールをすべて閲覧し、AIを活用したセットアップの推奨事項を入手し、  https://stein.investments でコミュニティに参加しましょう クローズしたバーごとに3,000回以上のトレードシミュレーション。9つの強さの状態。2つの戦略を並行してテスト。勝率の高い設定をワンクリックで適用。 なぜこれが必要なのか ほとんどの強
ARIPoint
Temirlan Kdyrkhan
1 (1)
ARIPoint is a powerful trading companion designed to generate high-probability entry signals with dynamic TP/SL/DP levels based on volatility. Built-in performance tracking shows win/loss stats, PP1/PP2 hits, and success rates all updated live. Key Features: Buy/Sell signals with adaptive volatility bands Real-time TP/SL/DP levels based on ATR Built-in MA Filter with optional ATR/StdDev volatility Performance stats panel (Success, Profit/Loss, PP1/PP2) Alerts via popup, sound, push, or email Cu
Gann Made Easy   は、ミスター・ギャンの理論を使用した取引の最良の原則に基づいた、プロフェッショナルで使いやすい外国為替取引システムです。 W・D・ガン。このインジケーターは、ストップロスとテイクプロフィットレベルを含む正確な買いと売りのシグナルを提供します。 PUSH通知を利用して外出先でも取引可能です。 ご購入後、取引方法の説明と優れた追加インジケーターを無料で入手するには、私にご連絡ください! おそらく、ギャンの取引手法についてはすでに何度も聞いたことがあるでしょう。通常、ギャンの理論は初心者のトレーダーだけでなく、すでにある程度の取引経験がある人にとっても非常に複雑なものです。なぜなら、ギャンの取引手法は理論的にはそれほど簡単に適用できるものではないからです。私はその知識を磨き、最良の原則を私の外国為替インジケーターに組み込むために数年を費やしました。 このインジケーターは非常に簡単に適用できます。必要なのは、それをチャートに添付し、簡単な取引推奨事項に従うだけです。このインジケーターは常に市場分析の仕事を行い、取引の機会を探します。適切なエントリーポイントを検
このインジケーターを購入すると、プロ仕様のトレードマネージャーを無料で差し上げます。 まず第一に、このトレーディングシステムがノンリペイント、ノンリドロー、ノンラグのインジケーターであることを強調する価値がある。これにより、手動取引とロボット取引の両方に理想的なものになっています。 オンラインコース、マニュアル、プリセットのダウンロード。 「スマートトレンドトレーディングシステム MT5」は、新規および経験豊富なトレーダー向けにカスタマイズされた包括的なトレーディングソリューションです。10以上のプレミアムインジケーターを組み合わせ、7つ以上の堅実なトレーディング戦略を備えており、多様な市場状況に対応する多目的な選択肢となっています。 トレンドフォロー戦略:トレンドを効果的に乗り越えるための正確なエントリーとストップロス管理を提供します。 リバーサル戦略:潜在的なトレンドの反転を特定し、トレーダーがレンジ相場を活用できるようにします。 スキャルピング戦略:高速で正確なデイトレードおよび短期取引のために設計されています。 安定性:すべてのインジケーターはノンリペイント、ノンリドロー、ノ
ご紹介     Quantum Breakout PRO は 、ブレイクアウト ゾーンの取引方法を変革する画期的な MQL5 インジケーターです。 13年以上の取引経験を持つ経験豊富なトレーダーのチームによって開発されました。     クォンタム ブレイクアウト プロ   は、革新的でダイナミックなブレイクアウト ゾーン戦略により、あなたのトレーディングの旅を新たな高みに押し上げるように設計されています。 クォンタム ブレイクアウト インジケーターは、5 つの利益ターゲット ゾーンを備えたブレイクアウト ゾーン上のシグナル矢印と、ブレイクアウト ボックスに基づいたストップロスの提案を提供します。 初心者トレーダーにもプロのトレーダーにも適しています。 量子EAチャネル:       ここをクリック 重要!購入後、インストールマニュアルを受け取るためにプライベートメッセージを送ってください。 推奨事項: 時間枠: M15 通貨ペア: GBPJPY、EURJPY、USDJPY、NZDUSD、XAUUSD アカウントの種類: ECN、Raw、またはスプレッドが非常に低い R
Azimuth Pro
Ottaviano De Cicco
5 (7)
Azimuth Pro V2:MT5向けシンセティック・フラクタル構造分析と確認済みエントリー 概要 Azimuth Pro は Merkava Labs によるマルチレベルスイング構造インジケーターです。4つのネストされたスイングレイヤー、スイングアンカーVWAP、ABCパターン検出、3タイムフレーム構造フィルタリング、そして確定バーでの確認済みエントリー — 1つのチャートで、ミクロスイングからマクロサイクルまでを網羅するワークフロー。 これはブラインドシグナル製品ではありません。ロケーション、コンテキスト、タイミングを重視するトレーダーのための構造ファーストワークフローです。 V2発売記念オファー — Azimuth Pro V2をUSD 399で(次の100本)。最終価格:USD 499。 1. V2での変更点 シンセティック・マルチタイムフレームエンジン 上位タイムフレーム分析をMeridian Proと同じ独自のシンセティックアーキテクチャで一から再構築。よりクリーンなHTFコンテキスト、安定したライブ動作、従来のMTF同期問題なし。シンセティックエンジンは 固定比率タ
トレンド スクリーナー インジケーターでトレンド取引の力を解き放ちます。ファジー ロジックと複数通貨システムを活用した究極のトレンド取引ソリューションです。 ファジー ロジックを活用した革新的なトレンド インジケーターである Trend Screener を使用して、トレンド取引を向上させます。 これは、13 を超えるプレミアム ツールと機能、および 3 つの取引戦略を組み合わせた強力なトレンド追跡インジケーターであり、Metatrader をトレンド アナライザーにする多用途の選択肢となります。 期間限定オファー : トレンド スクリーナー インジケーターは、わずか 65 ドルで生涯ご利用いただけます。 (元の価格 50$ ) (オファー延長) Trend Screener の 100% 非再描画精度の揺るぎない精度を体験して、取引の決定が過去の価格変動の影響を受けないようにしてください。 マルチタイムフレームおよびマルチ通貨機能の多用途性を解放し、比類のない自信を持って外国為替、商品、暗号通貨、インデックスの世界を取引できるようにします。 Trend Screener の包括的な戦
FX Trend NG:次世代マルチマーケット・トレンドインテリジェンス 概要 FX Trend NG は、複数の時間足に対応したプロフェッショナル向けトレンド分析およびマーケット監視ツールです。 市場全体の構造を数秒で把握することができます。 複数のチャートを切り替える必要はありません。どの銘柄がトレンド中なのか、どこでモメンタムが弱まっているのか、そしてどの時間足で強い整合性があるのかを瞬時に確認できます。 ローンチ特別オファー – FX Trend NG を $30(6ヶ月) または $80 永久ライセンス でご利用いただけます。 すでに Stein Investments のユーザーですか? -> メッセージを送信 して、プライベートグループへアクセスしてください。 セットアップや詳細情報が必要ですか? -> Stein Investments 公式ページ をご覧ください。 1. FX Trend NG が他と異なる理由 3ステート・トレンドロジック ― Buy と Sell だけではない • 多くのインジケーターは Buy または Sell の2状態のみを表示します。
Meridian Pro
Ottaviano De Cicco
5 (2)
Meridian Pro 2.00:MT5向けプロ仕様マルチタイムフレーム・トレンドマトリクス Meridian Pro 2.00 は、MetaTrader 5 向けのプロ仕様の適応型トレンドマトリクスです。オリジナルの Meridian トレンドエンジン、クリーンなチャート ribbon、確定足ベースのシグナル矢印、8時間足 dashboard、Fuel momentum、weighted consensus、synthetic HTF processing、そしてチャート上に直接表示される上位足コンテキストラインを統合します。 目的はシンプルです。現在のトレンド、マルチタイムフレーム構造、強度、momentum、EA-ready 状態を、複数チャートに無関係なインジケータを重ねるのではなく、1つの整理された workflow で読むことです。 Meridian Pro の違い 1つの適応型エンジン - 同じ volatility-aware Meridian ロジックを M1 から W1 まで適用します。 Synthetic HTF architecture - 上位足行は下位足デ
まず第一に、この取引ツールはノンリペイント、ノンリドロー、ノンラグの指標であり、プロの取引に理想的ですことを強調する価値があります。 オンラインコース、ユーザーマニュアル、デモ。 スマートプライスアクションコンセプトインジケーターは、新米から経験豊富なトレーダーまで、非常 に強力なツールです。Inner Circle Trader AnalysisやSmart Money Concepts Trading Strategiesなど、20以上の有用な指標を1つに組み合わせています。このインジケーターはスマートマネーコンセプトに焦点を当て、大手機関の取引方法を提供し、彼らの動きを予測するのに役立ちます。 特に、流動性分析に優れており、機関がどのように取引しているかを理解しやすくしています。市場のトレンドを予測し、価格の動きを慎重に分析するのに優れています。機関の戦略とトレードを合わせることで、市場の動向についてより正確な予測ができます。このインジケーターは多目的であり、市場構造を分析し、重要な注文ブロックを特定し、さまざまなパターンを認識するのに優れています。 このインジケーター
Market Structure Order Block Dashboard MT5 は、市場構造と主要な価格反応ゾーンをチャート上で直接読み取りたいトレーダー向けに設計された MT5 インジケーターです。BOS、ChoCH、オーダーブロック、Fair Value Gap (FVG)、流動性、Kill Zones、Volume Profile、そして素早い分析のためのコンパクトなダッシュボードを組み合わせています。 本インジケーターは、市場構造、ICT、Smart Money の概念を意思決定の枠組みとして使用するトレーダーを対象としています。トレンド継続、反転の可能性、価格の不均衡、流動性ターゲット、注目ゾーンをより構造的に特定する助けとなります。 購入者向けの付属リソース 購入後、MQL5 のプライベートメッセージにてご依頼いただくと、完全な PDF ユーザーガイドとパラメータ設定のヒントを提供いたします。MQL5 のプライベートメッセージによる直接的な技術サポート。 バージョン 1.20 では 2 つの重要な追加機能があります: Pending BOS / Pending Cho
FX Power: 通貨の強弱を分析して、より賢い取引を実現 概要 FX Power は主要通貨と金の実際の強弱をあらゆる市場状況で理解するための必須ツールです。強い通貨を買い、弱い通貨を売ることで、 FX Power は取引の意思決定を簡素化し、高い確率の取引機会を見出します。トレンドを追従する場合でも、極端なデルタ値を使用して反転を予測する場合でも、このツールはあなたの取引スタイルに完全に適応します。ただ取引するだけではなく、 FX Power で賢く取引をしましょう。 1. なぜ FX Power がトレーダーにとって非常に有益なのか 通貨と金のリアルタイム強弱分析 • FX Power は主要通貨と金の相対的な強弱を計算し、マーケットダイナミクスに関する明確な洞察を提供します。 • どの資産がリードしているか、または後れを取っているかを監視して、取引するペアを賢く選びましょう。 マルチタイムフレームの包括的なビュー • 短期、中期、長期のタイムフレームで通貨と金の強弱を追跡し、マーケットトレンドに基づいて取引戦略を調整できます。 • スキャルピングからスイングトレード
GEM Signal Pro GEM Signal Pro は、MetaTrader 5 向けのトレンドフォロー型インジケーターです。より明確なシグナル、より整理されたトレードセットアップ、そして実用的なリスク管理をチャート上で確認したいトレーダーのために設計されています。 単純な矢印だけを表示するのではなく、GEM Signal Pro はトレード全体の考え方を、より見やすく分かりやすい形で表示します。条件が確認されると、インジケーターはエントリー価格、ストップロス、利確目標をチャート上に表示し、トレードセットアップをより効率的に確認できるようにします。 動作の仕組み このインジケーターは、まず内部ロジックに基づいて有効なシードシグナルを検出します。 確認条件が満たされると、GEM Signal Pro はチャート上に完全なセットアップを表示します。これにより、トレーダーはトレード構造をより明確に把握し、手作業による分析を減らすことができます。 チャート上のトレードレベル 確認済みシグナルに対して、GEM Signal Pro は以下を表示できます。 エントリー価格 ストップロス テ
これはMT5のインジケーターで、再描画なしで取引に参入するための正確なシグナルを提供します。 外国為替、暗号通貨、金属、株式、インデックスなど、あらゆる金融資産に適用できます。かなり正確な見積もりを提供し、取引を開始して終了するのに最適な時期を教えてくれます。1つのシグナルを処理しただけでインジケーターの元が取れた例の 動画 (6:22)をご覧ください。Entry PointsPro インジケーターの助けを借りたほとんどのトレーダーの最初の1週間の結果が改善しています。 Telegramグループ に登録してください。Entry Points Proインジケーターのメリットは次の通りです。 再描画のないエントリーシグナル 再描画されるインジケーターでは一度表示されたシグナルが削除されて大きな金銭的損失につながることがありますが、これと異なり、表示されて確認されたシグナルは消えることがありません。 エラーなしの取引開始 インジケーターアルゴリズムによって取引を開始する(資産を売買する)理想的な瞬間を見つけることができます。それを使用するすべてのトレーダーの成功率が向上します。 あら
BTMM State Engine Pro is a MetaTrader 5 indicator for traders who use the Beat The Market Maker approach: Asian session context, kill zone timing, level progression, peak formation detection, and a multi-pair scanner from a single chart. It combines cycle state logic with a built-in scanner dashboard so you do not need the same tool on many charts at once. What it does Draws the Asian session range; session times can follow broker server offset or be set in inputs. Tracks level progression (L
まず第一に、この取引インジケーターは再描画されず、再描画されず、遅延しないことを強調する価値があります。これにより、手動取引とロボット取引の両方に理想的なものになります。 ユーザーマニュアル:設定、入力、戦略。 アトミックアナリストは、価格の強さとモメンタムを利用して市場でより良いエッジを見つけるためのPA価格アクションインジケーターです。ノイズや誤ったシグナルを除去し、取引ポテンシャルを高めるための高度なフィルターを備えています。複雑なインジケーターの複数のレイヤーを使用して、アトミックアナリストはチャートをスキャンし、複雑な数学的計算をシンプルなシグナルと色に変換します。これにより、どのような初心者トレーダーでも理解して使用し、一貫した取引の決定を行うことができます。 「アトミックアナリスト」は、新規および経験豊富なトレーダー向けにカスタマイズされた包括的な取引ソリューションです。プレミアムインジケーターとトップノッチの機能を1つの取引戦略に組み合わせ、すべてのタイプのトレーダーにとって汎用性のある選択肢にします。 デイリートレーディングとスキャルピング戦略:高速で正確なデイ
このダッシュボードは、選択されたシンボルの最新の利用可能なハーモニックパターンを表示するので、時間を節約し、より効率的に /   MT4バージョン 。 無料インジケーター:   Basic Harmonic Pattern インジケーター列 Symbol : 選択したシンボルが表示されます。 Trend :   強気または弱気 Pattern : パターンの種類(ガートレー、バタフライ、バット、カニ、サメ、サイファー、ABCD) Entry : エントリー価格 SL: ストップロス価格 TP1: 1回目の利食い価格 TP2: 2回目の利食い価格 TP3:   3回目の利食い価格 Current price :   現在値 Age (in bars):    最後に描画されたパターンの年齢 主な入力項目 Symbols:   "28 Major Currency Pairs "または "Selected Symbols "から選択。 Selected Symbols:   カンマで区切られた監視したいシンボル("EURUSD,GBPUSD,XAUUSD")。ブローカーがペアに接
Quantum TrendPulse を ご紹介します。これは、   SuperTrend   、   RSI   、および Stochastic のパワーを 1 つの包括的なインジケーターに組み合わせて、取引の可能性を最大限に引き出す究極の取引ツールです。精度と効率を求めるトレーダー向けに設計されたこのインジケーターは、市場のトレンド、勢いの変化、最適なエントリー ポイントとエグジット ポイントを自信を持って特定するのに役立ちます。 主な特徴: SuperTrend 統合: 現在の市場動向に簡単に追従し、収益性の波に乗ることができます。 RSI精度: 買われすぎと売られすぎのレベルを検出し、市場の反転のタイミングに最適で、SuperTrendのフィルターとして使用されます。 確率的精度: 確率的振動を活用して、変動の激しい市場で隠れたチャンスを見つけます。SuperTrend のフィルターとして使用されます。 マルチタイムフレーム分析:   M5 から H1 または H4 まで、さまざまなタイムフレームで市場を常に把握します。 カスタマイズ可能なアラート: カスタム取引条件が満たされ
Trend Forecaster – Since 2023. The Trend Forecaster indicator utilizes a unique proprietary algorithm to determine entry points for a breakout trading strategy. The indicator identifies price clusters, analyzes price movement near levels, and provides a signal when the price breaks through a level. The Trend Forecaster indicator is suitable for all financial assets, including currencies (Forex), metals, stocks, indices, and cryptocurrencies. You can also adjust the indicator to work on any time
OrderFlux | MetaTrader 5 用フットプリント・オーダーフロー バージョン 2.0 – アクティブトレーダー向けのリアルタイム Bid/Ask 可視化 OrderFlux は MT5 用のフットプリントおよびオーダーフローインジケーターです。価格がどこに動いたかだけでなく、その動きの中で何が起きているか(各価格レベルの Bid/Ask ボリューム、デルタ、インバランス、ボリューム分布)を表示します。 多くのチャートはローソク足の最終結果しか表示しません。OrderFlux はそこに至るまでの過程を表示します。ローソク足の形状だけでなく、市場参加者の動向を読み取りたい場合にまさに役立ちます。 Manual   -->   Klick ライブチャートにおいて、OrderFlux は主に次の3つの質問に答えます: 現在、どこで積極的な買いまたは売りの圧力が市場に参入しているか? どの価格レベルでボリュームが吸収、または拒否されているか? 現在の動きはセッションのコンテキスト(背景)にどう適合しているか? インターフェースで得られるもの メインチャートは、Canvas ベー
RelicusRoad Pro: 定量的市場オペレーティングシステム 【期間限定】無制限アクセス 70% OFF - 2,000人超のトレーダーと共に なぜ多くのトレーダーは「完璧な」インジケーターを使っても失敗するのでしょうか? それは、文脈を無視して 単一の概念 だけでトレードしているからです。文脈のないシグナルは単なるギャンブルです。勝ち続けるには、 根拠の重なり(コンフルエンス) が必要です。 RelicusRoad Proは単なる矢印インジケーターではありません。完全な 定量的市場エコシステム です。独自のボラティリティモデリングを用いて、価格が推移する「適正価値の道(Fair Value Road)」をマッピングし、ノイズと真の構造的ブレイクを判別します。 推測はやめましょう。機関投資家レベルの「ロード・ロジック」でトレードを。 コアエンジン:「Road」アルゴリズム システムの中心となる Road Algo は、市場環境にリアルタイムで適応するダイナミックなボラティリティチャネルです。 安全ライン(平衡点) と、価格が数学的に反転しやすい 拡張レベル を投影します。 Si
優れたテクニカルインジケーター「Grabber」をご紹介します。これは、すぐに使える「オールインワン」トレーディング戦略として機能します。 ひとつのコードに、市場のテクニカル分析ツール、取引シグナル(矢印)、アラート機能、プッシュ通知が強力に統合されています。 このインジケーターを購入された方には、以下の特典を無料で提供します: Grabberユーティリティ:オープンポジションを自動で管理するツール ステップバイステップのビデオマニュアル:インジケーターのインストール、設定、取引方法を解説 カスタムセットファイル:インジケーターをすばやく自動設定し、最大限の成果を出すための設定ファイル 他の戦略はもう忘れてください!Grabberだけが、あなたを新たなトレードの高みへと導いてくれるのです。 Grabber戦略の主な特徴: 推奨タイムフレーム:M5〜H4 対応通貨ペア・資産:どれでも使用可能ですが、私が実際に検証した以下を推奨します(GBPUSD、GBPCAD、GBPCHF、AUDCAD、AUDUSD、AUDSGD、AUDCHF、NZDUSD、NZDCAD、EURCAD、EURUSD、E
トレンドラインプロ   市場の真の方向転換点を理解するのに役立ちます。この指標は、真のトレンド反転と主要プレーヤーが再び参入するポイントを示します。 分かりますか     BOSライン   複雑な設定や不要なノイズなしに、より長い時間足でのトレンドの変化と重要なレベルを把握できます。シグナルは再描画されず、バーが閉じた後もチャート上に残ります。 MT4バージョン   -   RFI LEVELS PRO インジケーター と組み合わせることで、その最大限の能力を発揮します インジケーターが示す内容: 本当の変化   トレンド(BOSライン) 一度シグナルが現れたら、それは有効です!これは、リペイント機能を持つインジケーターとの重要な違いです。リペイント機能を持つインジケーターは、シグナルを発した後、それを変更し、資金の損失につながる可能性があります。これにより、より高い確率と精度で市場に参入できます。また、矢印が現れた後、目標値(利益確定)に達するか、反転シグナルが現れるまで、ローソク足の色を変更する機能もあります。 繰り返しエントリ   主要プレーヤーの補充 エントリーポイントを探す
このインジケーターは、反転ポイントと価格戻りゾーンを正確に表示します。     主要プレーヤー 。新たなトレンドが形成される場所を把握し、最大限の精度で意思決定を行い、すべての取引をコントロールします。 TREND LINES PRO インジケーターと組み合わせることで、その潜在能力を最大限に発揮します。 VERSION MT4 インジケーターが示す内容: 新しいトレンドの始まりに活性化する反転構造と反転レベル。 リスクと報酬の比率を最小限に抑えた利益 確定 と 損失停止の レベルの表示     RR 1:2   。 インテリジェントな削減ロジックによるストップロス。 指定されたインジケーターから 2 つのトレンド タイプの反転パターンを表示します。 指標: トレンドを追う   TREND LINES PRO   (世界的なトレンドの変化) TREND PRO   (クイックトレンド変更) シンプルで効果的   スキャナー   リアルタイムトレンド(新機能)。 マルチタイムフレームのインストゥルメント フィルタリング。 画面   利益     LOGIC AI信号の後。 当日プラス方
Introducing Indicator for PainX and GainX Indices Traders on Weltrade Get ready to experience the power of trading with our indicator, specifically designed for Weltrade   broker's PainX and GainX Indices.  Advanced Strategies for Unbeatable Insights Our indicator employs sophisticated strategies to analyze market trends, pinpointing optimal entry and exit points.  Optimized for Maximum Performance To ensure optimal results, our indicator is carefully calibrated for 5-minute timeframe charts on
作者のその他のプロダクト
This universal advisor is based on its own Algorithm, which is an incredibly effective tool due to the simultaneous operation of a trading strategy based on our  Indicator " Channel Sgnals ProfRoboTrading" and our proprietary signal filter system together with the Martingale method, which together work out a very interesting hedging system. Traders are also given the opportunity to set up their own risk management system with two filters to control deposit drawdowns . The advisor's algorithm is
The TMA Centered Bands Indicator for MT5 draws bands on the chart and shows the overall price trend. It displays three bands - the lower and upper boundaries of the channel and the median.   The bands are made up of moving averages, and each of them has an MA period. The name TMA comes from triangular moving averages, as the indicator draws triangular bands.   The price will fluctuate between these ranges whenever the trend changes direction, thus creating entry and exit points.   How to trade
FREE
The Extreme Spike PRT Indicator   is an effective tool for identifying   sharp market fluctuations .   It performs its calculations using the ATR (Average True Range) indicator and displays candles with extreme volatility in two categories:   primary spikes   and   secondary spikes , within the Metatrader platform oscillator window. This tool assists traders in detecting   intense price movements   and conducting more precise   analyses   based on these fluctuations. Time Frame 15-minute - 1-ho
The Channel Sgnals ProfRoboTrading Indicator for MT5 is an effective Forex trading tool designed to track market movements.   The MT5 signal point indicator effectively detects trend reversals after they have already occurred. This Indicator   is a fully automated technical tool that includes a number of parameters to track market trends.   It automatically examines the ever-changing price dynamics of the market, compares the information with earlier data and generates a trading signal. Because
FREE
Bollinger Bands Stop Indicator holds significant importance for traders navigating the complex world of financial markets. Its relevance lies in several key aspects. Firstly, it aids in trend identification. By analyzing price movements relative to the Bollinger Bands, traders can discern whether the market is in an uptrend, downtrend, or ranging phase. Secondly, the indicator provides valuable insights into market volatility. Wider bands indicate higher volatility, while narrower bands suggest
FREE
The TrendOscillator Indicator is an upgraded version of the traditional Stochastic Oscillator.   It comprises two lines: %K and %D.   The %K line represents the current market position.   In contrast, the %D line is a moving average of the %K line used to generate signals and identify potential entry or exit points. The good thing is the indicator works on all timeframes like the traditional Stochastic.   However, to avoid any false signals, applying the indicator on longer timeframes is better
FREE
The Kalires Channel Indicator is a technical indicator used to evaluate trend direction and potential trading opportunities. This is a hybrid indicator that combines Kauffman Adaptive Moving Average (KAMA), linear regression and smoothing. The Kalires Channel Indicator consists of two lines: one central and two outer bands. The central line is a smoothed KAMA modified according to the direction of the trend. The outer bars represent two linear regression lines drawn above and below the center l
FREE
Regression_Channel_mod Indicator that expands our standard linear regression channel by adding support and resistance lines. Easy to integrate into other indicators. The linear regression channel consists of several parallel lines equidistant from the upper and lower part of the linear regression trend line. The distance between the channel boundaries and the regression line is equal to the deviation of the maximum closing price from the regression line.
The TMA Centered Bands indicator for MT4 draws bands on the chart and reports the overall price trend, as well as gives arrows signals to buy and sell when the bar closes outside the channel. Unlike many TMAs, our version uses the calculation part of the algorithm without redrawing, and also adds the ability to select a symbol. The bands are made up of moving averages, and each of them has an MA period. The name TMA comes from triangular moving averages, as the indicator draws triangular bands
FREE
Our modernized version of the popular channel TMA_TRUE  indicator for MT4, which provides information on the main points of trend reversal and momentum exhaustion by drawing a channel on the chart, also draws arrows of signals for buy and sell. As a result, traders can identify bullish and bearish price reversal zones and BUY and SELL accordingly. This indicator works well on all instruments and on all Timeframes. This indicator is the basis of our Channel Trigger EA, which you can buy in MQL
FREE
The TrendChannelTracker Indicator is an innovative Forex trading tool. This indicator, which is based on the standard Stochastic Oscillator, provides traders with a unique and simplified method for observing market trends. In contrast to the traditional Stochastic Oscillator, which is shown at the bottom of the chart, the TrendChannelTracker Indicator is built into the price action itself. This removes the need for traders to continually switch their attention between the oscillator and the pri
FREE
The Forex Gangster Indicator allows you to determine the current trend. If the Forex Gangster Indicator line has moved below the price and turned blue, then you should open deals for an increase. If the Forex Gangster Indicator line has appeared above the price and turned red, then you should open deals for a decrease: The indicator is suitable for any time frames, but it needs to be supplemented with filtering indicators, since by itself it is late and does not have time to give an accurate si
FREE
The Red Dragons Support and Resistance Levels indicator automatically determines support and resistance levels using the proprietary algorithm based on historical and current data, so the levels are dynamic, which allows you to adjust trading targets based on the current price movement. For this reason, we use this indicator in our advisors, for example, Red Dragons, which you can purchase here: https://www.mql5.com/en/market/product/128713?source=Site +Market+MT4+New+Rating006 The panel also
FREE
This indicator works by plotting fractals on the chart as arrows that can be used as buy or sell signals. It is a great tool for both new and experienced traders as it provides a clear visual representation of the market and helps traders identify fractals. Although it repaints, it can be used quite effectively in conjunction with other tools to filter trading strategies. We use this indicator in this way in our Royal Fractals EA, which you can purchase on the MQL5 Market: https://www.mql5.com
FREE
The BandsFill Indicator is a modified Bollinger Bands with a colored cloud.   It has two adjustable parameters: Period Deviation The cloud is colored as follows: If the price crosses the upper band, the cloud is blue. If the price crosses the lower band, the cloud is pink.   Thanks to this, the BandsFill Indicator provides traders with an easy opportunity to detect various features and patterns in price dynamics that are invisible to the naked eye. Based on this information, traders can predict
FREE
This indicator works by plotting fractals on the chart as arrows that can be used as buy or sell signals. It is a great tool for both new and experienced traders as it provides a clear visual representation of the market and helps traders identify fractals. Although it repaints, it can be used quite effectively in conjunction with other tools to filter trading strategies. We use this indicator in this way in our RoyalFractals II Expert Advisor, which you can purchase on the MQL5 Market: https:
FREE
The Teamtrader Channel Stop indicator allows you to determine the current trend. If the Teamtrader Channel Stop indicator line has moved below the price and turned blue, then you should open deals for an increase. If the Teamtrader Channel Stop indicator line has appeared above the price and turned red, then you should open deals for a decrease: The indicator is suitable for any time frames, but it needs to be supplemented with filtering indicators, since by itself it is late and does not have
FREE
Moving Averages Divergence 3x3    Indicator     uses the crossover technique for signaling the market trend and the trade opportunities as well.     It applies 3 formats of the same indicator and allows them to plot the crossover signals which are interpreted as the trade signals along with the direction of the market trend. Moving Averages Divergence 3x3    Indicator   can be applied to trade all kinds of forex currency pairs within the financial markets.  Although, this indicator works well o
FREE
FOREX GANGSTER is a unique Expert Advisor created by a professional prop trader and financial asset manager with many years of experience. This is a solution for those who strive for stable profits without constant control over each transaction or monitoring the work of a trading advisor. Created for optimal conservative trading and investing through exchange instruments with long-term regular profits and minimal risks. The Expert Advisor algorithm is based on a deep understanding of market pat
The Wolf Wave Finder Indicator is a popular indicator, that is useful in identifying potential trading opportunities.   The indicator works by recognizing the Wolf Wave pattern, which is a well-known pattern used by professional traders to identify potential areas of support and resistance.   The indicator is easy to use and provides traders with an easy way to identify potential trades.   The Wolf Wave Finder Indicator is a great tool for traders who are looking for a reliable and accurate way
This indicator is a fusion of the Parabolic SAR and Fibonacci indicators. Fibo is drawn on the last wave, at the peaks the indicator displays prices for convenience. Parabolic SAR helps to define the market trend and generates trends following trade signals.     On the other hand, Fibonacci plots the price retracement levels so that traders can determine a better and safer place to enter the market. Scalping with Parabolic SAR and Fibonacci Overview. For this strategy, in addition to our indica
This is an easy-to-set-up and easy-to-use Expert Advisor that will help you always have the necessary information about your trading account at hand, sending from MetaTrader 4 to you in Telegram: • Account drawdown • Number of open positions • Volume of open positions • Profit per day, week, month How to get an chat ID: - Chat with BotFather to create Bot and get API Token of Bot. If you had Bot, skip the step. - Chat with bot @userinfobot , then the bot will reply your ID. How to setu
The SYMBOL MANAGER symbol change indicator is an effective tool designed to enhance trading convenience and significantly simplify the trader's experience. This indicator allows users to switch seamlessly between currency pairs and timeframes within a single open window of the trading terminal. Importantly, when switching, the associated template, including indicators and current chart settings, is automatically duplicated, ensuring a consistent trading environment.
Morning Star PRT インジケーターは、朝のフラットブレイクアウト原理を使用します。インジケーターは朝のフラットレベルを表示し、可能なターゲットを示します。 インジケーターには追加のフィボナッチレベルが追加され、設定で指定された両方のターゲットレベルと夜間のフラットレベルの交差点に関するサウンドアラートも追加されました。 Morning Star PRT インジケーターは、夜の終わりに夜間のフラットチャネルと、上下の 2 つのフィボナッチ価格レベルを構築します。これらのレベルは、ターゲットレベルと反転レベルの両方と見なすことができます。 Morning Star PRT インジケーターはすべての時間枠で機能しますが、M15 間隔で使用するのが最も効果的です。 The Morning Star PRT indicator uses the morning flat breakout principle. The indicator displays morning flat levels and shows possible targets. An additiona
インジケーター サプライ & デマンド ゾーン PRT – は、チャートのサプライ ゾーンとデマンド ゾーンのマーキングを実行するために使用されるカスタム ツールです。インジケーターは、抵抗/サポート レベルとサプライ/デマンド ゾーンを強調する線と長方形をチャート上に描画します。便宜上、線と数字は両方とも異なる色で塗られており、シグナルを互いに簡単に区別できます。インジケーターは、まだ使用されていない、価格がまだ突破していない新しいレベルのみを描画します。初心者と経験豊富なトレーダーの両方に最適です。 インジケーターは、スキャルピング、トレンド、カウンタートレンド、その他のトレーディング システムで使用されます。これは、あらゆる戦略の一部に簡単に組み込むことができる汎用アルゴリズムです。すべての時間枠とインストルメントで適切に表示され、オシレーターとうまく組み合わせることができます。 Indicator Supply & Demand zones PRT– is a custom tool that is used to perform supply and demand zon
このインジケーターは、チャートパターンを特定したいトレーダーにとって強力なツールであり、トレーディング戦略に組み込むことのメリットは数多くあります。このツールは、金融市場の潜在的なトレンドと反転を効果的に特定して通知し、トレーディングの収益性を高めます。高度なアルゴリズムのおかげで、インジケーターは市場データを正確に分析し、トレーダーに情報に基づいた決定を下すのに役立つ貴重な情報を提供します。このインジケーターを使用すると、チャートパターンを高精度で自動的に特定するため、より包括的な市場分析が可能になります。これらのパターンは、多くの場合、特定の方向への潜在的な価格変動を示します。したがって、この情報にアクセスできると、トレーダーは、これらのパターンを認識できないか、その意味を理解できない可能性のある他の市場参加者よりも有利になります。 このインジケーターは、強気と弱気のパターン認識機能を幅広く備えています(チャート上の略称は括弧内に表示されます)。 - Rising Star(SS) - Evening Star(E_Star) - Evening Doji Star(E_
This universal expert advisor is based on our own Algorithm, which is based on effective and time-tested Elliot Wave Theory.  This   expert advisor   is ideal for working both on a flat and during sharp or protracted trend movements (thanks to the Martingale method, according to which averaging positions are opened in accordance with the multiplier and distance set in the settings for accepting a new signal). ATTENTION! CAREFULLY STUDY THE OPERATING PRINCIPLE AND AVAILABLE SETTINGS OF THE EXPER
This is the automatic price spike signal indicator for MT4. Plots advance alerts on potential breakouts/pullbacks. Suits forex, stocks & crypto trading strategies. This is a perfect indicator for reversal traders. A spike often indicates a turn-around moment. The best way to use that gauge is to apply it to your favourite trading system as a filter. 這是 MT4 的自動價格飆升訊號指示器。繪製有關潛在突破/回調的預先警報。適合外匯、股票和加密貨幣交易策略。 對於反轉交易者來說,這是一個完美的指標。尖峰通常表示轉變時刻。使用該指標的最佳方法是將其作為過濾器應用到您最喜歡的交易系統中
パラボリック SAR およびサポート/レジスタンス レベルは、潜在的なトレンドの反転やエントリー ポイントとエグジット ポイントを識別するために外国為替取引で使用されるテクニカル分析インジケーターであるだけでなく、既製の自律的な取引戦略でもあります。 このインジケーターは、チャートに動的なサポート レベルとレジスタンス レベルを追加することで PSAR インジケーターを基盤としており、トレーダーが市場が反転する可能性のある主要な価格レベルを特定するのに役立ちます。 このインジケーターを使用すると、トレーダーは市場の強さと方向、および取引の潜在的なエントリー ポイントとエグジット ポイントに関する洞察を得ることができます。 パラボリック SAR およびサポート/レジスタンス レベル インジケーターは、チャートにさまざまなパラボリック サポートとレジスタンス (PSAR) レベルをプロットするテクニカル分析ツールであり、トレーダーに潜在的なトレンドの反転シグナルを提供します。 このインジケーターは、メインの MT4 チャート ウィンドウに一連の水平に並んだ線として表示されるため、トレ
The All Market Channels indicator from ProfRobotrading automatically builds and displays all formed trading channels on the screen. This indicator is very convenient for trading on all existing channel strategies and is applicable to all instruments and timeframes.  Look at the screenshot - it will tell you more :) More information is available on our website ProfRoboTrading. ProfRobotrading の All Market Channels インジケーターは、形成されたすべての取引チャネルを自動的に構築して画面に表示します。このインジケーターは、既存のすべてのチャネル戦略での取引に非常に便利で、す
フィルタ:
レビューなし
レビューに返信