Fibo Parabolic PRT

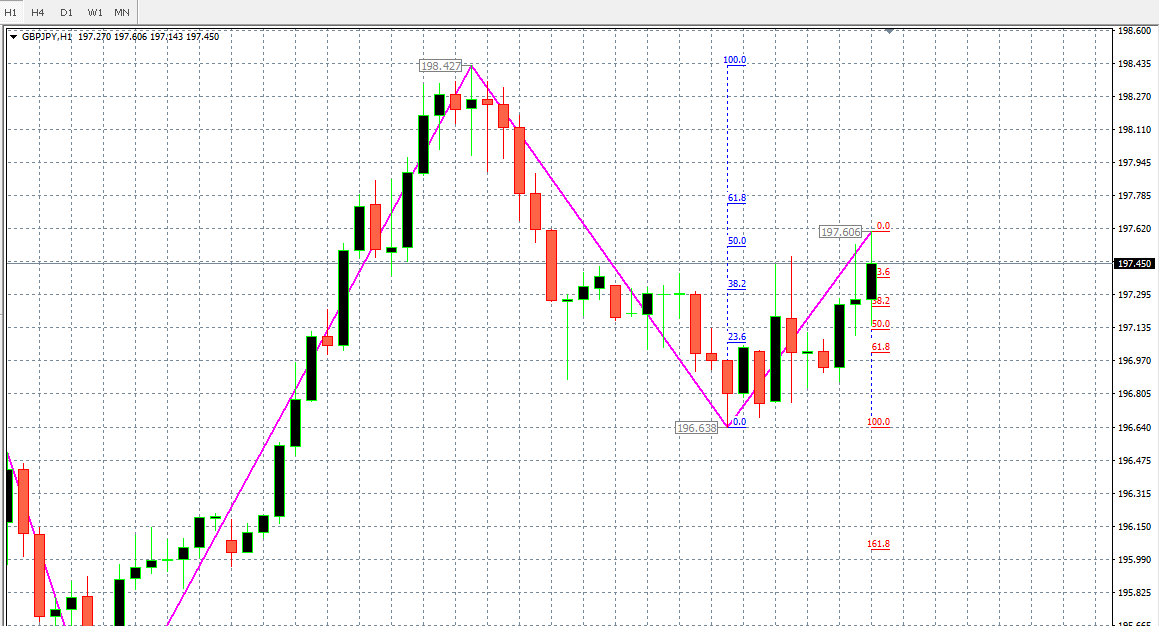
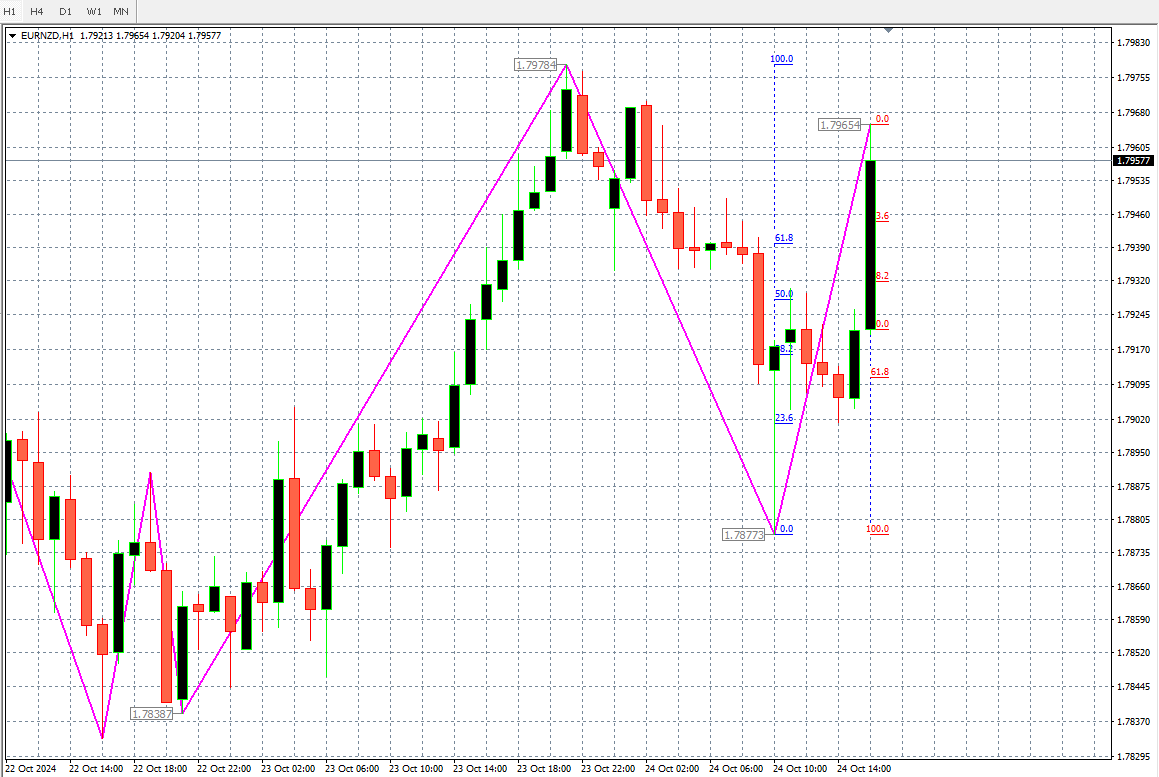
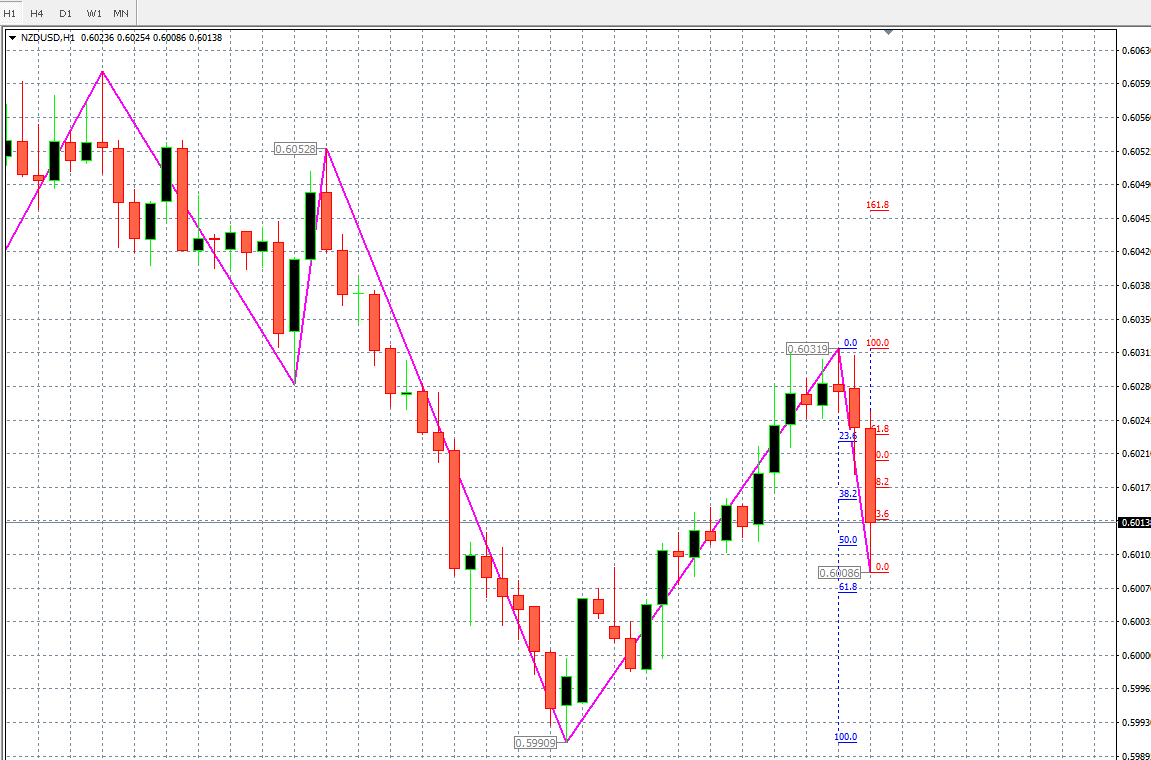
This indicator is a fusion of the Parabolic SAR and Fibonacci indicators. Fibo is drawn on the last wave, at the peaks the indicator displays prices for convenience.

Parabolic SAR helps to define the market trend and generates trends following trade signals.  On the other hand, Fibonacci plots the price retracement levels so that traders can determine a better and safer place to enter the market.

Scalping with Parabolic SAR and Fibonacci Overview.

For this strategy, in addition to our indicator, you need to install an additional Parabolic SAR from those already installed on your MT4 trading platform on the chart and configure it according to the following settings:

  • Parabolic SAR1 (Step: 0.02 & Maximum: 0.2): Used to define short-term trends of the market. Price holding above its level means the trend is bullish and an opposite scenario represents the bearish trend of the market.
  • Parabolic SAR2 (Step: 0.005 & Maximum: 0.05): This one works as a filter of the trend signals plotted by the Parabolic SAR1. You’ll only enter long when P.SAR1 moves above the P.SAR2 level. Conversely, P.SAR2 moves above the P.SAR1 level, which means it is time to go for short entries.
  • Fibonacci: This indicator is used as a scale to measure the retracement level of the market compared to its recent high-low range. The rule is, that you’ll only enter a trade when the price hits its 50% retracement level of the current range.

Scalping with Parabolic SAR and Fibonacci Buy Parameters

  • Parabolic SAR1 moves above Parabolic SAR2
  • Price retraces up to 50% level of its current range determined by the Fibonacci
  • Buy triggers when the above conditions are met
  • Set stop loss below the Parabolic SAR2 level
  • Take profit whenever the price hits the Parabolic SAR1 

Scalping with Parabolic SAR and Fibonacci Sell Parameters

  • Parabolic SAR2 moves above Parabolic SAR1
  • Price retraces up to 50% level of its current range determined by the Fibonacci
  • Sell triggers when the above conditions are met
  • Set stop loss above the Parabolic SAR2 level
  • Take profit whenever the price hits the Parabolic SAR1


おすすめのプロダクト
This indicator combines double bottom and double top reversal chart patterns together with detection of divergences between the price chart and the Momentum oscillator. Features Easily detect strong reversal signals Allows to use double top/bottom and Momentum divergence signals combined or independently Get email and/or push notification alerts when a signal is detected Custom colors can be used The indicator is not repainting Can easily be used in an EA (see below) Inputs ENABLE Double Top -
This indicator combines double bottom and double top reversal chart patterns together with detection of divergences between the price chart and the MACD oscillator. Features Easily detect strong reversal signals Allows to use double top/bottom and MACD divergence signals combined or independently Get email and/or push notification alerts when a signal is detected Custom colors can be used The indicator is not repainting Can easily be used in an EA (see below) Inputs ENABLE Double Top - Bottom:
MRPHN Indicator
Affifuddin Bin Mohd Hazam
iMRPHN: Supertrend & Swing Reversal Indicator A trading indicator that integrates Supertrend zone detection with swing-based entry logic. Designed for traders who apply both trend-following and counter-trend approaches. The indicator works across multiple timeframes and offers several helpful visual and alert-based features. Key Features: Automatic identification of swing high and swing low levels Automatic Fibonacci retracement Supertrend reversal zone visualization in real-time Highlights are
Easy RSI Divergences – Unlock Professional-Level Divergence Trading Easy RSI Divergences is a cutting-edge indicator for MetaTrader 4, crafted for traders who want to gain a competitive edge by accurately identifying RSI (Relative Strength Index) divergences in real time. Whether you are a beginner or a professional, this tool transforms complex market signals into clear, actionable insights. The indicator automatically detects both classic divergences (indicating potential trend reversals) a
The Trend Map indicator is designed to detect trends in price movement and allows you to quickly determine not only the direction of the trend, but also to understand the levels of interaction between buyers and sellers. It has no settings and therefore can be perceived as it signals. It contains only three lines, each of which is designed to unambiguously perceive the present moment. Line # 2 characterizes the global direction of the price movement. If we see that the other two lines are above
Alpha Trend signは私たちの取引システムを検証し、取引信号を明確に提示し、信号がドリフトすることはありません。 主な機能: •市場が活況を示している地域に応じて、指標に基づいて現在の相場がトレンド相場に属しているか、それとも揺れ相場に属しているかを直感的に判断することができる。 そして、指標の指示矢印に基づいて市場に切り込み、緑の矢印は購入を提示し、赤の矢印は販売を提示する。 •小周期変動による頻繁な取引信号の発生を回避するために、5分以上の時間周期で取引を行うことを推奨します。 •最適な取引タイミングを逃さないために、シグナルプロンプトをオンにすることもできます。 •本指標はトレンド相場をよく予測するだけでなく、幅広振動相場でも利益を得ることができる。 •本指標は大道至簡の原則に基づいており、異なる段階のトレーダーが使用するのに適している。 注意事項: •Alpha Trend signには明確な入退場信号があり、損失を与えないように逆位相操作を提案しない。 •Alpha Trend signは特に成熟した指標であり、デルのチー
発見が困難で頻度が少ないため、分岐は最も信頼できる取引シナリオの1つです。このインジケーターは、お気に入りのオシレーターを使用して、通常の隠れた分岐点を自動的に見つけてスキャンします。 [ インストールガイド | 更新ガイド | トラブルシューティング | よくある質問 | すべての製品 ] 取引が簡単 通常の隠れた発散を見つけます 多くのよく知られている発振器をサポート ブレイクアウトに基づいて取引シグナルを実装します 適切なストップロスおよび利益レベルを表示します 設定可能なオシレーターパラメーター カスタマイズ可能な色とサイズ バー単位でサイズ別に分岐をフィルタリング パフォーマンス統計を実装します 電子メール/音声/視覚アラートを実装します 幅広い市場の見通しを提供するために、異なるオシレーターを使用して、干渉なしで同じチャートにインジケーターを何度もロードできます。このインジケーターは、次のオシレーターをサポートしています。 RSI CCI MACD オスマ 確率的 勢い 素晴らしい発振器 加速器発振器 ウィリアムズパーセントレンジ 相対活力指数 特に外国為替市場では、
The indicator detects and displays Shark harmonic pattern (see the screenshot). The pattern is plotted by the extreme values of the ZigZag indicator (included in the resources, no need to install). After detecting the pattern, the indicator notifies of that by a pop-up window, a mobile notification and an email. The indicator highlights the process of the pattern formation and not just the complete pattern. In the former case, it is displayed in the contour triangles. After the pattern is comple
FXC iDeM-DivergencE MT4 Indicator This is an advanced DeMarker indicator that finds trend-turn divergences on the current symbol. The indicator detects divergence between the DeMarker and the price movements as a strong trend-turn pattern. Main features: Advanced divergence settings Price based on Close, Open or High/Low prices Give Buy/Sell open signals PUSH notifications E-mail sending Pop-up alert Customizeable Information panel Input parameters: DeM Period: The Period size of the DeMarker in
MACDivergence MTF
Pavel Zamoshnikov
4.29 (7)
Advanced ideas of the popular MACD indicator: It detects and displays classic and reverse divergences (three methods of detecting divergences). It uses different color to highlight an uptrend and a downtrend. Two methods of determining a trend: а) MACD crosses the 0 level (classic signal); б) MACD crosses its own average (early signal). This is a multi-timeframe indicator: it can display MACD data from other timeframes. Two methods of drawing: classic histogram and line. It generates sound and v
The   Trend Duration Forecast MT4   indicator is designed to estimate the probable lifespan of a bullish or bearish trend. Using a Hull Moving Average (HMA) to detect directional shifts, it tracks the duration of each historical trend and calculates an average to forecast how long the current trend is statistically likely to continue. This allows traders to visualize both real-time trend strength and potential exhaustion zones with exceptional clarity. KEY FEATURES Dynamic Trend Detection:   Uti
MACD Multicurrency Scanner MT4は、移動平均収束拡散(MACD)戦略を使用して複数の通貨ペアを分析するために設計された高度なトレーディングインジケーターです。このツールは、さまざまな時間枠での潜在的な売買シグナルを特定することで、トレーダーが取引パフォーマンスを最適化するのに最適です。 ユーザーフレンドリーなインターフェースを備えたMACD Multicurrency Scanner MT4は、トレーダーが情報に基づいた意思決定を行うことを可能にします。リアルタイムのアラートと視覚的シグナルを提供することで、迅速なforex市場での機会を捉えるのを容易にします。 MQL製品のインストールガイド | MT4/MT5で購入したMQL製品を更新する | 一般的なトラブルシューティングガイド | インジケーター設定 / ガイド 主な特徴 バッファ統合:インジケーターの値をアクセス可能なバッファとして公開し、自動取引戦略のためにExpert Advisorによって読み取れるようにします。 視覚的矢印シグナル:Plotsは、シグナルキャンドル上に直接BUY/SELL矢印
「Auto FIBO Pro」Crypto_Forex インジケーターは、取引の補助ツールとして最適です。 - インジケーターは、フィボナッチ レベルとローカル トレンド ライン (赤色) を自動的に計算してチャート上に配置します。 - フィボナッチ レベルは、価格が反転する可能性のある重要な領域を示します。 - 最も重要なレベルは、23.6%、38.2%、50%、61.8% です。 - リバーサル スキャルピングやゾーン グリッド取引に使用できます。 - Auto FIBO Pro インジケーターを使用して、現在のシステムを改善する機会も多数あります。 - Info Spread Swap Display があり、接続されている外国為替ペアの現在のスプレッドとスワップを表示します。 - ディスプレイには、アカウントの残高、エクイティ、マージンも表示されます。 - Info Spread Swap Display は、チャートのどのコーナーにも配置できます。 0 - 左上コーナー、1 - 右上、2 - 左下、3 - 右下。 高品質のトレーディングロボットとインジケーターをご覧にな
Crypto_Forex インジケーター HTF Ichimoku for MT4。 - Ichimoku インジケーターは、最も強力なトレンド インジケーターの 1 つです。HTF は、Higher Time Frame を意味します。 - このインジケーターは、トレンド トレーダーや、プライス アクション エントリとの組み合わせに最適です。 - HTF Ichimoku インジケーターを使用すると、より高い時間枠の Ichimoku を現在のチャートに添付できます。 - 上昇トレンド - 赤い線が青い線より上 (両方の線が雲より上) / 下降トレンド - 赤い線が青い線より下 (両方の線が雲より下)。 - 価格が Ichimoku 雲の上部境界を突破した場合にのみ、買い注文を開きます。 - 価格が Ichimoku 雲の下部境界を突破した場合にのみ、売り注文を開きます。 - HTF Ichimoku インジケーターを使用すると、大きなトレンドを捉える機会が得られます。 高品質のトレーディングロボットとインジケーターをご覧になるにはここをクリックしてください! これは、この M
The Range Directional Force Indicator is designed to help traders analyze market trends, reversals, and directional strength. It focuses on price movements within defined ranges, identifying key moments when the market is gaining momentum or preparing for a shift. By dividing the chart into dynamic price ranges, the indicator detects critical support and resistance levels. It calculates the directional force of price movements, highlighting potential entry and exit points based on market sentim
This is a combination of multiple oscillators into a single divergence system that creates the impression of a more reliable divergence indicator. It is multi-currency based and works best on 15 minutes timeframe and above. Every time a signal is generated, it shows an alert to the user. It is more ideal if combined with other price action indicators or trading systems.
Rainbow Price Visualizer v1.21 See where the market really breathes. Turns your MT4 chart into an ultra-precise heatmap that highlights price zones favored by big players. Why it matters 300 price levels at 0.2‑pip resolution — microscopic detail. 8 visual themes (Rainbow, Fire, Ocean…) for instant readibility. Smart opacity: low noise fades, real zones pop. Lightweight rendering with automatic cleanup. Fully customizable: saturation, opacity, resolution, history depth. Bands project into the f
The indicator detects and displays 3 Drives harmonic pattern (see the screenshot). The pattern is plotted by the extreme values of the ZigZag indicator (included in the resources, no need to install). After detecting the pattern, the indicator notifies of that by a pop-up window, a mobile notification and an email. The indicator highlights the process of the pattern formation and not just the complete pattern. In the former case, it is displayed in the contour triangles. After the pattern is com
FXC iMACD-DivergencE MT4 Indicator This is an advanced MACD indicator that finds trend-turn divergences on the current symbol. The indicator detects divergence between the MACD and the price movements as a strong trend-turn pattern. Main features: Advanced divergence settings Price based on Close, Open or High/Low prices Give Buy/Sell open signals PUSH notifications E-mail sending Pop-up alert Customizeable Information panel Input parameters: MACD Fast-EMA: The Fast-EMA variable of the MACD indi
Introducing the Star Path Stochastic Cross Indicator Ready to explore your trading potential? The Star Path Stochastic Cross Indicator is here to guide your path. Designed for traders who love flexibility, this indicator is not optimized, giving YOU the freedom to tailor it to your strategies. Whether you're a beginner or an experienced trader, this tool is the perfect addition to your toolkit. The Logic Behind the Indicator This indicator leverages the powerful stochastic oscillator to identif
Stochastic BR allows you to recognize reversals professionally. The "Stochastic BR" is designed to recognize profitable counter trend patterns from your chart. Stochastic Indicator: This technical indicator was developed by George Lane more than 50 years ago. The reason why this indicator survived for so many years is because it continues to show consistent signals even in these current times. The Stochastic indicator is a momentum indicator that shows you how strong or weak the current trend i
The trend is your friend! This is what this indicator is all about. Follow this famous saying and be safe. Characteristics: Buy/Sell signals fixed on the close of a bar. Works on all symbols and all timeframes. Clear visual market trend laser line, Buy/Sell signal arrows, market strength meter, TP1 & TP2 boxes. Visual signals when to enter, when to exit the market. No repainting. Compatible with Flexible EA for trading automation. (Ask for a free set file optimized to perform 2010-2018) Parame
**  All Symbols  x  All Timeframes  scan just by pressing scanner button ** *** Contact me  to send you instruction and add you in "Wolfe Wave Scanner group" for sharing or seeing experiences with other users. Introduction: A Wolfe Wave is created with five-wave patterns in price. It shows supply and demand and a fight towards a balance price. T hese waves of price actions can help traders identify the boundaries of   the trend . Also  It helps forecast how the price will move in the near future
A   professional version of the ZigZag indicator for visualizing the structure of price movements by fractals. Fractal ZigZag fixes the flaws of the standard version of the ZigZag indicator MT4. It uses Price action and a unique filtering algorithm to determine fractals. Suitable for all types of trading. Ideal for trading according to the WM pattern "Sniper" strategy !!! Features Marks the place of price reversal during the formation of a new fractal with specified parameters. Suitable for al
MACD Divergence MT4
KEENBASE SOFTWARE SOLUTIONS
KT MACD ダイバージェンスは、価格とオシレーターの間に形成される通常のダイバージェンスと隠れたダイバージェンスを表示します。トレンドの反転を予測する戦略を用いている場合、MACD の通常のダイバージェンスを利用して転換点を特定できます。トレンドの継続に基づく戦略では、MACD の隠れたダイバージェンスが有効です。 KT MACD ダイバージェンスの制限事項 MACD ダイバージェンスを単体のエントリーシグナルとして使うのはリスクがあります。すべてのダイバージェンスが反転を示すとは限りません。より良い結果を得るためには、プライスアクションや他の分析手法と併用することをおすすめします。 主な機能 価格とオシレーターの間の通常および隠れたダイバージェンスを表示します。 非対称なダイバージェンスは精度向上とチャートの見やすさのために除外されます。 トレンド反転戦略およびトレンド継続戦略の両方に対応。 エキスパートアドバイザーへの組み込みに完全対応。 エントリーおよびエグジットの両方で使用可能です。 すべてのMetaTraderアラートに対応。 そもそもダイバージェンスとは? 一般的
This indicator is the undisputed leader among the indicators. And for this statement there is a good reason. The indicator builds a very high quality channel in which it generates signals to enter! What is the ideal strategy for the trader, since the trader always hesitates when choosing a strategy for the job. That is, this indicator will allow you to solve the dilemma of choosing a job by trend or to the channel, since it combines these two basic concepts. Working with the indicator is very
MT4用Heiken Ashiマルチカレンシースキャナー は、トレーダーがHeiken Ashiインジケーターを使用して市場のトレンドを効率的に監視できるように設計された高度なツールです。このスキャナーを使用すると、複数の通貨ペアを同時にスキャンでき、トレンドや反転のチャンスを素早く特定できます。 主な機能 簡単なマルチカレンシースキャン: 複数の通貨ペアをリアルタイムで監視し、重要なHeiken Ashiシグナルが検出された際に即座にアラートを受信します。 包括的なダッシュボード表示: さまざまな通貨ペアにおけるHeiken Ashiの強気および弱気トレンドをわかりやすいダッシュボードで確認できます。 幅広い通貨ペア対応: 主要通貨からエキゾチック通貨まで、さまざまな市場を分析可能です。 過去シグナルの追跡: 過去のHeiken Ashiトレンドシグナルをレビューし、取引戦略の改善に役立てることができます。 複数時間軸のスキャン: 短期から長期まで、さまざまな時間軸での取引チャンスを把握します。 シームレスなチャートナビゲーション: ダッシュボードからワンクリックで通貨ペアを切り替え
Minotaur Waves は、市場の転換点を検出し、方向性の変化を高精度で確認するために設計された高度な分析インジケーターです。 Minotaur Oscillator と動的なアダプティブバンド構造を組み合わせ、信頼性の高い視覚的シグナルを提供し、的確なエントリー判断を支援します。すべての通貨ペアに対応しており、特に EURUSD、GBPUSD、USDJPY の M1、M5、M15、M30 タイムフレームで最適なパフォーマンスを発揮します。 アップデートとガイドはこちらからご覧ください: https://www.mql5.com/en/channels/forexnewadvisor システムの主な構成: 動的バンド: モメンタムの変化をリアルタイムで検出し、重要なブレイクアウトゾーンを可視化 Minotaur Oscillator: モメンタムのヒストグラム表示により、反転ゾーンを視覚的に示す 極値の検出: +33(高値ピーク)または -33(安値ピーク)の確定値が検出されたときのみアラートを発動 ノイズ制御: トレンド中の過剰なシグナル発生を防ぐ内部フィルターロジックを搭
The CCI Divergence is a reasonably useful indicator in itself, but it is even more effective when used with divergence pattern trading. The CCI Divergence indicator signal is one of the most potent signals among the indicators that exist in the market. Here is new version for Divergence Indicator using CCI method, with more improvements. Divergences indicate a potential investment point because the directional moment does not confirm the price. A bullish divergence occurs when the underlying va
The   Fibonacci Confluence Toolkit   is a technical analysis tool designed to help traders identify potential price reversal zones by combining key market signals and patterns. It highlights areas of interest where significant price action or reactions are anticipated, automatically applies Fibonacci retracement levels to outline potential pullback zones, and detects engulfing candle patterns. Its unique strength lies in its reliance solely on price patterns, eliminating the need for user-define
このプロダクトを購入した人は以下も購入しています
Gann Made Easy は、ミスター・ギャンの理論を使用した取引の最良の原則に基づいた、プロフェッショナルで使いやすい外国為替取引システムです。 W・D・ガン。このインジケーターは、ストップロスとテイクプロフィットレベルを含む正確な買いと売りのシグナルを提供します。 PUSH通知を利用して外出先でも取引可能です。 ご購入後、取引方法の説明と優れた追加インジケーターを無料で入手するには、私にご連絡ください! おそらく、ギャンの取引手法についてはすでに何度も聞いたことがあるでしょう。通常、ギャンの理論は初心者のトレーダーだけでなく、すでにある程度の取引経験がある人にとっても非常に複雑なものです。なぜなら、ギャンの取引手法は理論的にはそれほど簡単に適用できるものではないからです。私はその知識を磨き、最良の原則を私の外国為替インジケーターに組み込むために数年を費やしました。 このインジケーターは非常に簡単に適用できます。必要なのは、それをチャートに添付し、簡単な取引推奨事項に従うだけです。このインジケーターは常に市場分析の仕事を行い、取引の機会を探します。適切なエントリーポイントを検出す
M1 SNIPER は使いやすいトレーディングインジケーターシステムです。M1時間足向けに設計された矢印インジケーターです。M1時間足でのスキャルピングのためのスタンドアロンシステムとして、また既存のトレーディングシステムの一部としても使用できます。このトレーディングシステムはM1時間足での取引に特化して設計されていますが、他の時間足でも使用できます。元々、この手法はXAUUSDとBTCUSDの取引用に設計しましたが、他の市場においても役立つと考えています。 インジケーターのシグナルは、トレンドの方向と逆方向に取引できます。インジケーターのシグナルを利用して両方向に取引するのに役立つ特別な取引テクニックをご紹介します。この手法は、特別な動的なサポートとレジスタンスの価格帯を利用することに基づいています。 ご購入後、M1 SNIPER矢印インジケーターをすぐにダウンロードできます。さらに、M1 SNIPERツールのすべてのユーザーに、以下のスクリーンショットに表示されているApollo Dynamic SRインジケーターを無料で提供しています。この2つのインジケーターを組み合わせることで
Scalper Inside PRO – Since 2020. An exclusive indicator that utilizes an innovative algorithm to swiftly and accurately determine the market trend. The indicator automatically calculates opening, closing, and profit levels, providing detailed trading statistics. With these features, you can choose the most appropriate trading instrument for the current market conditions. Additionally, you can easily integrate your own arrow indicators into Scalper Inside Pro to quickly evaluate their statistics
PRO Renko Systemは、特別にRENKOチャートを取引するために設計された高精度の取引システムです。 これは、様々な取引商品に適用することができる普遍的なシステムです。 システムは効果的に正確な逆転信号へのアクセスを与えるいわゆる市場の騒音を中和する。 表示器は非常に使いやすく、信号の生成に責任がある1つの変数だけがあります。 あなたは簡単にお好みの任意の取引ツールとレンコバーのサイズにツールを適応させることができます。 私はいつもあなたが私のソフトウェアで収益性の高い取引を支援するために余分なサポートを提供する準備ができています! 私はあなたに幸せで収益性の高い取引をしたいです! ご購入後にご連絡ください! 私はあなたに私のレンコチャートジェネレータを送信します。 私はまた、私の個人的な推奨事項やシステムの他のモジュールを無料で共有します!
Auto Optimized Parabolic RSI: 高度な3Dモメンタムエンジン ほとんどのリテール向けインジケーターは、市場のボラティリティが変化した瞬間に破綻する静的な入力値に依存しているため、失敗に終わります。Auto Optimized Parabolic RSIは、自らの数学的優位性を継続的に再計算することで「インジケーターの陳腐化」問題を解決し、機関投資家レベルの定量的適応力をMT5ターミナルに直接もたらします。 最大の強み: カスタムインメモリ3D最適化   標準的な自動最適化ツールは、インジケーターの呼び出しで端末に過負荷をかけるため、頻繁にMT5プラットフォームをフリーズさせます。本ツールは、このボトルネックを完全に回避しています。RAMベースのカスタムネイティブ計算機を内蔵した内部エンジンは、チャートを読み込んだりタイムフレームを変更したりするたびに、超高速の3Dグリッド探索を実行します。RSI期間(頻度)、SARステップ(加速度)、SAR最大値(制限速度)を同時にスイープし、プラットフォームを遅延させることなく、数万通りものパラメーターの組み合わせを絶対的
ご紹介     Quantum Breakout PRO は 、ブレイクアウト ゾーンの取引方法を変革する画期的な MQL5 インジケーターです。 13年以上の取引経験を持つ経験豊富なトレーダーのチームによって開発された Quantum Breakout PROは 、革新的でダイナミックなブレイクアウトゾーン戦略により、あなたの取引の旅を新たな高みに押し上げるように設計されています。 クォンタム ブレイクアウト インジケーターは、5 つの利益ターゲット ゾーンを備えたブレイクアウト ゾーン上のシグナル矢印と、ブレイクアウト ボックスに基づいたストップロスの提案を提供します。 初心者トレーダーにもプロのトレーダーにも適しています。 量子EAチャネル:       ここをクリック MT5バージョン:   ここをクリック 重要!購入後、インストールマニュアルを受け取るためにプライベートメッセージを送ってください。 推奨事項: 時間枠: M15 通貨ペア: GBPJPY、EURJPY、USDJPY、NZDUSD、XAUUSD アカウントの種類: ECN、Raw、またはスプレッドが非
After purchase, contact me privately to receive 1 month of free testing with EA Forex Proton! This advanced MT4 trading robot automatically executes signals from any MT4 indicator, including Market Makers. The latest version also includes AI integration, allowing each trade signal to be analyzed using Artificial Intelligence. Live Signal with EA Forex Proton: Click here Market Makers is a powerful price action trading system designed to identify high-probability Buy and Sell opportunities based
Apex Edge No Repaint MT4対応、プロ仕様のリペイントしないトレーディングインジケーター Apex Edge No Repaintは、リペイントする矢印の煩わしさから解放され、明確なシグナルを求める真剣なFXおよび仮想通貨トレーダー向けに設計された、高品質でクリーンかつ信頼性の高いトレーディングツールです。 主な機能: 100% リペイントなし – チャートに表示されたシグナルは固定されたままです デュアルシグナルシステム:早期のチャンスを提供するRAWシグナルと、高確率で確定したエントリーを提供するCONFシグナル シンプルなワンクリック切り替えボタン:RAW ON/OFFとCONF ON/OFF トレンド、強度パーセンテージ、シグナルステータスを表示するプロフェッショナルなリアルタイムダッシュボード インスタントアラート:ポップアップ、サウンド、メール通知 すべてのCONFシグナルにTP1、TP2、ストップロスレベルを自動描画 視覚的に分かりやすい、色分けされた矢印: ライムグリーン → CONF買い 赤 → CONF売り ドジャーブルー → RAW買
このインジケーターを購入すると、プロ仕様のトレードマネージャーを無料で差し上げます。 まず第一に、このトレーディングシステムがノンリペイント、ノンリドロー、ノンラグのインジケーターであることを強調する価値がある。これにより、手動取引とロボット取引の両方に理想的なものになっています。 オンラインコース、マニュアル、プリセットのダウンロード。 「スマートトレンドトレーディングシステム MT5」は、新規および経験豊富なトレーダー向けにカスタマイズされた包括的なトレーディングソリューションです。10以上のプレミアムインジケーターを組み合わせ、7つ以上の堅実なトレーディング戦略を備えており、多様な市場状況に対応する多目的な選択肢となっています。 トレンドフォロー戦略:トレンドを効果的に乗り越えるための正確なエントリーとストップロス管理を提供します。 リバーサル戦略:潜在的なトレンドの反転を特定し、トレーダーがレンジ相場を活用できるようにします。 スキャルピング戦略:高速で正確なデイトレードおよび短期取引のために設計されています。 安定性:すべてのインジケーターはノンリペイント、ノンリドロー、ノ
このインジケーターは、エリオット波動理論と組み合わせて作動し、2つの方法で使用されます: 自動モード: このモードでは、インジケーターがチャート上の全ての5つのモーティブ波を自動的に検出し、予測とポテンシャルな逆転ゾーンを提供します。また、アラートやプッシュメッセージを生成する能力も備えています。この自動機能により、エリオット波動パターンの識別と分析のプロセスが効率化されます。 手動モード: このオプションは、エリオット波動理論を手動で扱いたいトレーダー向けです。9つの段階を使用して波を描画することができます。各段階は、表示された後に描画されたラインを調整して個別に定義できます。この機能により、手動で波を描画するプロセスがより効率的になります。重要な点として、すべての描画データが将来の参照のためにプラットフォームのデータフォルダに保存されることに注意してください。 パラメータ: Name: インジケーターの名前。 Use_System_Visuals: インジケーターのテーマを有効または無効にして、取引プラットフォーム全体の外観に合わせます。 Explain_Comment: 波の番号
これはほぼ間違いなく、MetaTraderプラットフォームで見つけることができる最も完全な調和価格形成自動認識インジケーターです。 19種類のパターンを検出し、フィボナッチプロジェクションをあなたと同じように真剣に受け止め、潜在的逆転ゾーン(PRZ)を表示し、適切なストップロスとテイクプロフィットレベルを見つけます。 [ インストールガイド | 更新ガイド | トラブルシューティング | よくある質問 | すべての製品 ] 19の異なる調和価格形成を検出します プライマリ、派生および補完フィボナッチ投影(PRZ)をプロットします 過去の価格行動を評価し、過去のすべてのパターンを表示します この指標は、独自の品質とパフォーマンスを分析します 適切なストップロスとテイクプロフィットのレベルを表示します ブレイクアウトを使用して適切な取引を通知します すべてのパターン比をグラフにプロットします 電子メール/音声/視覚アラートを実装します スコット・M・カーニーの本に着想を得て、この指標は最も純粋で急を要するトレーダーのニーズを満たすように設計されています。ただし、トレードを容易にする
Please send me Direct message on MQL5 CHAT after purchasing the Indicator for Training and Installation Support There are some additional files that is important to use with the Indicator . So be sure to contact me after purchasing the Indicator So that I can add you for training and support . If you find any difficulty with installation then send me Direct message here So that I can connect with you via Anydesk or Teamview for the product installation. " Smart Order Block Indicator " to find m
ゴールドラッシュ・トレンド・アロー・シグナル ゴールドラッシュ・トレンド・アロー・シグナル 指標は、XAU/USDにおける高速・短期スキャルパー向けに最適化された、正確でリアルタイムのトレンド分析を提供します。 1分足専用に設計されたこのツールは、明確なエントリーポイントを示す方向矢印を表示し、スキャルパーが変動の激しい市場状況でも自信を持って取引できるよう支援します。 この指標は、PRIMARY(主要)とSECONDARY(補助)のアラート矢印で構成されています。PRIMARYシグナルは、トレンドの方向転換を示す白と黒の方向矢印であり、SECONDARYシグナルは、PRIMARY矢印が示す方向を確認し、潜在的なエントリーポイントを示す青と赤の矢印です。 注意:トレンド方向の変化後にPRIMARYアラート矢印が1つだけ表示される場合、複数のSECONDARY青/赤矢印が表示される点に注意が必要です。SECONDARYシグナルは、シグナル基準を満たす任意のローソク足後に表示されます。したがって、長期的なトレンド移動の場合、画面に多くのSECONDARY矢印が表示されます(添付の
「 Dynamic Scalper System 」インジケーターは、トレンド波の中でスキャルピング取引を行う手法のために設計されています。 主要通貨ペアと金でテスト済みで、他の取引商品との互換性があります。 トレンドに沿った短期的なポジションオープンのシグナルを提供し、追加の価格変動サポートも提供します。 インジケーターの原理 大きな矢印はトレンドの方向を決定します。 トレンド波の中では、小さな矢印の形でスキャルピングシグナルを生成するアルゴリズムが機能します。 赤い矢印は強気方向、青い矢印は弱気方向です。 トレンドの方向には敏感な価格変動ラインが描かれ、小さな矢印のシグナルと連動します。 シグナルは次のように機能します。適切なタイミングでラインが現れるとエントリーシグナルが形成され、ラインが開いている間はポジションが保持され、完了すると取引が終了します。 推奨される動作時間枠はM1~H4です。 矢印は現在のローソク足に形成され、次のローソク足が開いている場合は、前のローソク足の矢印は再描画されません。 入力パラメータ Trend Wave Period - トレンド方向
トレンドトレーディング は、タイミングのプルバックとブレイクアウトにより、市場で起こっているトレンドから可能な限り利益を得るように設計された指標です。確立されたトレンドの中で価格が何をしているかを分析することにより、取引の機会を見つけます。 [ インストールガイド | 更新ガイド | トラブルシューティング | よくある質問 | すべての製品 ] 自信を持って効率的に金融市場を取引する むち打ちにならずに確立されたトレンドから利益を得る 収益性の高いプルバック、ブレイクアウト、早期の逆転を認識する この指標は、独自の品質とパフォーマンスを分析します 複数時間枠のダッシュボードを実装します インジケーターは再描画されていません 電子メール/音声/視覚アラートを実装します 確立されたトレンドは多くの取引機会を提供しますが、ほとんどのトレンド指標はそれらを完全に無視しています。インジケーターの解釈はかなり簡単です: (1) トレンドの変化 (2) トレンドの方向への後退 (3) トレンドの方向へのブレイクアウト 赤いダッシュ は下降トレンド中の修正です 青いダッシュ は上昇トレンド中
GOLD Impulse with Alert
Bernhard Schweigert
4.67 (12)
このインディケータは、当社の2つの製品 Advanced Currency IMPULSE with ALERT  +   Currency Strength Exotics . のスーパーコンビネーションです。 このインジケーターは全ての時間枠で作動し、8つの主要通貨と1つのシンボルの強弱のインパルスをグラフで表示します。 このインジケータは、金、エキゾチックペア、商品、インデックス、先物など、あらゆるシンボルの通貨強度の加速度を表示することに特化されています。金、銀、原油、DAX、US30、MXN、TRY、CNHなどの通貨強度の加速度(インパルスまたは速度)を表示するために、任意のシンボルを9行目に追加できる、この種の最初のものです。 新しいアルゴリズムに基づいて構築され、潜在的な取引の特定と確認がさらに容易になりました。これは、通貨の強さや弱さが加速しているかどうかをグラフィカルに表示し、その加速の速度を測定するためです。加速すると物事は明らかに速く進みますが、これはFX市場でも同じです。つまり、反対方向に加速している通貨をペアリングすれば、潜在的に利益を生む取引を特定
Advanced Supply Demand
Bernhard Schweigert
4.91 (300)
現在40%オフ 初心者にもエキスパートトレーダーにも最適なソリューション このインジケーターは独自の機能と新しい公式を多数内蔵しており、ユニークで高品質かつ手頃な取引ツールです。このアップデートでは、2つの時間枠ゾーンを表示できるようになります。より長いTFだけでなく、チャートTFとより長いTF(ネストゾーンを表示)の両方を表示できます。すべてのSupply Demandトレーダーの皆さんのお気に召すはずです。:) 重要情報の公開 Advanced Supply Demandの可能性を最大化するには、 https://www.mql5.com/ja/blogs/post/720245 にアクセスしてください。   エントリーまたはターゲットの正確なトリガーポイントを正確に特定できれば取引がどのように改善されるか想像してみてください。新しい基盤となるアルゴリズムに基づいて構築されているため、買い手と売り手の間の潜在的な不均衡をさらに簡単に特定できます。これは、最も強い需要と供給のゾーンと、過去のパフォーマンス(古いゾーンを表示)がグラフィカルに表現されるためです。これらの機能は、最適な
Gold Scalper Super is an easy-to-use trading system. The indicator can be used as a standalone scalping system on the M1 time frame, as well as part of your existing trading system. Bonus: when purchasing an indicator, Trend Arrow Super is provided free of charge, write to us after purchase. The indicator 100% does not repaint!!! If a signal appears, it does not disappear! Unlike indicators with redrawing, which lead to the loss of a deposit, because they can show a signal and then remove it.
CRT Candle Range Theory HTF MT4.   Ultimate CRT Indicator: Advanced ICT Concepts and Malaysian SnR Trading System Discounted   Price   $50  !!     Secure your lifetime access   now   before it switches to   subscription-only ! Master the Market Maker's Footprints with the Most Advanced Candle Range Theory Indicator Unlock the true power of   Smart Money Concepts (SMC)   and trade precisely like the institutions with the   Ultimate CRT Indicator . Built exclusively for serious traders, this indic
このインディケータは、異なる期間のフラクタルの価格構造を調べて、市場で起こり得る反転ポイントを決定し、すでに基本的または技術的な評価モデルを持っているポジショントレーダーにタイミングを提供します。弟の リバーサルフラクタル とは異なり、このインジケーターは選択された期間のためにリバーサルを逃すことはなく、ジグザグ形式でリバーサルフラクタルを見つけます。 [ インストールガイド | 更新ガイド | トラブルシューティング | よくある質問 | すべての製品 ] ターニングポイントは長いトレンドを開始できます インジケーターは再描画されていません あらゆる種類のアラートを実装します カスタマイズ可能な色とサイズ フラクタルは奇数番目のバーのフォーメーションであり、フォーメーションの最上位または最下位の中間バーであり、フラクタル内のすべてのバーが閉じるとインディケーターが描画されるため、このインジケーターはリアクティブまたは遅れ信号です。ただし、既存の方向バイアスを持つトレーダーは、この指標が非常に有用であり、早期のエントリポイントを取得します。 このインディケーターは、ボイルダウンされた
サポート線と抵抗線のプロットにうんざりしていませんか? サポートレジスタンス は、非常に興味深いひねりを加えてチャート内のサポートとレジスタンスラインを自動検出およびプロットするマルチタイムフレームインジケーターです。価格レベルは時間とともにテストされ、その重要性が高まるにつれて、ラインは太くなり、暗くなります。 [ インストールガイド | 更新ガイド | トラブルシューティング | よくある質問 | すべての製品 ] 一晩でテクニカル分析を強化 チャートを閲覧せずに重要な価格レベルを検出 一目ですべての価格レベルの相対的な強さを認識する すべての取引で最大30時間のプロットラインを節約 インジケーターは、すべての価格レベルの年齢を表示します インジケーターは再描画されていません 過去および現在の価格レベルは近接によって崩壊し、現在の市場行動に合わせて調整されます。動作は、必ずしもピークではない場所に線が引かれます。 価格レベルは、時間とともに拒否されるにつれて、より暗く、より広くなります ノイズを避けるために、重要でない価格レベルは定期的にクリアされます カスタマイズ可能な時間枠の
They say history repeats itself. What if you could prove it in real-time? The Propfolio Ghost Pattern is an advanced algorithmic pattern-matching engine. It empowers you to select any current price action structure on your chart and instantly scan thousands of historical candles to find the exact moment in the past where the market did the exact same thing. Once it finds the highest probability match, it projects the historical outcome into the future as "Ghost Candles"—giving you a highly calcu
現在26%OFF! このインディケータは、当社のメインインディケータ( Advanced Currency Strength 28   &  Advanced Currency IMPULSE with ALERT )の両方のスーパーコンビネーションです。28の外国為替ペアのTICK-UNITSとアラートシグナルの通貨強度の値を示しています。11種類のTick-Unitが使用可能です。1、2、3、4、5、6、10、12、15、20、30秒の11種類です。サブウィンドウのTick-Unitバーは、秒単位のタイマーに1ティック以上含まれる場合に表示され、左側にシフトされます。 たった1枚のチャートで、28のFXペアをスキャルピングできます。スキャルピングのチャンスとなるトリガーポイントを正確に把握することで、スキャルピングが上達することを想像してみてください。 1分足よりも短い期間で動作する市場初の通貨強度インジケーターです! このインジケータは、素早いインとアウトを行い、小さなピップを切り取ることを望む高速スキャルパーのためのものです。 ユーザーマニュアル: ここをクリック h
まず第一に、この取引インジケーターは再描画されず、再描画されず、遅延しないことを強調する価値があります。これにより、手動取引とロボット取引の両方に理想的なものになります。 ユーザーマニュアル:設定、入力、戦略。 アトミックアナリストは、価格の強さとモメンタムを利用して市場でより良いエッジを見つけるためのPA価格アクションインジケーターです。ノイズや誤ったシグナルを除去し、取引ポテンシャルを高めるための高度なフィルターを備えています。複雑なインジケーターの複数のレイヤーを使用して、アトミックアナリストはチャートをスキャンし、複雑な数学的計算をシンプルなシグナルと色に変換します。これにより、どのような初心者トレーダーでも理解して使用し、一貫した取引の決定を行うことができます。 「アトミックアナリスト」は、新規および経験豊富なトレーダー向けにカスタマイズされた包括的な取引ソリューションです。プレミアムインジケーターとトップノッチの機能を1つの取引戦略に組み合わせ、すべてのタイプのトレーダーにとって汎用性のある選択肢にします。 デイリートレーディングとスキャルピング戦略:高速で正確な
購入後、このインジケーターに基づいたボーナスEAを受け取るためにご連絡ください。 Self Optimizing Double MA Strategyは、パラメータ推測の必要性を排除するために設計されたプロフェッショナルグレードの取引ツールです。組み込みの自動最適化エンジンを搭載し、バックグラウンドで何千ものパラメータの組み合わせをシミュレートすることで、変化する市場状況に継続的に適応し、統計的な優位性を維持します。 静的で時代遅れの設定に依存するのではなく、インジケーターは自身のロジックを動的に更新し、現在の時間枠と取引商品にとって最も収益性の高い構成を見つけ出します。 主な機能 組み込みの自動最適化: 選択した更新頻度に基づいて、システムはFast MA、Slow MA、およびRSIの期間を定期的に再計算し、設定が常に現在の市場のリズムと一致するようにします。 MAダイバージェンスフィルター: 移動平均線が明確に乖離している(広がっている)場合にのみシグナルを検証する、トレンド強度のコア指標です。これにより、移動平均線が収束している相場や平坦なレンジ相場での誤ったエントリーを防ぎ
現在40%オフ 初心者やエキスパートトレーダーに最適なソリューション! このインジケーターは、独自の機能と新しい計算式を取り入れた、ユニークで高品質、かつ手頃な価格のトレーディングツールです。たった1枚のチャートで28の為替ペアの通貨強度を読み取ることができます。新しいトレンドやスキャルピングチャンスの引き金となるポイントを正確に特定することができるので、あなたのトレードがどのように改善されるか想像してみてください。 ユーザーマニュアルはこちら  https://www.mql5.com/en/blogs/post/697384 これが最初の1本、オリジナルだ! 価値のないクローンを買わないでください。 特別な サブウィンドウの矢印で強い通貨の勢いを表示 GAPがあなたのトレードを導く! 基準通貨や気配値が売られすぎ・買われすぎのゾーン(外相フィボナッチレベル)にあるとき、個別チャートのメインウィンドウに警告表示。 通貨がレンジの外側から反落した場合、プルバック/リバーサルのアラート。 クロスパターンの特別なアラート 複数の時間枠を選択可能で、トレンドを素早く確認できます
チャートを構成し、周期的な価格変動を識別するテクニカル指標。 どのチャートでも動作します。 いくつかの種類の通知。 グラフ自体に追加の矢印があります。 履歴を再描画せずに、キャンドルのクローズに取り組みます。 M5以上のTFを推奨します。 パラメータの使用と設定が簡単です。 異なるパラメータを持つ 2 つのインジケーターを使用する場合、他のインジケーターなしで使用できます。 入力パラメータは2つあります 周期性と信号持続時間 これら 2 つのパラメータは、チャート構造の処理を扱います。 Cyclicity - 反転サイクルが変化する頻度を調整し、サイクルを滑らかにします。 Signal duration - 最小数では価格変動の衝動を検出し、最大数では長期的なトレンドの動きを検出します。
The indicator is built on a non-standard Zig Zag, it draws accumulations after which if the price leaves this zone and a test of this zone occurs, then a sound signal is given and an arrow appears - after the test candle closes.The indicator does not redraw its signals, it is very easy to use, there are only three settings 1- this is the zig zag parameter 2- this is the minimum price exit from the zone 3- this is the maximum price exit from the zone. The lower the parameter for Zig Zag, the more
デイトレーダーマスターは、デイトレーダーのための完全なトレーディングシステムです。システムは2つのインジケーターで構成されています。 1つの指標は売買する矢印信号です。それはあなたが得る矢印インジケーターです。 2つ目のインジケーターを無料で提供します。 2番目のインジケーターは、これらの矢印と組み合わせて使用​​するために特別に設計されたトレンドインジケーターです。 インジケーターは繰り返さず、遅れないでください! このシステムの使用は非常に簡単です。 2色の線で表示されている現在のトレンドの方向に矢印信号をたどる必要があります。青は買いの傾向です。赤い色は売りの傾向です。青い矢印は買いシグナルです。赤い矢印は売りの合図です。トレンドラインの色と一致するように、矢印の色と信号の方向が必要です。 矢印インジケーターは、主に時間間隔M5とM15での日中取引のために作成されました。ただし、技術的には、システムは他の時間間隔で使用できます。 インジケータには、PUSHメッセージ機能を備えたポップアップアラートが装備されています。 購入後、必ず私に書いてください!私はあなたにシステムとの取引の
ZigZag Lines MTF
Taras Slobodyanik
4.38 (13)
Multi timeframe ZigZag indicator. It displays the support/resistance horizontal lines and their breakouts, as well as draws the current targets of the market. It can also display lines of the Fractals indicator and candles from other periods (up to Quarterly). So, you can actually see the supply and demand levels. Indicator – connects key lows and highs to show trend lines. You can also use it as indicator for the Break of Structure(BOS) & Market Structure Shift(MSS). The indicator redraws the
作者のその他のプロダクト
This universal advisor is based on its own Algorithm, which is an incredibly effective tool due to the simultaneous operation of a trading strategy based on our  Indicator " Channel Sgnals ProfRoboTrading" and our proprietary signal filter system together with the Martingale method, which together work out a very interesting hedging system. Traders are also given the opportunity to set up their own risk management system with two filters to control deposit drawdowns . The advisor's algorithm is
The Channel Sgnals ProfRoboTrading Indicator for MT5 is an effective Forex trading tool designed to track market movements.   The MT5 signal point indicator effectively detects trend reversals after they have already occurred. This Indicator   is a fully automated technical tool that includes a number of parameters to track market trends.   It automatically examines the ever-changing price dynamics of the market, compares the information with earlier data and generates a trading signal. Because
FREE
The TMA Centered Bands Indicator for MT5 draws bands on the chart and shows the overall price trend. It displays three bands - the lower and upper boundaries of the channel and the median.   The bands are made up of moving averages, and each of them has an MA period. The name TMA comes from triangular moving averages, as the indicator draws triangular bands.   The price will fluctuate between these ranges whenever the trend changes direction, thus creating entry and exit points.   How to trade
FREE
The Extreme Spike PRT Indicator   is an effective tool for identifying   sharp market fluctuations .   It performs its calculations using the ATR (Average True Range) indicator and displays candles with extreme volatility in two categories:   primary spikes   and   secondary spikes , within the Metatrader platform oscillator window. This tool assists traders in detecting   intense price movements   and conducting more precise   analyses   based on these fluctuations. Time Frame 15-minute - 1-ho
Bollinger Bands Stop Indicator holds significant importance for traders navigating the complex world of financial markets. Its relevance lies in several key aspects. Firstly, it aids in trend identification. By analyzing price movements relative to the Bollinger Bands, traders can discern whether the market is in an uptrend, downtrend, or ranging phase. Secondly, the indicator provides valuable insights into market volatility. Wider bands indicate higher volatility, while narrower bands suggest
FREE
The Kalires Channel Indicator is a technical indicator used to evaluate trend direction and potential trading opportunities. This is a hybrid indicator that combines Kauffman Adaptive Moving Average (KAMA), linear regression and smoothing. The Kalires Channel Indicator consists of two lines: one central and two outer bands. The central line is a smoothed KAMA modified according to the direction of the trend. The outer bars represent two linear regression lines drawn above and below the center l
FREE
Our modernized version of the popular channel TMA_TRUE  indicator for MT4, which provides information on the main points of trend reversal and momentum exhaustion by drawing a channel on the chart, also draws arrows of signals for buy and sell. As a result, traders can identify bullish and bearish price reversal zones and BUY and SELL accordingly. This indicator works well on all instruments and on all Timeframes. This indicator is the basis of our Channel Trigger EA, which you can buy in MQL
FREE
The TrendOscillator Indicator is an upgraded version of the traditional Stochastic Oscillator.   It comprises two lines: %K and %D.   The %K line represents the current market position.   In contrast, the %D line is a moving average of the %K line used to generate signals and identify potential entry or exit points. The good thing is the indicator works on all timeframes like the traditional Stochastic.   However, to avoid any false signals, applying the indicator on longer timeframes is better
FREE
Regression_Channel_mod Indicator that expands our standard linear regression channel by adding support and resistance lines. Easy to integrate into other indicators. The linear regression channel consists of several parallel lines equidistant from the upper and lower part of the linear regression trend line. The distance between the channel boundaries and the regression line is equal to the deviation of the maximum closing price from the regression line.
The TrendChannelTracker Indicator is an innovative Forex trading tool. This indicator, which is based on the standard Stochastic Oscillator, provides traders with a unique and simplified method for observing market trends. In contrast to the traditional Stochastic Oscillator, which is shown at the bottom of the chart, the TrendChannelTracker Indicator is built into the price action itself. This removes the need for traders to continually switch their attention between the oscillator and the pri
FREE
The TMA Centered Bands indicator for MT4 draws bands on the chart and reports the overall price trend, as well as gives arrows signals to buy and sell when the bar closes outside the channel. Unlike many TMAs, our version uses the calculation part of the algorithm without redrawing, and also adds the ability to select a symbol. The bands are made up of moving averages, and each of them has an MA period. The name TMA comes from triangular moving averages, as the indicator draws triangular bands
FREE
This indicator works by plotting fractals on the chart as arrows that can be used as buy or sell signals. It is a great tool for both new and experienced traders as it provides a clear visual representation of the market and helps traders identify fractals. Although it repaints, it can be used quite effectively in conjunction with other tools to filter trading strategies. We use this indicator in this way in our Royal Fractals EA, which you can purchase on the MQL5 Market: https://www.mql5.com
FREE
The Red Dragons Support and Resistance Levels indicator automatically determines support and resistance levels using the proprietary algorithm based on historical and current data, so the levels are dynamic, which allows you to adjust trading targets based on the current price movement. For this reason, we use this indicator in our advisors, for example, Red Dragons, which you can purchase here: https://www.mql5.com/en/market/product/128713?source=Site +Market+MT4+New+Rating006 The panel also
FREE
The Forex Gangster Indicator allows you to determine the current trend. If the Forex Gangster Indicator line has moved below the price and turned blue, then you should open deals for an increase. If the Forex Gangster Indicator line has appeared above the price and turned red, then you should open deals for a decrease: The indicator is suitable for any time frames, but it needs to be supplemented with filtering indicators, since by itself it is late and does not have time to give an accurate si
FREE
The BandsFill Indicator is a modified Bollinger Bands with a colored cloud.   It has two adjustable parameters: Period Deviation The cloud is colored as follows: If the price crosses the upper band, the cloud is blue. If the price crosses the lower band, the cloud is pink.   Thanks to this, the BandsFill Indicator provides traders with an easy opportunity to detect various features and patterns in price dynamics that are invisible to the naked eye. Based on this information, traders can predict
FREE
This indicator works by plotting fractals on the chart as arrows that can be used as buy or sell signals. It is a great tool for both new and experienced traders as it provides a clear visual representation of the market and helps traders identify fractals. Although it repaints, it can be used quite effectively in conjunction with other tools to filter trading strategies. We use this indicator in this way in our RoyalFractals II Expert Advisor, which you can purchase on the MQL5 Market: https:
FREE
The Teamtrader Channel Stop indicator allows you to determine the current trend. If the Teamtrader Channel Stop indicator line has moved below the price and turned blue, then you should open deals for an increase. If the Teamtrader Channel Stop indicator line has appeared above the price and turned red, then you should open deals for a decrease: The indicator is suitable for any time frames, but it needs to be supplemented with filtering indicators, since by itself it is late and does not have
FREE
Moving Averages Divergence 3x3    Indicator     uses the crossover technique for signaling the market trend and the trade opportunities as well.     It applies 3 formats of the same indicator and allows them to plot the crossover signals which are interpreted as the trade signals along with the direction of the market trend. Moving Averages Divergence 3x3    Indicator   can be applied to trade all kinds of forex currency pairs within the financial markets.  Although, this indicator works well o
FREE
FOREX GANGSTER is a unique Expert Advisor created by a professional prop trader and financial asset manager with many years of experience. This is a solution for those who strive for stable profits without constant control over each transaction or monitoring the work of a trading advisor. Created for optimal conservative trading and investing through exchange instruments with long-term regular profits and minimal risks. The Expert Advisor algorithm is based on a deep understanding of market pat
The Wolf Wave Finder Indicator is a popular indicator, that is useful in identifying potential trading opportunities.   The indicator works by recognizing the Wolf Wave pattern, which is a well-known pattern used by professional traders to identify potential areas of support and resistance.   The indicator is easy to use and provides traders with an easy way to identify potential trades.   The Wolf Wave Finder Indicator is a great tool for traders who are looking for a reliable and accurate way
This is an easy-to-set-up and easy-to-use Expert Advisor that will help you always have the necessary information about your trading account at hand, sending from MetaTrader 4 to you in Telegram: • Account drawdown • Number of open positions • Volume of open positions • Profit per day, week, month How to get an chat ID: - Chat with BotFather to create Bot and get API Token of Bot. If you had Bot, skip the step. - Chat with bot @userinfobot , then the bot will reply your ID. How to setu
The SYMBOL MANAGER symbol change indicator is an effective tool designed to enhance trading convenience and significantly simplify the trader's experience. This indicator allows users to switch seamlessly between currency pairs and timeframes within a single open window of the trading terminal. Importantly, when switching, the associated template, including indicators and current chart settings, is automatically duplicated, ensuring a consistent trading environment.
Morning Star PRT インジケーターは、朝のフラットブレイクアウト原理を使用します。インジケーターは朝のフラットレベルを表示し、可能なターゲットを示します。 インジケーターには追加のフィボナッチレベルが追加され、設定で指定された両方のターゲットレベルと夜間のフラットレベルの交差点に関するサウンドアラートも追加されました。 Morning Star PRT インジケーターは、夜の終わりに夜間のフラットチャネルと、上下の 2 つのフィボナッチ価格レベルを構築します。これらのレベルは、ターゲットレベルと反転レベルの両方と見なすことができます。 Morning Star PRT インジケーターはすべての時間枠で機能しますが、M15 間隔で使用するのが最も効果的です。 The Morning Star PRT indicator uses the morning flat breakout principle. The indicator displays morning flat levels and shows possible targets. An additiona
インジケーター サプライ & デマンド ゾーン PRT – は、チャートのサプライ ゾーンとデマンド ゾーンのマーキングを実行するために使用されるカスタム ツールです。インジケーターは、抵抗/サポート レベルとサプライ/デマンド ゾーンを強調する線と長方形をチャート上に描画します。便宜上、線と数字は両方とも異なる色で塗られており、シグナルを互いに簡単に区別できます。インジケーターは、まだ使用されていない、価格がまだ突破していない新しいレベルのみを描画します。初心者と経験豊富なトレーダーの両方に最適です。 インジケーターは、スキャルピング、トレンド、カウンタートレンド、その他のトレーディング システムで使用されます。これは、あらゆる戦略の一部に簡単に組み込むことができる汎用アルゴリズムです。すべての時間枠とインストルメントで適切に表示され、オシレーターとうまく組み合わせることができます。 Indicator Supply & Demand zones PRT– is a custom tool that is used to perform supply and demand zon
このインジケーターは、チャートパターンを特定したいトレーダーにとって強力なツールであり、トレーディング戦略に組み込むことのメリットは数多くあります。このツールは、金融市場の潜在的なトレンドと反転を効果的に特定して通知し、トレーディングの収益性を高めます。高度なアルゴリズムのおかげで、インジケーターは市場データを正確に分析し、トレーダーに情報に基づいた決定を下すのに役立つ貴重な情報を提供します。このインジケーターを使用すると、チャートパターンを高精度で自動的に特定するため、より包括的な市場分析が可能になります。これらのパターンは、多くの場合、特定の方向への潜在的な価格変動を示します。したがって、この情報にアクセスできると、トレーダーは、これらのパターンを認識できないか、その意味を理解できない可能性のある他の市場参加者よりも有利になります。 このインジケーターは、強気と弱気のパターン認識機能を幅広く備えています(チャート上の略称は括弧内に表示されます)。 - Rising Star(SS) - Evening Star(E_Star) - Evening Doji Star(E_
This universal expert advisor is based on our own Algorithm, which is based on effective and time-tested Elliot Wave Theory.  This   expert advisor   is ideal for working both on a flat and during sharp or protracted trend movements (thanks to the Martingale method, according to which averaging positions are opened in accordance with the multiplier and distance set in the settings for accepting a new signal). ATTENTION! CAREFULLY STUDY THE OPERATING PRINCIPLE AND AVAILABLE SETTINGS OF THE EXPER
This is the automatic price spike signal indicator for MT4. Plots advance alerts on potential breakouts/pullbacks. Suits forex, stocks & crypto trading strategies. This is a perfect indicator for reversal traders. A spike often indicates a turn-around moment. The best way to use that gauge is to apply it to your favourite trading system as a filter. 這是 MT4 的自動價格飆升訊號指示器。繪製有關潛在突破/回調的預先警報。適合外匯、股票和加密貨幣交易策略。 對於反轉交易者來說,這是一個完美的指標。尖峰通常表示轉變時刻。使用該指標的最佳方法是將其作為過濾器應用到您最喜歡的交易系統中
パラボリック SAR およびサポート/レジスタンス レベルは、潜在的なトレンドの反転やエントリー ポイントとエグジット ポイントを識別するために外国為替取引で使用されるテクニカル分析インジケーターであるだけでなく、既製の自律的な取引戦略でもあります。 このインジケーターは、チャートに動的なサポート レベルとレジスタンス レベルを追加することで PSAR インジケーターを基盤としており、トレーダーが市場が反転する可能性のある主要な価格レベルを特定するのに役立ちます。 このインジケーターを使用すると、トレーダーは市場の強さと方向、および取引の潜在的なエントリー ポイントとエグジット ポイントに関する洞察を得ることができます。 パラボリック SAR およびサポート/レジスタンス レベル インジケーターは、チャートにさまざまなパラボリック サポートとレジスタンス (PSAR) レベルをプロットするテクニカル分析ツールであり、トレーダーに潜在的なトレンドの反転シグナルを提供します。 このインジケーターは、メインの MT4 チャート ウィンドウに一連の水平に並んだ線として表示されるため、トレ
The All Market Channels indicator from ProfRobotrading automatically builds and displays all formed trading channels on the screen. This indicator is very convenient for trading on all existing channel strategies and is applicable to all instruments and timeframes.  Look at the screenshot - it will tell you more :) More information is available on our website ProfRoboTrading. ProfRobotrading の All Market Channels インジケーターは、形成されたすべての取引チャネルを自動的に構築して画面に表示します。このインジケーターは、既存のすべてのチャネル戦略での取引に非常に便利で、す
This is a Bollinger Bands Compression indicator. It detects volatility compression and the release of “suppressed momentum.” It can be used when it coincides with any specific trading entries — released volatility means a higher probability of making a decent profit. There is also a histogram with colored bands symbolizing weakness or strength, and a zero line crossover. Therefore, this indicator can be used both in conjunction with other indicators within trading strategies, and on its own meri
フィルタ:
レビューなし
レビューに返信